[table]labelsep=period,labelfont=bf,rm
\captionsetup[figure]labelfont=bf,labelsep=period
ICN2]22footnotemark: 2 ICN2 - Institut Català de Nanociència i Nanotecnologia, ICN2 Building, Campus UAB, E-08193 Bellaterra (Barcelona), Spain
\alsoaffiliation[CSIC]
33footnotemark: 3 CSIC - Consejo Superior de Investigaciones Científicas, ICN2 Building, Campus UAB, E-08193 Bellaterra (Barcelona), Spain
UPV/EHU]
55footnotemark: 5 Nano-Bio Spectroscopy Group and ETSF Scientific Development Center, Departamento de Física de Materiales, Universidad del País Vasco UPV/EHU and DIPC, E-20018 San Sebastián, Spain
USTC]
44footnotemark: 4 Department of Physics and ICQD/HFNL, University of Science and Technology of China, Hefei, Anhui 230026, China
\alsoaffiliation[SICQI]
66footnotemark: 6 Synergetic Innovation Center of Quantum Information & Quantum Physics, University of Science and Technology of China, Hefei, Anhui 230026, China
UP]
⟂Department of Physics and Astronomy, University of Pittsburgh, Pittsburgh, Pennsylvania 15260, USA
Quasiparticle interfacial level alignment of highly hybridized frontier levels: HO on TiO(110)
ABSTRACT:
Knowledge of the frontier levels’ alignment prior to photo-irradiation is necessary to achieve a complete quantitative description of H2O photocatalysis on TiO2(110). Although H2O on rutile TiO2(110) has been thoroughly studied both experimentally and theoretically, a quantitative value for the energy of the highest H2O occupied levels is still lacking. For experiment, this is due to the H2O levels being obscured by hybridization with TiO2(110) levels in the difference spectra obtained via ultraviolet photoemission spectroscopy (UPS). For theory, this is due to inherent difficulties in properly describing many-body effects at the H2O–TiO2(110) interface. Using the projected density
![[Uncaptioned image]](/html/1501.03533/assets/x1.png) of states (DOS) from state-of-the-art quasiparticle (QP) , we disentangle the adsorbate and surface contributions to the complex UPS spectra of H2O on TiO2(110). We perform this separation as a function of H2O coverage and dissociation on stoichiometric and reduced surfaces. Due to hybridization with the TiO2(110) surface, the H2O 3a1 and 1b1 levels are broadened into several peaks between and eV below the TiO2(110) valence band maximum (VBM). These peaks have both intermolecular and interfacial bonding and antibonding character. We find the highest occupied levels of H2O adsorbed intact and dissociated on stoichiometric TiO2(110) are and eV below the VBM. We also find a similar energy of 1.1 eV for the highest occupied levels of H2O when adsorbed dissociatively on a bridging O vacancy of the reduced surface. In both cases, these energies are significantly higher (by 0.6 to 2.6 eV) than those estimated from UPS difference spectra, which are inconclusive in this energy region. Finally, we apply self-consistent QP (scQP1) to obtain the ionization potential of the H2O–TiO2(110) interface.
of states (DOS) from state-of-the-art quasiparticle (QP) , we disentangle the adsorbate and surface contributions to the complex UPS spectra of H2O on TiO2(110). We perform this separation as a function of H2O coverage and dissociation on stoichiometric and reduced surfaces. Due to hybridization with the TiO2(110) surface, the H2O 3a1 and 1b1 levels are broadened into several peaks between and eV below the TiO2(110) valence band maximum (VBM). These peaks have both intermolecular and interfacial bonding and antibonding character. We find the highest occupied levels of H2O adsorbed intact and dissociated on stoichiometric TiO2(110) are and eV below the VBM. We also find a similar energy of 1.1 eV for the highest occupied levels of H2O when adsorbed dissociatively on a bridging O vacancy of the reduced surface. In both cases, these energies are significantly higher (by 0.6 to 2.6 eV) than those estimated from UPS difference spectra, which are inconclusive in this energy region. Finally, we apply self-consistent QP (scQP1) to obtain the ionization potential of the H2O–TiO2(110) interface.
1. INTRODUCTION
The photooxidation activity of a surface is determined by the interfacial level alignment between the occupied adsorbate levels and those of the substrate 1, 2. Water photooxidation on TiO2 has attracted enormous attention 3, 4, 5, 6, 7, 8, 9, 10 for energy applications 11, 12 based on H2 production 13. This reaction also plays an important role in photocatalytic environmental remediation and surface self-cleaning/sterilizing.1, 2, 14 This is because the resulting hydroxyl radicals are the key intermediates in the oxidative degradation of organic species 15, 16. To understand water photooxidation, it is necessary to understand the interfacial level alignment between the occupied levels of HO and the TiO2 substrate 17.
Experimentally, the most common approach to access the adsorbate levels is to take the difference between the covered and clean surface spectra from photoemission spectroscopy. However, when the adsorbate and surface levels are strongly hybridized, it becomes difficult to disentangle the adsorbate and surface contributions to the UPS spectra using only the difference spectra18. For example, shifting of the surface levels due to hybridization or band bending may completely obscure the adsorbate levels 18. Further, the adsorbate levels near the valence band maximum (VBM) are the most likely to be obscured. It is precisely these levels that are most important for photooxidation processes. Using a theoretical approach, one can directly disentangle the molecular levels by projecting the density of states (DOS) of the interface onto the atomic orbitals of the molecule. Altogether, this makes a robust theoretical approach necessary to accurately predict the alignment of the adsorbate and substrate levels, and separate the adsorbate and surface spectra.
A robust theoretical treatment requires quasiparticle (QP) to capture the anisotropic screening of the electron–electron interaction at the interface 19, 20, 21. As previously demonstrated for CH3OH on TiO2(110), QP is necessary to obtain even a qualitative description of the level alignment 22, 23, 24. For this interface, the occupied levels of the molecule are only weakly hybridized with the surface levels. This allowed an unambiguous comparison to the photoemission difference spectrum 22. However, for H2O on rutile TiO2(110), this is not the case.
The occupied molecular levels of HO on single crystal rutile TiO(110) have been probed via ultraviolet photoemission spectroscopy (UPS) 18, 25, 26 and metastable impact electron spectroscopy (MIES)26. These experiments were performed under ultrahigh vacuum (UHV) conditions from low to room temperature 25, from 0.01 to 100 L H2O exposure 18, and for various surface preparations resulting in either reduced TiO2-x(110) with surface oxygen defects or “nearly-perfect” TiO2(110) 18. Altogether, these experiments have addressed the long-standing controversy as to where and how H2O adsorbs and dissociates on TiO2(110) 27, 28, 29, 30, 31, 32, 33, 34, 35, 36.
At 150 K the photoemission difference spectrum between H2O covered and clean TiO2(110) surfaces consists of three peaks, which are attributed to intact H2O adsorbed on Ti coordinately unsaturated sites (Ti) 25. Upon heating to 300 K, the difference spectrum’s three-peak structure evolves into a two-peak structure, which is attributed to dissociated H2O adsorbed on bridging O vacancies (O), i.e., OH surface species 25. This assignment of the UPS spectra to intact (I) H2O@Ti or dissociated (D) H2O@O is based on the peak energy separations being consistent with those reported for H2O37 in gas phase or OH- in NaOH38.
A comparison to the H2O and OH- peaks is robust for the molecular levels that lie below and have little hybridization with the surface DOS. However, the adsorbate levels that lie within the surface valence band may significantly hybridize with the surface, with a single molecular level contributing to many interfacial levels. These interfacial levels are thus not easily associated with H2O and OH- levels. This is exacerbated by the mixing of the molecular levels due to symmetry breaking at the interface. As a result, “between 5 and 8 eV” below the Fermi level, experimentally they “are unable to produce reliable difference structures” from the UPS spectra obtained for “nearly-perfect” TiO2(110) exposed to H2O at 160 K 18.
Using the QP H2O projected DOS (PDOS), we have disentangled the adsorbate and surface contributions to the UPS spectra within this difficult energy range. This has been done as a function of H2O coverage and dissociation on stoichiometric and reduced surfaces. In so doing, we provide quantitative values for the energies of the highest H2O occupied levels, prior to photo-irradiation, for a number of experimentally relevant6, 7, 15, 3, 5 H2O–TiO2(110) structures.
To directly compare to red-ox potentials, the important quantities for determining photoelectrocatalytic activity, one needs the alignment relative to the vacuum level, .39, 40 With this, one obtains the ionization potential directly from . To obtain a more accurate absolute level alignment, we employ our recently introduced self-consistent QP 41, 42, 43 technique scQP 22.
The presentation of the results is organized as follows. First, we focus on the H2O levels that lie below and have little hybridization with the substrate DOS. This is done for intact H2O@Ti in Section 3.1 and dissociated H2O@O in Section 3.2. Further, in Section 3.3, we shown that these results are rather independent of the choice of xc-functional. In so doing we provide evidence for a robust semi-quantitative agreement with the UPS difference spectra for the adsorbate levels for which an unambiguous comparison with the experiment is possible. For a more complete understanding of the UPS experiments, in Section 3.4 we analyze the H2O PDOS for a variety of other H2O structures on the stoichiometric and reduced surfaces. These may form under different experimental conditions and surface preparations. In Section 3.5 we focus on the highest H2O occupied levels, which are significantly hybridized with the substrate DOS. The success of the QP PDOS strategy for the lower-energy part of the UPS difference spectra provides support for our results in this difficult spectral region, where a straightforward comparison with experiment is not possible. Finally, in Section 3.6, we employ scQP1 to obtain an improved absolute level alignment relative to , and thus estimate the ionization potential of the HO–TiO(110) interface.
2. METHODOLOGY
Our QP calculations44, 45, 46 have been performed using vasp within the projector augmented wave (PAW) scheme 47. The calculations are based on Kohn-Sham wavefunctions and eigenenergies from density functional theory (DFT) obtained using a generalized gradient approximation (PBE) 48 for the exchange correlation (xc)-functional 49. The dependence of the QP DOS and PDOS on the DFT xc-functional has been tested for 1 ML intact H2O@Ti of stoichiometric TiO2(110) and ML dissociated H2O@O of defective TiO(110) with ML of O. For these structures, calculations based on the local density approximation (LDA) 50, van der Waals (vdW-DF) 51, and the range-separated hybrid (HSE) 52 xc-functionals have been carried out for comparison with the PBE based calculations. In particular, we use the HSE06 53 variant of the HSE xc-functional.
In the QP approach, the contribution to the Kohn-Sham (KS) eigenvalues from the exchange and correlation (xc)-potential is replaced by the self energy , where is the Green’s function and is the screening 44 based on the KS wavefunctions 45. The dielectric function is obtained from linear response time-dependent (TD) density functional theory (DFT) within the random phase approximation (RPA), including local field effects 46. From one obtains first-order QP corrections to the KS eigenvalues, but retains the KS wavefunctions. Since our aim is to compare the computed interfacial level alignment with measured UPS spectra, it is most consistent to align the QP levels with the VBM.
We find , i.e., the effective potential far from the surface, from is essentially the same as the from DFT. In other words, the effective potential is unchanged by . To obtain a more accurate absolute QP level alignment relative to , we employ a self-consistent QP approach41. In particular, by employing the scQP1 approach, we obtain both a QP PDOS comparable to that from QP and an improved alignment relative to . 22, 23. Here, 25%, 25%, and 50%, of the QP self energies are “mixed” with the DFT xc-potential over three self-consistent QP cycles 41, respectively. If, instead, 100% of the DFT xc-potential were replaced by QP self energy in a single self-consistent QP cycle, one would exactly obtain the QP eigenvalues. However, this mixing is required to obtain a smooth convergence of both the QP wavefunctions and the absolute QP level alignment. To fully converge our self-consistent QP calculations (scQP), we perform a further eight cycles, with each introducing a further 25% of the QP self energy.
The geometries have been fully relaxed using LDA50, PBE48, or vdW-DF51 xc-functionals, with all forces 0.02 eV/Å. HSE calculations are performed for the relaxed geometries obtained with PBE. We employ a plane-wave energy cutoff of 445 eV, an electronic temperature eV with all energies extrapolated to K, and a PAW pseudopotential for Ti which includes the 3 and 3 semi-core levels. All calculations have been performed spin unpolarized.
For the clean stoichiometric TiO2(110) surface 23 we have used a four layer slab and an orthorhombic unit cell of Å3, i.e.,
| (1) |
where Å is the vacuum thickness and and are the experimental lattice parameters for bulk rutile TiO ( Å, Å) 54. We have employed a -centered k-point mesh, and 320 bands = 9 unoccupied bands per atom, i.e. including all levels up to 26 eV above the valence band maximum (VBM).
For the clean reduced TiO(110) surface we have used a monoclinic unit cell of Å3, i.e.,
| (2) |
to maximize the separation between the O. For the H2O covered surfaces, we have employed a four layer slab with adsorbates on both sides and an orthorhombic unit cell of Å3, i.e.,
| (3) |
where Å. We employed a centered k-point mesh, with approximately 9 unoccupied bands per atom, i.e. including all levels up to 30 eV above the VBM, an energy cutoff of 80 eV for the number of G-vectors, and a sampling of 80 frequency points for the dielectric function. The parameters are consistent with those previously used for describing rutile TiO2 bulk, TiO2(110) clean surface and interfaces22, 23. These parameters have been shown to provide accurate descriptions of bulk optical absorption spectra, and both clean surface and interfacial level alignment22, 23.
To model H2O in the gas phase, we employed a unit cell with C2v symmetry and 16 Å of vacuum in each direction. At the level, we used a smaller energy cutoff of 40 eV for the number of G-vectors, which has previously shown to provide an accurate description of the optical absorption spectra for isolated molecules 55, 56.
To obtain DFT total energies and the relaxed structure of the clean reduced TiO(110) we have used a monoclinic unit cell of Å3, i.e.,
| (4) |
where Å, and employed a -centered k-point mesh.
In this study, we have performed PBE and subsequent single-point RPBE57 based DFT calculations for the H2O adsorption energies on the stoichiometric and reduced surfaces. The RPBE xc-functional was especially developed for the prediction of adsorption properties on metal surfaces 57. The H2O adsorption energy on the Ti site of a stoichiometric TiO2(110) surface is given by
| (5) |
where is the number of adsorbed H2O functional units in the supercell, and , , and are the total energies of the covered and clean stoichiometric surfaces and gas phase water molecule, respectively. Similarly, the H2O adsorption energy on the O site of a reduced TiO2-x(110) surface is given by
| (6) |
where and are the total energies of the covered and clean reduced surfaces, respectively.
3. RESULTS AND DISCUSSION
3.1. Intact HO on the Stoichiometric Surface
In Figure 1
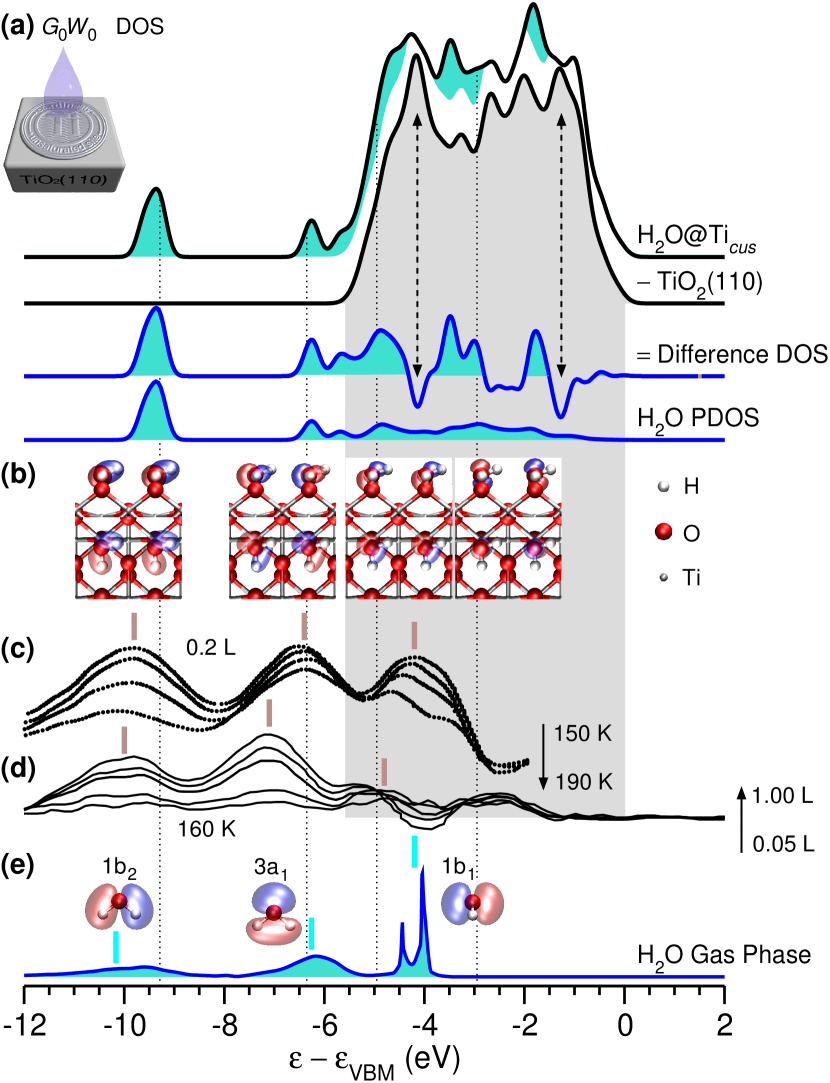
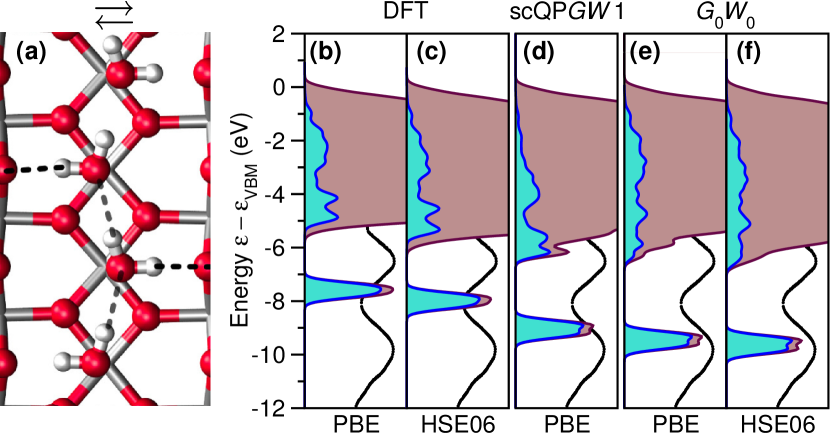
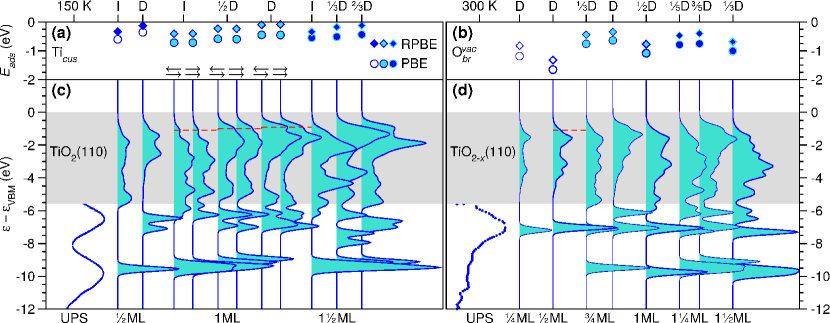
we disentangle adsorbate and substrate contributions to the spectrum of intact HO@Ti, and compare the H2O PDOS to the theoretical and experimental difference DOS. Specifically, we model a monolayer (ML) of H2O molecules with parallel () interfacial hydrogen bonds aligned along the [001] direction (Figure 1(b))58, 59. Note that 1ML of intact H2O is the most stable coverage and structure on the stoichiometric rutile TiO2(110) surface 32.
The theoretical difference DOS is the difference between the total DOS of the H2O covered (HO@Ti) and clean stoichiometric (TiO2(110)) surfaces, as shown schematically in Figure 1(a). Turquoise areas in the H2O@Ti and difference DOS indicate regions of greater density for the H2O covered versus clean stoichiometric surface. The gray area indicates the DOS energy range for the clean stoichiometric TiO2(110) surface. Figure 1(c) and (d) show two sets of UPS difference spectra obtained either by raising the temperature (from 150 K to 190 K) for a consistent exposure to H2O (0.2 L) for an annealed TiO2(110) surface25 (Figure 1(c)), or by increasing the H2O dose (from 0.01 L to 1 L) at low temperature (160 K) for a nearly perfect surface18 (Figure 1d). The experimental spectra have been referenced to the VBM, which is positioned 3.2 eV below the experimental Fermi level.23
Comparing the difference DOS to the H2O PDOS, we find the peaks lying outside the TiO2(110) DOS energy range are clearly attributable to H2O levels. As shown in Figure 1(b), these levels are related to the 1b2 and 3a1 H2O orbitals shown in Figure 1e. This is not the case within the TiO2(110) DOS region, where the adsorbate levels are broadened by hybridization with the surface. This hybridization with the surface has been severely underestimated by previous cluster-based MP2 calculations60. Within the TiO2(110) DOS region, the peaks in the H2O PDOS have corresponding peaks in the difference DOS, although the relative peak intensities differ substantially between the two methods. More importantly, the difference DOS has dips centered at , , and eV, where there are adsorbate levels in the PDOS, and a peak at eV, where there are no adsorbate levels in the PDOS. The dips at and eV correspond to the O 2pσ and O 2pπ peaks in the TiO2(110) DOS 61, respectively, as marked in Figure 1(a). These peaks split due to mixing with the 3a1 and 1b1 H2O orbitals. This splitting is the origin of the observed dips in the difference DOS, which are also seen experimentally in Figure 1(c) and d.
The peak at eV in the H2O PDOS, which has 1b2 molecular character, agrees semi-quantitatively with the most strongly bound experimental peaks at eV (Figure 1(c)) or eV (Figure 1d). The peak at eV in the H2O PDOS, which has intermolecular 3a1 bonding character, agrees semi-quantitatively with the experimental peaks at eV (Figure 1(c)) or eV (Figure 1d). Note that the theoretical average deviation is within that amongst the experiments. This may reflect differences in sample preparation, which result in a variety of different H2O configurations, i.e., H2O coverages, O concentrations, and mixtures of intact and dissociated H2O. As we will show in Section 3.4, by considering a variety of H2O structures a more complete description of the experiment is obtained. Altogether, this agreement for the and eV PDOS peaks lends confidence to our results for regions where the experimental results are unclear.
The assignment of the peaks located within the TiO2(110) DOS is much more complicated. The assumption that the highest peak in the experimental spectra originates solely from the H2O 1b1 level 25, 26 is an oversimplification. In fact, both the 3a1 and 1b1 molecular levels contribute within this region (Figure 1(b)). While the levels with intermolecular 3a1 bonding character give rise to a distinct peak below the TiO2(110) DOS region, those with intermolecular 3a1 antibonding character are pushed to higher energies and mixed with the 1b1 molecular levels (Figure 1(b)). The latter is due to symmetry breaking at the interface. Consequently, the H2O PDOS is broadened into several peaks between and eV. These levels have interfacial (3a1/1b1– O 2pσ/2pπ) bonding and antibonding character (not visible at the isosurface value used).
3.2. Dissociated HO on Reduced Surfaces
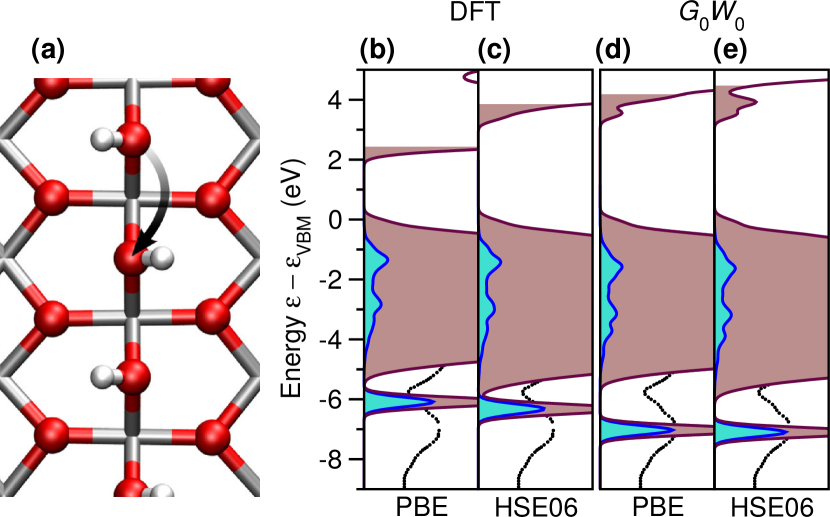
To see how dissociation of H2O@O affects the spectrum, we now consider ML of H2O dissociated on a reduced TiO(110) surface (Figure 2).
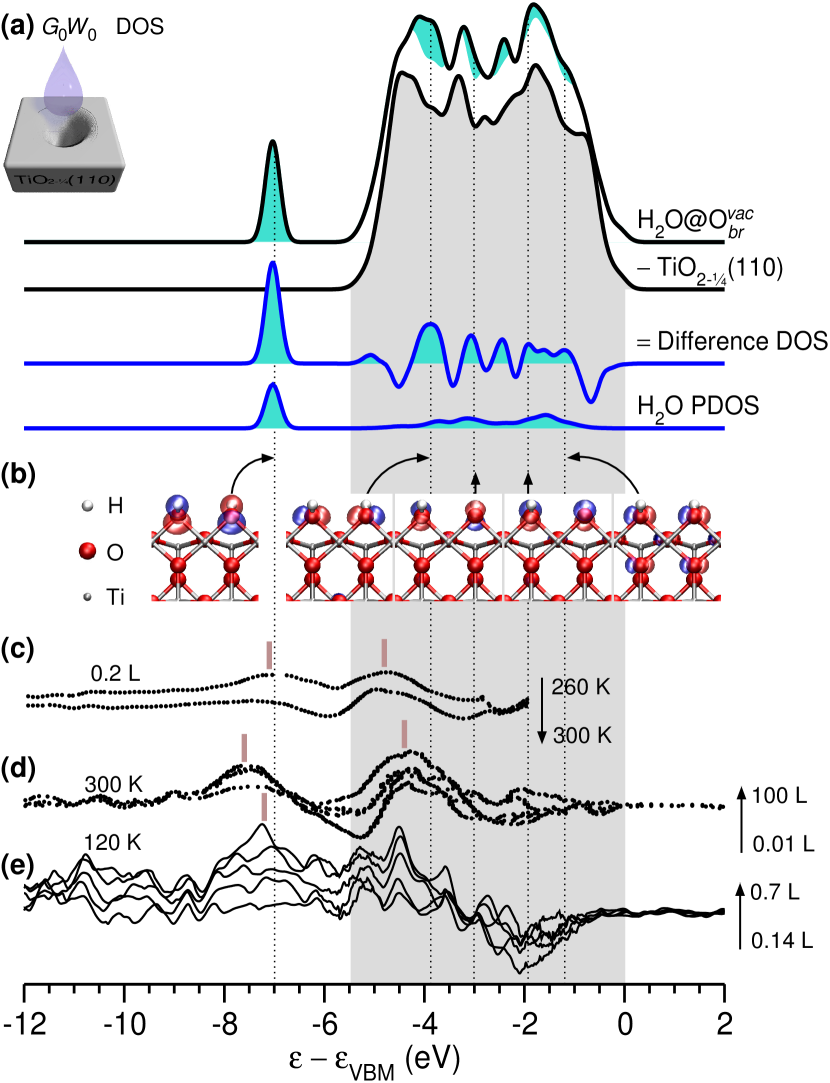
Here, we have used TiO(110) to denote a surface consisting of ML of O defects. This structure corresponds to the staggered OH surface species, shown in Figure 2(b).
The theoretical difference DOS is the difference between the total DOS of the H2O covered (H2O@O) and the clean reduced (TiO(110)) surfaces, shown schematically in Figure 2(a). Turquoise areas in the H2O@O and difference DOS indicate regions of greater density for the H2O covered versus clean reduced surface. The gray area indicates the DOS energy range for the clean reduced TiO(110) surface. The O defects give rise to occupied levels with Ti 3d character that are just below the conduction band minimum and outside the energy range shown.62, 63, 64 Note that the H2O PDOS includes half the O atoms and all the H atoms that make up the OH species. In this way the PDOS is provided in terms of H2O formula units.
The peak in the difference DOS and PDOS at eV has OH character, as shown in Figure 2(b). Note that the peak intensity in the PDOS is about half that in the difference DOS, as the PDOS includes half the O atoms. This peak’s position agrees semi-quantitatively with the experimental peaks at (Figure 2(c)), (Figure 2d), or eV (Figure 2e). The PDOS has a broader feature between and eV, due to hybridization with the surface. This feature is associated with contributions coming from the bonding and antibonding combinations of two distinct p orbitals of the OH species (Figure 2(b)): one perpendicular to the OH bonds (the so-called OH level of NaOH 38); the other in the plane of the OH bonds. The lowest of these peaks at eV corresponds to the bonding combination of the OH levels. This peak’s position agrees semi-quantitatively with the consistently observed experimental peaks at , , and eV in Figures 2(c), 2d, and 2e, respectively. However, the antibonding OH levels are shifted to much higher energies ( eV), as shown in Figure 2(b).
Much of the theoretical difference DOS’s structure is attributable to the defect healing of O, as seen from the difference DOS between TiO2(110) and TiO(110) in Figure 3.
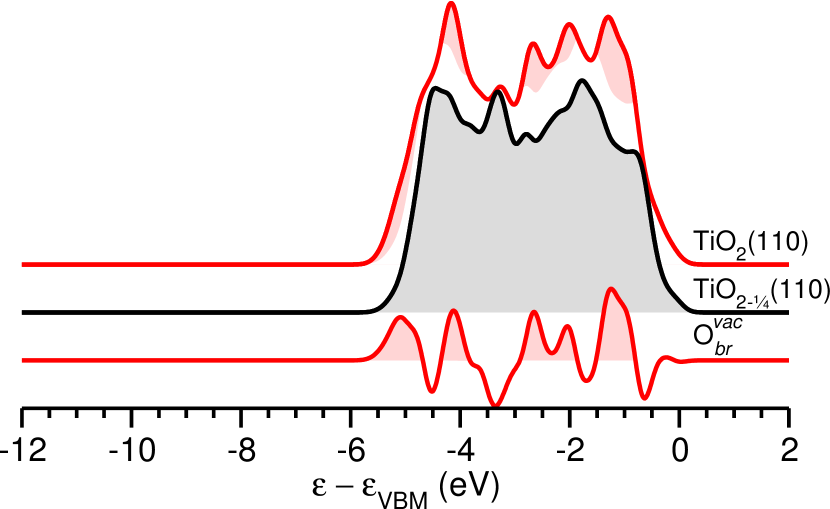
This suggests that the observed features in the experimental difference spectra overlapping with the reduced surface’s DOS are simply O levels reintroduced by dissociated H2O@O. In particular, the peak which is usually attributed to OH levels is actually composed of O surface levels unrelated to the presence of H atoms.
3.3. XC-Functional and Methodology Dependence of HO Spectra for Stoichiometric and Reduced Surfaces
To assess the robustness of the calculated QP H2O PDOS, we consider its dependence on the xc-functional and methodology. Specifically, we compare the H2O PDOS from DFT, scQP1, and for 1ML intact H2O@Ti with parallel () and antiparallel () interfacial hydrogen bonds and ML dissociated H2O@O in Figures 4, 5, and 6, respectively.
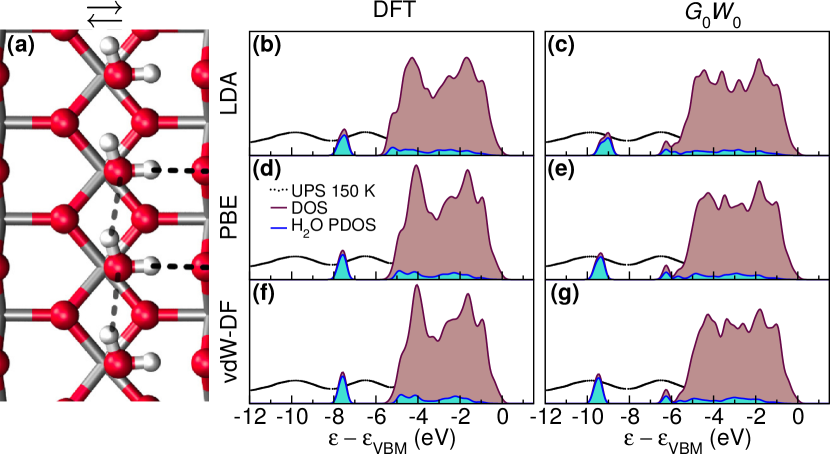
We find the observed structure of the H2O PDOS is independent of whether the local density approximation (LDA)50, generalized gradient approximation (PBE)48, long-ranged van der Waals interactions (vdW-DF)51, or a range-separated hybrid (HSE06)53 are employed for the xc-functional. This is consistent with the previously reported similarities between PBE and HSE based PDOS for CH3OH on TiO2(110)23. This is despite the greater differences observed amongst the DFT H2O PDOS, which all differ qualitatively from the experiments. Furthermore, the H2O PDOS is robust to the resulting changes in the H2O height above the surface, i.e., the distance between H2O and Ti , shown in Table 1. Furthermore, Figure 5(d,e) shows that scQP1 provides a similar H2O PDOS level alignement to . This is consistent with what was previously reported for the CH3OH–TiO2(110) interface 22, 23.
We clearly see that the differences between the DFT and PDOS, i.e., the QP energy shifts, are far from simply being rigid. For instance, we find for PBE that the QP energy shifts for the levels that contribute to the highest-energy PDOS peak are almost negligible (cf. Figures 4(d,e) and 5(b,e)) . As a result, the QP is only eV lower compared to DFT. On the other hand, we find significant QP shifts to stronger binding for the levels that contribute to the most strongly bound PDOS peak with 1b2 molecular character. For example, with PBE the QP lowest energy peak is shifted by eV compared to DFT (cf. Figures 4(d,e) and 5(b,e)).
As previously shown for the CH3OH–TiO2(110) interface, these differences in the shifts of the peaks are directly related to differences in the spatial distribution of the wave functions for the levels contributing to the peaks.22, 23, 24 This is because the QP corrections to the DFT eigenenergies for interfaces are directly correlated with the spacial distribution of the wave functions.22, 23, 24 The negligible shift of the DFT highest-energy PDOS peak (Figures 4 (b,d,f) and 5(b,c)) is due to its strong hybridization with the surface, i.e., weight on TiO2(110), for the levels contributing to this peak.22, 23, 24 On the other hand, the levels that contribute to the most strongly bound PDOS peak have little weight on TiO2(110), and have character. Both their localized H2O character as well as their nature explain why these levels have large QP energy shifts to stronger binding.22, 23, 24
Oxygen defective and hydroxylated ()TiO2 surfaces have occupied 3d levels which are associated with reduced Ti3+ atoms 64. One such example is the ML dissociated H2O@O on reduced TiO(110) with ML of O shown in Figure 6(a). The spacial distribution of the 3d density for O defective surfaces has been characterized by low temperature scanning tunneling microscopy (STM)63, 67. STM measurements find at 77 K the 3d density is homogeneously distributed along the [001] direction,63 while at K the 3d density exhibits an asymmetric localized character.67
A localized description of the Ti3+ occupied 3d levels is not obtained from DFT with standard xc-functionals. For example, the occupied 3d levels obtained with PBE are highly delocalized, as clearly shown in Figure 6(b). This is due to self-interaction errors which are inherent in such xc-functionals. If one performs spin-polarized DFT calculations with a hybrid xc-functional on such systems, one obtains localized Ti3+ 3d1 levels between 0.7 and 1.6 eV below the CBM, along with a structural deformation of the TiO2(110) surface64, 63. However, spin-paired calculations with HSE06 on the PBE relaxed geometry only yield an occupied shoulder at the CBM (Figure 6(c)). At the QP level based on PBE, this shoulder evolves into a distinct peak about 0.6 eV below the Fermi level, . This effect is even more pronouced when the calculation is based on HSE06 (cf. Figure 6(d,e)), which yields peaks at 0.6 and 0.9 eV below . As compared to PBE, HSE06 shifts the unoccupied 3d levels further up in energy revealing the double peak structure. These energies are in very good agreement with the peak at 0.8 eV below in the UPS spectra of HO@O of Figure 2(d). This peak is not shown in Figure 2(d) as it is slightly above 2 eV with respect to VBM.18 However, note that overestimates by about 1 eV the VBM position relative to as compared with UPS experiments.18
This result is completely independent of the wavefunction’s spacial distribution, i.e., localization, as the calculations are based on the KS wavefunctions. This is different from previous findings, which showed DFT with either PBE or hybrid xc-functionals is only giving distinct peaks for the occupied 3d levels provided the relaxed spin-polarized distorted structure is used in the calculations.64, 63
While for based on PBE and HSE06 one sees noticeable differences in the description of the 3d occupied levels, the QP H2O PDOS and its alignment relative to the VBM are unchanged. Although localization of the Ti3+ occupied levels and associated structural deformations are absent from our approach, such features should not significantly alter the QP H2O PDOS. This is because the Ti3+ levels are too far above the VBM ( eV64) to hybridize with the H2O. Moreover, as we will show in Section 3.4, the QP H2O PDOS is rather robust to local deformations of the surface structure, e.g., due to changes in coverage.
3.4. Coverage and Dissociation Dependence of HO Spectra for Stoichiometric and Reduced Surfaces
As different experimental conditions and surface preparations have been employed, there are expected to be different H2O structures on the surface. To evaluate how strongly the DOS depends on the adsorption geometry, we now consider a variety of coverages of intact and dissociated H2O on rutile stoichiometric TiO2(110) (Figure 7) and reduced TiO(110) (Figure 8)
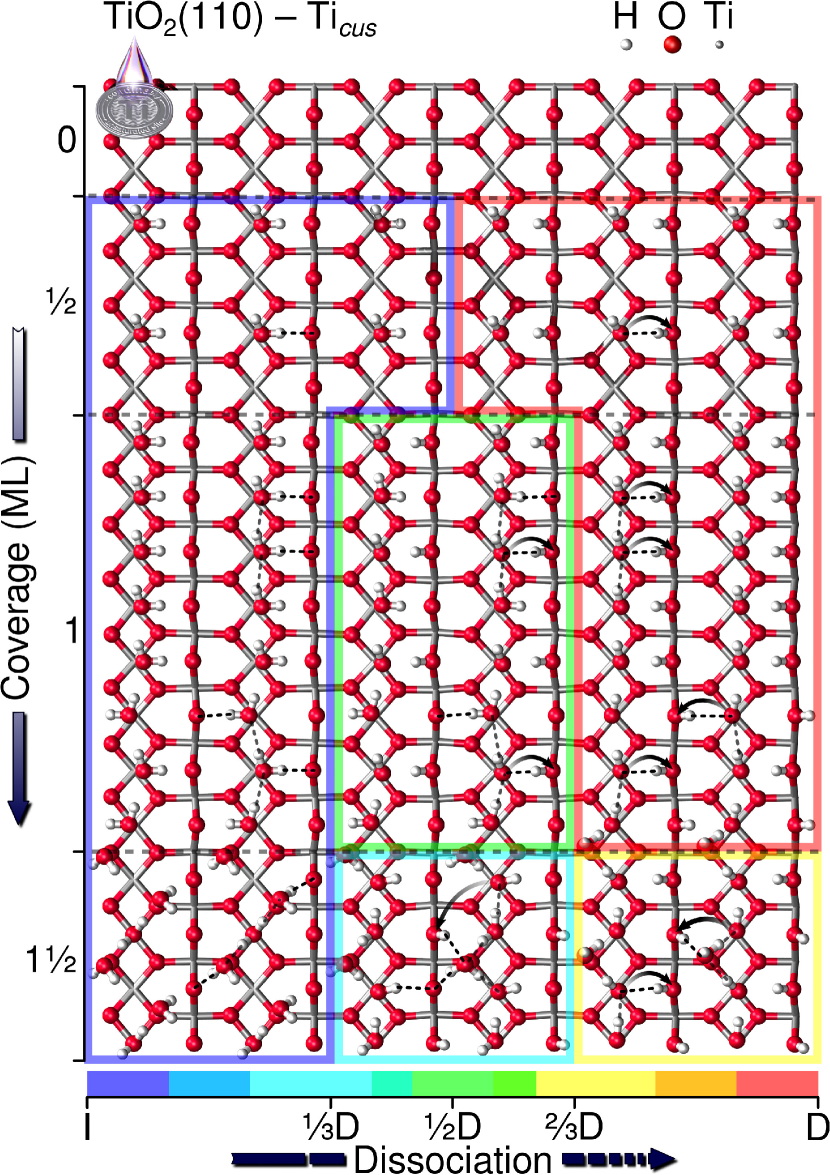
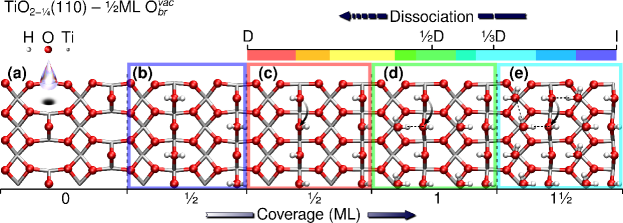
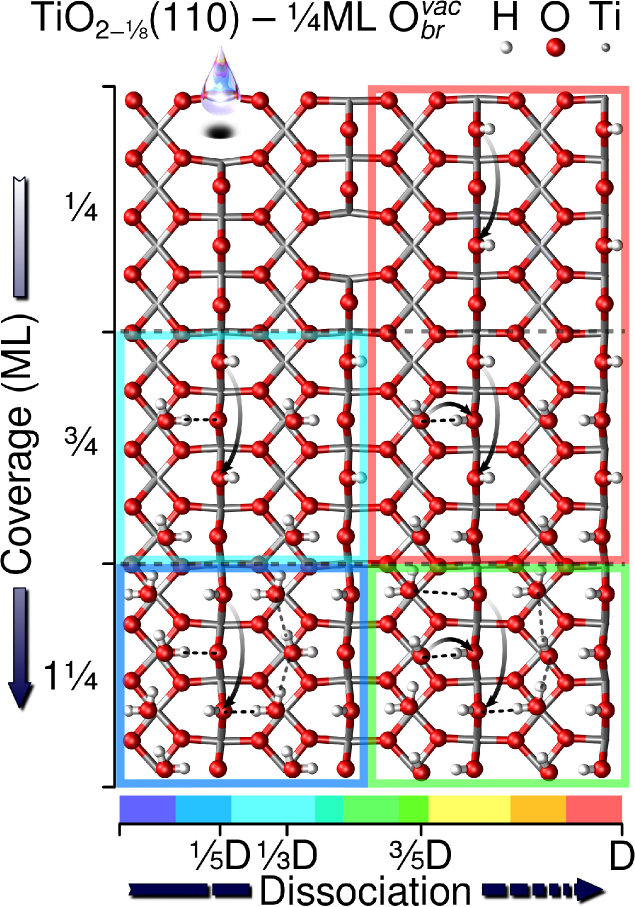
and TiO(110) (Figure 9) with ML and ML of O defects, respectively. The relative importance of these geometries is illustrated in Figure 10(a) and 10(b) by the average absorption energy per H2O molecule on the stoichiometric or reduced surfaces68 with either PBE48 or RPBE57 xc-functionals. In so doing, the contribution of different structures to the measured spectra can be disentangled. Note that an intact ML of H2O@O (Figure 8(b)) is probably only a transient locally stable state of the reduced H2O–TiO(110) interface29, which may easily evolve into the eV more stable dissociated ML H2O@O (Figure 8(c)). For this reason, we only consider dissociated H2O@O structures in Figure 10d.
By comparing to lower coverage H2O structures (ML30, 31, 69, 32 to 1ML30, 31, 69, 32 in Figure 7 and ML70 in Figure 9 to ML71 in Figure 8), we can disentangle the effect of interaction between the H2O molecules on the spectra. Further, these structures allow us to probe the isolated molecule limit.
As shown in Figure 10, at lower coverages the overall width of the spectra is reduced with fewer distinct peaks. When the coverage is increased to include intermolecular interactions between adjacent species, the molecular levels hybridize into bonding and antibonding intermolecular levels. This produces additional peaks above and below those present at low coverage. As a result, the peak with intermolecular bonding 3a1 character at eV for 1ML of H2O@Ti is absent for a ML coverage. This reinforces the assignment of the experimental spectra shown in Figure 1 to an intact 1ML H2O@Ti geometry with interacting molecules.
To see how the spectra for dissociation of H2O@Ti compare to H2O@O, we have considered the half-dissociated (D) and fully dissociated (D) H2O structures shown in Figure 7. As shown in Figure 10(c), the peak at eV with OH character for H2O@O splits into two peaks for dissociated H2O@Ti. The lower energy peak has both OH and OH character, while the higher energy peak is mostly OH in character. Furthermore, we find a similar couple of peaks for ML mixtures of dissociated H2O@Ti and H2O@O shown in Figure 10d. This means one may recognize dissociated H2O@Ti by both the presence of two peaks at about and eV, and the absence of the low-energy peak with 1b2 character for intact H2O@Ti.
The absence of a peak at about eV in the experimental spectra shown in Figure 2(c) reinforces its attribution to dissociated H2O@O rather than dissociated H2O@Ti. This is further supported by the calculated H2O absorption energies (Figure 10(a) and 10(b)). These are generally weaker for dissociated H2O@Ti, and stronger for H2O@O, as in previous calculations 29.
To check whether changes in the absorption geometry of H2O affect the spectra for the same coverage, we compare 1ML of H2O {I, D, D} adsorbed with either parallel () or antiparallel () interfacial hydrogen bonds 58 (black dashed lines in Figure 7). Overall, the two sets of spectra are consistent, and demonstrate the general robustness of the DOS to minor changes in the water absorption geometry. However, as the H2O molecules are no longer equivalent when the interfacial hydrogen bonds are antiparallel, there is a greater splitting between bonding and antibonding contributions for the peaks with 1b2 and 3a1 molecular character. In particular, for intact H2O, the lowest energy peak with molecular 1b2 character splits with a separate peak at eV, which is closer to the peaks at 25 (Figure 1(c)) and eV18 (Figure 1d) observed experimentally.
To see how increasing the H2O coverage impacts the spectra, we compare monolayer (ML or 1ML) to multilayer (1ML) H2O {I, D, D}72 (Figure 7), and consider the effect of additional H2O@Ti to ML (Figure 9) and ML (Figure 8) H2O@O69. In this way we can can see how robust the observed features in the individual spectra for isolated species are to screening by H2O layers6, 7, and probe the liquid water limit73.
When a second layer of H2O is added to the low coverage intact ML H2O@Ti structure, the levels with H2O 1b2 character are unchanged, while the levels with 3a1 and 1b1 second layer character are more localized and weakly hybridized with the surface. These levels are seen as the two most intense peaks at and eV (Figure 10(c)). The former coincides with the peak at eV observed experimentally at low temperatures (Figure 1(c)), suggesting multilayer H2O structures may be present under these experimental conditions. The intermolecular H bonding between the layers delocalizes the molecular levels of the first layer. This is seen from the peak at eV with antibonding 3a1 character on the first layer. We saw the same behavior when increasing the first layer’s coverage from ML to 1 ML. This is further confirmation that the peak observed experimentally at eV has intermolecular character.
When a second layer of H2O is added to the 1ML H2O@Ti {D, D} structures 72, a denser network of intermolecular and interfacial hydrogen bonds is formed, as shown in Figure 7. This causes a stronger hybridization between the OH and H2O levels. For the D structure, this results in the four distinct peaks shown in Figure 10(c). On the one hand, the peaks at and eV have predominantly intact H2O and OH character, as was the case for 1ML of D H2O@Ti. On the other hand, the peaks at and eV are most related to the second layer. In effect, the H2O level of the second-layer H2O, which is fully saturated with four hydrogen bonds, is upshifted by more than an eV.
This is not the case for the D structure (Figure 7), where the peak at eV instead has mostly intact second-layer H2O 1b2 character. As was the case for intact 1ML H2O@Ti, the addition of a second layer of H2O induces a stronger hybridization of the OH levels, and introduces an additional intense peak at eV (Figure 10(c)). This again suggests the experimentally observed peak at eV (Figure 1(c)) may be due to multilayer H2O.
Overall, we find the addition of second-layer H2O affects the resulting spectrum qualitatively. We find both additional features and a redistribution of those due to the first H2O layer. When we instead add H2O@Ti to the ML and ML H2O@O structures (Figures 9, and 8) we find the resulting spectrum is the sum of the separate spectra to within 0.2 eV (Figure 10). For example, the 1ML D spectrum (Figure 10d) for 1ML of intact H2O added to ML H2O@O (Figure 8) is basically the sum of the 1ML intact H2O@Ti (Figure 1(a)) and ML H2O@O (Figure 2(a)) PDOS spectra downshifted by 0.2 eV. This explains the ease with which the experimental single-layer H2O spectra may be analyzed for levels outside the surface DOS region.
3.5. Alignment of the Highest HO Occupied Levels
So far, we have concentrated our analysis on the lower energy peaks observed in the experimental spectra. This was done to demonstrate the robustness of the calculated QP DOS. Having established this, we now focus on the adsorbate levels near the VBM, which play an important role in photooxidation processes. In this respect, the highest HO occupied levels’ alignment for 1ML intact and dissociated H2O@Ti, and ML dissociated H2O@O is of utmost importance. The former structure corresponds to the reactant species on stoichiometric surfaces32, which undergoes photo-irradiation. The latter structures act as hole traps and are thus the main oxidizing agents on TiO2(110).74, 75
We have shown that the experimental peak at eV25 is not, in fact, the highest energy peak of H2O@Ti. We instead find the highest-energy PDOS peak, , for 1ML intact H2O@Ti at eV relative to the VBM (Figure 10(c)). This is 0.6 eV closer to the VBM than the eV estimate15 deduced from the onsets of the UPS difference spectra in Ref. 18. Moreover, as 1ML H2O@Ti dissociates, moves up to eV (D) and eV (D) (Figure 10(c)). This is again significantly higher than the eV estimate7 based on UPS difference spectra for the TiO2(100) surface from Ref. 76. As was the case for CH3OH on TiO2(110)22, this raising of can be related to the charge transfer of that accompanies deprotonation (arrows in Figure 7). We find for the 1ML intact structure on TiO2(110) is 0.2 eV closer to the VBM for H2O than for CH3OH22, 23, 24, while for the 1ML D structures is the same. However, the highest PDOS peak is both less intense and broader for H2O compared to CH3OH, due to the stronger hybridization with the surface. This is why, as discussed in Section 3.1, the QP is only eV lower compared to DFT22, 23, 24 (Figure 4). After adding second-layer H2O, is unchanged with weight mostly remaining on the first layer.
We find for ML dissociated H2O@O eV relative to the VBM (Figure 10d), the same as for intact H2O@Ti. This is much higher than the previous estimate of eV7 for OH based on the UPS difference spectra in Ref. 25. Our corrected value agrees with the recently demonstrated photocatalytic importance of OH sites as the main oxidizing species on TiO2(110). 74
Based on for 1ML intact H2O@Ti, vertical excitations from the highest H2O occupied levels to the TiO2(110) conduction band require photon energies that exceed the electronic band gap for bulk rutile TiO ( eV77) by eV. However, the hole generated by such supra-band gap excitations should be mostly located on TiO2(110) O 2pπ rather than H2O O 2p levels. This is because the H2O highest levels are hybridized with TiO2(110) and are predominantly TiO2(110) in character.
The fact that the highest H2O levels are eV below the VBM does not necessarily mean that they cannot be photooxidized by holes photogenerated within the TiO2(110) valence band. A recent DFT study with HSE06 found trapped holes at surface O sites, i.e., three-fold coordinated O, are shared with nearyby HO–Ti groups.5 Moreover, it has been suggested that H2O can only be photooxidized, i.e., trap a hole, upon deprotonation78, 79. In other words, hole transfer to the HO–Ti site should be mediated by the deprotonation of intact H2O@Ti to the nearest O site. Altogether, this suggests that H2O@Ti photooxidation should be initiated by band-to-band and supra-band photo-excitations, which result in the generation of holes within the TiO2(110) valence band. These TiO2(110) free holes may then be trapped at O sites, and partially transferred to nearby HO–Ti upon H2O deprotonation.
3.6. Vacuum Level Alignment
So far, we have considered the level alignment of the interfacial levels relative to the VBM of the substrate. This allows a direct comparison of the occupied PDOS with the measured UPS spectra. However, to assess the photoelectrocatalytic activity of the interface, one needs the absolute level alignment relative to the vacuum level .
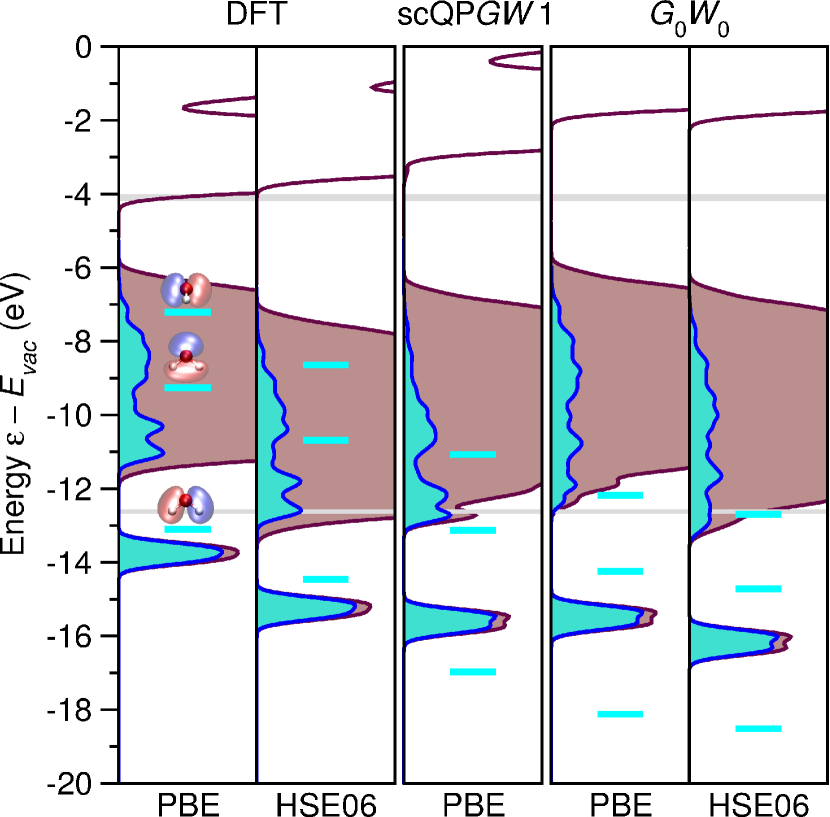
In Figure 11 we show the level alignment for gas phase H2O and 1ML intact H2O@Ti relative to from DFT, scQP1, and based on PBE and HSE xc-functionals. These are compared to the measured CBM for the liquid H2O–TiO2(110) interface40, 86, and the measured and coupled-cluster (CCSD(T)) gas phase H2O ionization potential 80.
Our calculated IP values for H2O in gas phase are consistent with those reported previously in the literature80, 87, 88, 89. Although the relative energies of the 1b1, 3a1, and 1b2 H2O levels are consistent over all five levels of theory, the levels are rigidly downshifted. We observe a clear ordering in increasing IP of PBE DFT (7.2 eV) HSE DFT PBE scQP PBE HSE PBE scQP (12.8 eV) Hartree Fock (HF 13.9 eV88).
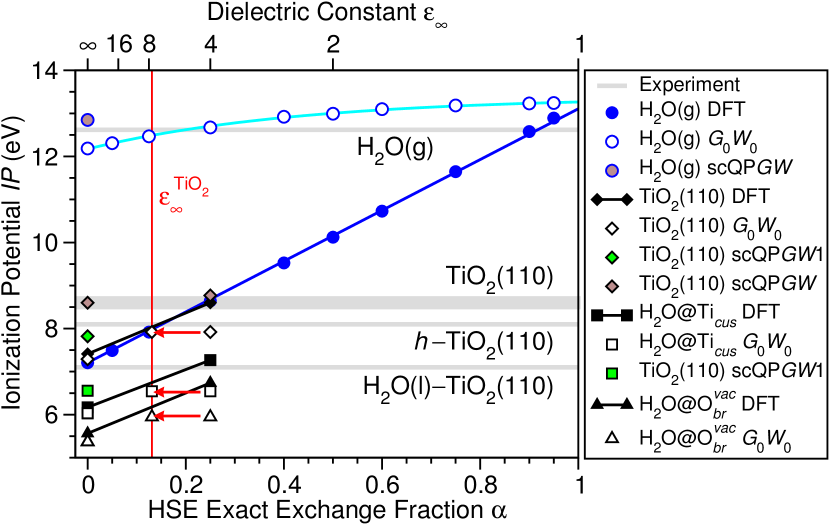
To understand the origin of this ordering, we have probed the dependence of the IP on the fraction of Hartree-Fock exact exchange included in the range-separated HSE xc-functional via the parameter in Figure 12. On the one hand, for DFT, we find a strong linear dependence of IP on , i.e., , with providing a quantitative agrement with experiment and CCD(T) calculations. Overall, this linear dependence is not surprising, as may be interpreted as the amount of electron-electron screening, i.e., the inverse dielectric constant 90, 91. In other words, the fraction of exact exchange included, determines the amount of screening, , incorporated within the xc-functional. The quantitative agreement of the IP for is because small molecules, e.g., H2O, are weakly screened in the gas phase ().
On the other hand, for , the calculated IP has a much weaker dependence on , i.e., the starting xc-functional, with . Further, the and DFT IP coincide when . For based on PBE (), the IP already agrees semi-quantitatively with experiment, with full quantitative agreement obtained for based on HSE06 (). This is because the RPA , independently of . Essentially, the calculated IPs would also be obtained from DFT using an HSE xc-functional with , i.e., . Overall, this implies is a predictive method for the IP of small molecules. However, the scQP technique has the added advantage of being completely independent of the starting xc-functional 88, 23, while providing a nearly quantitative IP.
For the H2O–TiO2(110) interface, e.g., 1ML intact H2O@Ti, the highest energy H2O PDOS peak, , is pinned eV below the VBM across PBE DFT, HSE DFT, PBE sc1, PBE , and HSE . For this reason, the IP of the H2O interfacial levels is controlled by the alignment of the VBM with respect to the vacuum. This means we only need to consider the absolute VBM level alignment of the interface, i.e., the interface’s IP = , as a descriptor of photoelectrocatalytic activity.
In Figure 11 we see that the IP of the interface follows a different ordering across the methodologies from that of gas phase H2O. In particular, we find PBE (6.0 eV) PBE DFT HSE06 PBE scQP1 HSE06 DFT (7.3 eV). Figure 12 shows that, as was the case for H2O in gas phase, the IP of the H2O@Ti interface across the various methods is ordered according to the method’s description of the screening, .
As discussed above, for hybrid xc-functionals such as HSE, the effective screening is determined by the fraction of exact exchange included. Essentially, plays the role of the effective screening within the method, . Although HSE06 incorporates less screening () than experiment for rutile TiO2 ()85, the HSE06 for the interface is in agreement with the experimental estimate of eV 40, 86.
If one performs based on HSE06, a stronger screening is applied, i.e., , yielding a lower IP for the interface. In fact, as indicated by the red arrow in Figure 12, a similar IP to HSE06 should be obtained from HSE DFT by setting the fraction of exact exchange to the inverse dielectric constant of bulk TiO2, i.e., . Adjusting to the measured inverse dielectric constant has been previously found to give improved band gaps90. From PBE scQP1, one obtains an IP consistent with that of HSE06 . This is because we find the screening in scQP decreases from PBE RPA with each self-consistent cycle. Essentially, the final screening incorporated in scQP1 is similar to that of HSE06 RPA.
As shown in Figure 11, PBE gives an IP slightly lower than PBE DFT for the interface, while the PBE CBM is shifted up by about 2 eV. This is surprising, since PBE DFT already yields a CBM level alignment for the interface in excellent agreement with experiment. This is partially due to PBE RPA’s overestimation of the screening of TiO2 (). Although HSE06 has a weaker screening than PBE , the resulting absolute alignment of the CBM is quite similar. If instead, the self energy corrections are applied self-consistently via PBE scQP1, the absolute alignment of the CBM is significantly lower, but still greater than that of PBE DFT or HSE06 DFT. This is again related to decreases in the dielectric constant with each self-consistent cycle. For this reason, scQP1 tends to provide reasonable band gaps for TiO2(110) interfaces. Overall, we observe an ordering in increasing band gap of PBE DFT HSE06 DFT PBE scQP PBE HSE06 , with HSE06 DFT providing the best absolute alignment of the CBM and VBM for the H2O@Ti interface.
In Figure 12, we show that a similar correlation between IP and the method’s description of screening holds for clean and hydroxylated TiO2(110). Specifically, we consider clean stoichiometric TiO2(110) 23, and dissociated H2O@O on defective TiO(110) with ML of O. Overall, for all systems considered. We again find that the IP of PBE PBE DFT, HSE06 HSE() PBE , and PBE scQP HSE06 scQP HSE06 DFT.
HSE06 DFT provides the most accurate description of the IP of the clean and H2O@Ti covered stoichiometric TiO2(110) surfaces. Although the HSE06 DFT IP for H2O@O is significantly lower than the one measured for TiO2(110), in both cases, the IP is shifted to lower energies relative to the clean stoichiometric surface. Differences in the magnitude of the shifts are probably due to the differences in defect coverage between the experiment (6–9%)83 and the calculation (50%).
The similarty between HSE06 DFT and scQP based on either PBE or HSE06 for the clean TiO2(110) surface23, points to a similar screening from these two techniques. This also demonstrates the starting point independence of the scQP technique.
To summarize, although scQP provides accurate IPs, the band gap is greatly overestimated, as reported previously 22, 23, 41, 92. While scQP provides a more accurate band gap, it achieves only a qualitative description of the IP. HSE06 achieves a quantitative description of both the IP and band gap, but provides a poor description of the molecular level alignment relative to the VBM.22, 23, 92 However, since the highest occupied H2O levels are significantly hybridized with the substrate, this is not a major drawback in this case. In general, for TiO2(110), a more effective strategy is to combine the calculated IP from HSE06 with the occupied interfacial levels’ alignment from or scQP.
4. CONCLUSIONS
The level alignment prior to photo-irradiation is an important piece of the puzzle needed to get a complete atomistic picture of photocatalytic processes. Here we have shown that the complex UPS spectra for the H2O–TiO2 interface may be disentangled using QP PDOS. We have firmly established the robustness of the QP H2O PDOS by: (1) demonstrating its xc-functional (PBE, LDA, vdW-DF, and HSE06) independence, (2) comparing to self-consistent QP techniques (scQP), and (3) considering its dependence on surface coverage and dissociation. Altogether, these calculations provide an accurate interpretation of the complex UPS and MIES experiments18, 26, 25 for the H2O–TiO2(110) interface, and provide accurate estimates of the highest H2O occupied levels’ alignment relative to the VBM.
Our results provide two important pieces of the puzzle: (1) the molecular structure of the photocatalytic interface and (2) the molecular alignment of the doubly occupied levels near the VBM responsible for hole trapping prior to irradiation. To complete the picture, the molecular structure and level alignment in the presence of the photo-generated hole is also needed. Previous DFT studies using the hybrid HSE xc-functional have found a hole can be trapped at surface O 2pπ levels of O and HO–Ti sites 5. However, the screening of such localized levels may not be well described by HSE, which tends to underbind localized interfacial levels 23. This underbinding is corrected upon inclusion of many-body effects via QP 23. Having demonstrated the capability of for the description of level alignment prior to irradiation, this work points the way forward via future QP studies of level alignment for trapped hole levels.
ASSOCIATED CONTENT
![[Uncaptioned image]](/html/1501.03533/assets/x14.png) Supporting Information
Supporting Information
Total energies and optimized geometries. This material is available free of charge via the Internet at http://pubs.acs.org.
AUTHOR INFORMATION
Corresponding Author
E-mail: annapaola.migani@cin2.es (A.M.)
Notes
The authors declare no competing financial interest.
ACKNOWLEDGMENTS
We ackowledge fruitful discussions with Angel Rubio, and we thank Stefan Krischok for providing experimental data. We acknowledge funding from Spanish Grants (FIS2012-37549-C05-02, RYC-2011-09582, JCI-2010-08156); Generalitat de Catalunya (2014SGR301, XRQTC); Grupos Consolidados UPV/EHU del Gobierno Vasco (IT-578-13); NSFC (21003113 and 21121003); MOST (2011CB921404); and NSF Grant CHE-1213189; and computational time from BSC Red Espanola de Supercomputacion and EMSL at PNNL by the DOE.
REFERENCES
- Thompson and Yates 2006 Thompson, T. L.; Yates, J. T. J. Surface Science Studies of the Photoactiavation of TiO2—New Photochemical Processes. Chem. Rev. 2006, 106, 4428–4453
- Henderson 2011 Henderson, M. A. A surface science perspective on TiO2 photocatalysis. Surf. Sci. Rep. 2011, 66, 185–297
- Tan et al. 2012 Tan, S.; Feng, H.; Ji, Y.; Wang, Y.; Zhao, J.; Zhao, A.; Wang, B.; Luo, Y.; Yang, J.; Hou, J. G. Observation of Photocatalytic Dissociation of Water on Terminal Ti Sites of TiO2(110)- Surface. J. Am. Chem. Soc. 2012, 134, 9978–9985
- Cheng et al. 2012 Cheng, J.; Sulpizi, M.; VandeVondele, J.; Sprik, M. Hole Localization and Thermochemistry of Oxidative Dehydrogenation of Aqueous Rutile TiO2(110). ChemCatChem 2012, 4, 636–640
- Cheng et al. 2014 Cheng, J.; VandeVondele, J.; Sprik, M. Identifying Trapped Electronic Holes at the Aqueous TiO2 Interface. J. Phys. Chem. C 2014, 118, 5437–5444
- Nakamura and Nakato 2004 Nakamura, R.; Nakato, Y. Primary Intermediates of Oxygen Photoevolution Reaction on TiO2 (Rutile) Particles, Revealed by in Situ FTIR Absorption and Photoluminescence Measurements. J. Am. Chem. Soc. 2004, 126, 1290–1298
- Imanishi et al. 2007 Imanishi, A.; Okamura, T.; Ohashi, N.; Nakamura, R.; Nakato, Y. Mechanism of Water Photooxidation Reaction at Atomically Flat TiO2 (Rutile) (110) and (100) Surfaces: Dependence on Solution pH. J. Am. Chem. Soc. 2007, 129, 11569–11578
- Waegele et al. 2014 Waegele, M. M.; Chen, X.; Herlihy, D. M.; Cuk, T. How Surface Potential Determines the Kinetics of the First Hole Transfer of Photocatalytic Water Oxidation. J. Am. Chem. Soc. 2014, 136, 10632–10639
- Cheng et al. 2014 Cheng, J.; Liu, X.; Kattirtzi, J. A.; VandeVondele, J.; Sprik, M. Aligning Electronic and Protonic Energy Levels of Proton-Coupled Electron Transfer in Water Oxidation on Aqueous TiO2. Angew. Chem. Int. Ed. 2014, n/a–n/a
- Tritsaris et al. 2014 Tritsaris, G. A.; Vinichenko, D.; Kolesov, G.; Friend, C. M.; Kaxiras, E. Dynamics of the Photogenerated Hole at the Rutile (110)/Water Interface: A Nonadiabatic Simulation Study. J. Phys. Chem. C 2014, In press (DOI: http://dx.doi.org/10.1021/jp508557w)
- Whitesides and Crabtree 2007 Whitesides, G. M.; Crabtree, G. W. Don’t Forget Long-Term Fundamental Research in Energy. Science 2007, 315, 796–798
- Hemminger et al. 2008 Hemminger, J., Crabtree, G., Kastner, M., Eds. The Energy Challenges Report: New Science for a Secure and Sustainable Energy Future; Argonne National Laboratory: Argonne, Illinois, 2008
- Fujishima and Honda 1972 Fujishima, A.; Honda, K. Electrochemical Photolysis of Water at a Semiconductor Electrode. Nature 1972, 238, 37–38
- Fujishima et al. 2008 Fujishima, A.; Zhang, X.; Tryk, D. A. TiO2 photocatalysis and related surface phenomena. Surf. Sci. Rep. 2008, 63, 515–582
- Salvador 2007 Salvador, P. On the Nature of Photogenerated Radical Species Active in the Oxidative Degradation of Dissolved Pollutants with TiO2 Aqueous Suspensions: A Revision in the Light of the Electronic Structure of Adsorbed Water. J. Phys. Chem. C 2007, 111, 17038–17043
- Salvador 2011 Salvador, P. Mechanisms of water photooxidation at -TiO2 rutile single crystal oriented electrodes under UV illumination in competition with photocorrosion. Prog. Surf. Sci. 2011, 86, 41–58
- Pre 2013 Theoretical Insights into Photoinduced Charge Transfer and Catalysis at Oxide Interfaces. Chem. Rev. 2013, 113, 4496–4565
- Kurtz et al. 1989 Kurtz, R. L.; Stock-Bauer, R.; Madey, T. E.; Román, E.; Segovia, J. L. D. Synchrotron radiation studies of H2O adsorption on TiO2(110). Surf. Sci. 1989, 218, 178–200
- Neaton et al. 2006 Neaton, J. B.; Hybertsen, M. S.; Louie, S. G. Renormalization of Molecular Electronic Levels at Metal-Molecule Interfaces. Phys. Rev. Lett. 2006, 97, 216405
- Garcia-Lastra et al. 2009 Garcia-Lastra, J. M.; Rostgaard, C.; Rubio, A.; Thygesen, K. S. Polarization-induced renormalization of molecular levels at metallic and semiconducting surfaces. Phys. Rev. B 2009, 80, 245427
- Patrick and Giustino 2012 Patrick, C. E.; Giustino, F. Quantitative Analysis of Valence Photoemission Spectra and Quasiparticle Excitations at Chromophore-Semiconductor Interfaces. Phys. Rev. Lett. 2012, 109, 116801
- Migani et al. 2013 Migani, A.; Mowbray, D. J.; Iacomino, A.; Zhao, J.; Petek, H.; Rubio, A. Level Alignment of a Prototypical Photocatalytic System: Methanol on TiO2(110). J. Am. Chem. Soc. 2013, 135, 11429–11432
- Migani et al. 2014 Migani, A.; Mowbray, D. J.; Zhao, J.; Petek, H.; Rubio, A. Quasiparticle level alignment for photocatalytic interfaces. J. Chem. Theor. Comp. 2014, 10, 2103–2114
- Migani and Mowbray 2014 Migani, A.; Mowbray, D. J. Coverage dependence of the level alignment for methanol on TiO2(110). Comp. Theor. Chem. 2014, 1040–1041, 259–265
- Brookes et al. 2001 Brookes, I. M.; Muryn, C. A.; Thornton, G. Imaging Water Dissociation on . Phys. Rev. Lett. 2001, 87, 266103
- Krischok et al. 2001 Krischok, S.; Höfft, O.; Günster, J.; Stultz, J.; Goodman, D.; Kempter, V. H2O interaction with bare and Li-precovered TiO2: studies with electron spectroscopies (MIES and UPS(HeI and II)). Surf. Sci. 2001, 495, 8–18
- Henderson 1996 Henderson, M. A. An HREELS and TPD study of water on TiO2(110): the extent of molecular versus dissociative adsorption. Surf. Sci. 1996, 355, 151–166
- Lindan et al. 1998 Lindan, P. J. D.; Harrison, N. M.; Gillan, M. J. Mixed Dissociative and Molecular Adsorption of Water on the Rutile (110) Surface. Phys. Rev. Lett. 1998, 80, 762–765
- Schaub et al. 2001 Schaub, R.; Thostrup, P.; Lopez, N.; Lægsgaard, E.; Stensgaard, I.; Nørskov, J. K.; Besenbacher, F. Oxygen Vacancies as Active Sites for Water Dissociation on Rutile . Phys. Rev. Lett. 2001, 87, 266104
- Harris and Quong 2004 Harris, L. A.; Quong, A. A. Molecular Chemisorption as the Theoretically Preferred Pathway for Water Adsorption on Ideal Rutile . Phys. Rev. Lett. 2004, 93, 086105
- Lindan and Zhang 2005 Lindan, P. J. D.; Zhang, C. Exothermic water dissociation on the rutile surface. Phys. Rev. B 2005, 72, 075439
- Liu et al. 2010 Liu, L.-M.; Zhang, C.; Thornton, G.; Michaelides, A. Structure and dynamics of liquid water on rutile . Phys. Rev. B 2010, 82, 161415
- Amft et al. 2013 Amft, M.; Walle, L. E.; Ragazzon, D.; Borg, A.; Uvdal, P.; Skorodumova, N. V.; Sandell, A. A Molecular Mechanism for the Water–Hydroxyl Balance during Wetting of TiO2. J. Phys. Chem. C 2013, 117, 17078–17083
- Walle et al. 2014 Walle, L. E.; Ragazzon, D.; Borg, A.; Uvdal, P.; Sandell, A. Photoemission studies of water dissociation on rutile TiO2: Aspects on experimental procedures and the influence of steps. Appl. Surf. Sci. 2014, 303, 245 – 249
- Walle et al. 2014 Walle, L.; Ragazzon, D.; Borg, A.; Uvdal, P.; Sandell, A. Competing water dissociation channels on rutile TiO2(110). Surf. Sci. 2014, 621, 77 – 81
- Du et al. 2009 Du, Y.; Deskins, N. A.; Zhang, Z.; Dohnálek, Z.; Dupuis, M.; Lyubinetsky, I. Two Pathways for Water Interaction with Oxygen Adatoms on . Phys. Rev. Lett. 2009, 102, 096102
- Turner et al. 1970 Turner, D. W.; Baker, C.; Baker, A. D.; Brundle, C. R. Molecular Photoelectron Spectroscopy; Wiley-Interscience: New York, 1970; p 113
- Connor et al. 1977 Connor, J.; Considine, M.; Hillier, I.; Briggs, D. Low energy photoelectron spectroscopy of solids. Aspects of experimental methodology concerning metals and insulators. J. Electron Spectrosc. Relat. Phenom. 1977, 12, 143–159
- Cheng and Sprik 2012 Cheng, J.; Sprik, M. Alignment of electronic energy levels at electrochemical interfaces. Phys. Chem. Chem. Phys. 2012, 14, 11245–11267
- Cheng and Sprik 2010 Cheng, J.; Sprik, M. Aligning electronic energy levels at the TiOH2O interface. Phys. Rev. B 2010, 82, 081406
- Shishkin et al. 2007 Shishkin, M.; Marsman, M.; Kresse, G. Accurate Quasiparticle Spectra from Self-Consistent GW Calculations with Vertex Corrections. Phys. Rev. Lett. 2007, 99, 246403
- van Schilfgaarde et al. 2006 van Schilfgaarde, M.; Kotani, T.; Faleev, S. Quasiparticle Self-Consistent Theory. Phys. Rev. Lett. 2006, 96, 226402
- Kotani et al. 2007 Kotani, T.; van Schilfgaarde, M.; Faleev, S. V.; Chantis, A. Quasiparticle self-consistent GW method: a short summary. J. Phys.: Condens. Matter 2007, 19, 365236
- Hedin 1965 Hedin, L. New Method for Calculating the One-Particle Green’s Function with Application to the Electron-Gas Problem. Phys. Rev. 1965, 139, A796–A823
- Onida et al. 2002 Onida, G.; Reining, L.; Rubio, A. Electronic excitations: density-functional versus many-body Green’s-function approaches. Rev. Mod. Phys. 2002, 74, 601–659
- Shishkin and Kresse 2006 Shishkin, M.; Kresse, G. Implementation and performance of the frequency-dependent method within the PAW framework. Phys. Rev. B 2006, 74, 035101
- Kresse and Joubert 1999 Kresse, G.; Joubert, D. From ultrasoft pseudopotentials to the projector augmented-wave method. Phys. Rev. B 1999, 59, 1758
- Perdew et al. 1996 Perdew, J. P.; Burke, K.; Ernzerhof, M. Generalized Gradient Approximation Made Simple. Phys. Rev. Lett. 1996, 77, 3865
- Kresse and Furthmüller 1996 Kresse, G.; Furthmüller, J. Efficient iterative schemes for ab initio total-energy calculations using a plane-wave basis set. Phys. Rev. B 1996, 54, 11169
- Perdew and Zunger 1981 Perdew, J. P.; Zunger, A. Self-interaction correction to density-functional approximations for many-electron systems. Phys. Rev. B 1981, 23, 5048–5079
- Dion et al. 2004 Dion, M.; Rydberg, H.; Schröder, E.; Langreth, D. C.; Lundqvist, B. I. Van der Waals Density Functional for General Geometries. Phys. Rev. Lett. 2004, 92, 246401
- Heyd et al. 2003 Heyd, J.; Scuseria, G. E.; Ernzerhof, M. Hybrid functionals based on a screened Coulomb potential. J. Chem. Phys. 2003, 118, 8207
- Krukau et al. 2006 Krukau, A. V.; Vydrov, O. A.; Izmaylov, A. F.; Scuseria, G. E. Influence of the exchange screening parameter on the performance of screened hybrid functionals. J. Chem. Phys. 2006, 125, 224106
- Burdett et al. 1987 Burdett, J. K.; Hughbanks, T.; Miller, G. J.; Richardson, J. W.; Smith, J. V. Structural-electronic relationships in inorganic solids: powder neutron diffraction studies of the rutile and anatase polymorphs of titanium dioxide at 15 and 295 K. J. Am. Chem. Soc. 1987, 109, 3639–3646
- Despoja et al. 2013 Despoja, V.; Lončarić, I.; Mowbray, D. J.; Marušić, L. Quasiparticle spectra and excitons of organic molecules deposited on substrates: -BSE approach applied to benzene on graphene and metallic substrates. Phys. Rev. B 2013, 88, 235437
- Despoja and Mowbray 2014 Despoja, V.; Mowbray, D. J. Using surface plasmonics to turn on fullerene’s dark excitons. Phys. Rev. B 2014, 89, 195433
- Hammer et al. 1999 Hammer, B.; Hansen, L. B.; Nørskov, J. K. Improved Adsorption Energetics within Density-Functional Theory Using Revised Perdew-Burke-Ernzerhof Functionals. Phys. Rev. B 1999, 59, 7413–7421
- Lee et al. 2013 Lee, J.; Sorescu, D. C.; Deng, X.; Jordan, K. D. Water Chain Formation on TiO2(110). J. Phys. Chem. Lett. 2013, 4, 53–57
- Kimmel et al. 2012 Kimmel, G. A.; Baer, M.; Petrik, N. G.; VandeVondele, J.; Rousseau, R.; Mundy, C. J. Polarization- and Azimuth-Resolved Infrared Spectroscopy of Water on TiO2(110): Anisotropy and the Hydrogen-Bonding Network. J. Phys. Chem. Lett. 2012, 3, 778–784
- Shapovalov et al. 2003 Shapovalov, V.; Wang, Y.; Truong, T. N. Theoretical analysis of the electronic spectra of water adsorbed on the rutile TiO2 (110) and MgO (100) surfaces. Chemical Physics Letters 2003, 375, 321–327
- Mowbray et al. 2011 Mowbray, D. J.; Martínez, J. I.; Calle-Vallejo, F.; Rossmeisl, J.; Thygesen, K. S.; Jacobsen, K. W.; Nørskov, J. K. Trends in Metal Oxide Stability for Nanorods, Nanotubes, and Surfaces. J. Phys. Chem. C 2011, 115, 2244–2252
- Lun Pang et al. 2008 Lun Pang, C.; Lindsay, R.; Thornton, G. Chemical reactions on rutile TiO2(110). Chem. Soc. Rev. 2008, 37, 2328–2353
- Minato et al. 2009 Minato, T.; Sainoo, Y.; Kim, Y.; Kato, H. S.; Aika, K.-i.; Kawai, M.; Zhao, J.; Petek, H.; Huang, T.; He, W. et al. The electronic structure of oxygen atom vacancy and hydroxyl impurity defects on titanium dioxide (110) surface. J. Chem. Phys. 2009, 130, 124502
- Di Valentin et al. 2006 Di Valentin, C.; Pacchioni, G.; Selloni, A. Electronic Structure of Defect States in Hydroxylated and Reduced Rutile Surfaces. Phys. Rev. Lett. 2006, 97, 166803
- Allegretti et al. 2005 Allegretti, F.; O’Brien, S.; Polcik, M.; Sayago, D. I.; Woodruff, D. P. Adsorption Bond Length for on : A Key Parameter for Theoretical Understanding. Phys. Rev. Lett. 2005, 95, 226104
- Allegretti et al. 2006 Allegretti, F.; O’Brien, S.; Polcik, M.; Sayago, D.; Woodruff, D. Quantitative determination of the local structure of H2O on TiO2(100) using scanned-energy mode photoelectron diffraction. Surface Science 2006, 600, 1487–1496
- Papageorgiou et al. 2010 Papageorgiou, A. C.; Beglitis, N. S.; Pang, C. L.; Teobaldi, G.; Cabailh, G.; Chen, Q.; Fisher, A. J.; Hofer, W. A.; Thornton, G. Electron traps and their effect on the surface chemistry of TiO2(110). Proc. Natl. Acad. Sci. 2010, 107, 2391–2396
- Sun et al. 2010 Sun, C.; Liu, L.-M.; Selloni, A.; Lu, G. Q. M.; Smith, S. C. Titania-water interactions: a review of theoretical studies. J. Mater. Chem. 2010, 20, 10319–10334
- Zhao et al. 2006 Zhao, J.; Li, B.; Jordan, K. D.; Yang, J.; Petek, H. Interplay between hydrogen bonding and electron solvation on hydrated . Phys. Rev. B 2006, 73, 195309
- Wu et al. 2014 Wu, Z.; Zhang, W.; Xiong, F.; Yuan, Q.; Jin, Y.; Yang, J.; Huang, W. Active hydrogen species on TiO2 for photocatalytic H2 production. Phys. Chem. Chem. Phys. 2014, 16, 7051–7057
- Kowalski et al. 2009 Kowalski, P. M.; Meyer, B.; Marx, D. Composition, structure, and stability of the rutile surface: Oxygen depletion, hydroxylation, hydrogen migration, and water adsorption. Phys. Rev. B 2009, 79, 115410
- Zhang and Lindan 2003 Zhang, C.; Lindan, P. J. D. Multilayer water adsorption on rutile TiO2(110): A first-principles study. J. Chem. Phys. 2003, 118, 4620–4630
- Garbuio et al. 2009 Garbuio, V.; Cascella, M.; Pulci, O. Excited state properties of liquid water. J. Phys.: Condens. Matter 2009, 21, 033101
- Montoya et al. 2013 Montoya, J. F.; Ivanova, I.; Dillert, R.; Bahnemann, D. W.; Salvador, P.; Peral, J. Catalytic Role of Surface Oxygens in TiO2 Photooxidation Reactions: Aqueous Benzene Photooxidation with Ti18O2 under Anaerobic Conditions. J. Phys. Chem. Lett. 2013, 4, 1415–1422
- Hoffmann et al. 1995 Hoffmann, M. R.; Martin, S. T.; Choi, W.; Bahnemann, D. W. Environmental Applications of Semiconductor Photocatalysis. Chem. Rev. 1995, 95, 69–96
- Muryn et al. 1991 Muryn, C.; Hardman, P.; Crouch, J.; Raiker, G.; Thornton, G.; Law, D. Step and point defect effects on TiO2(100) reactivity. Surface Science 1991, 251–252, 747 – 752
- Tezuka et al. 1994 Tezuka, Y.; Shin, S.; Ishii, T.; Ejima, T.; Suzuki, S.; Sato, S. Photoemission and Bremsstrahlung Isochromat Spectroscopy Studies of TiO2 (Rutile) and SrTiO3. J. Phys. Soc. Jpn. 1994, 63, 347–357
- Valentin and Fittipaldi 2013 Valentin, C. D.; Fittipaldi, D. Hole Scavenging by Organic Adsrobates on the TiO2 Surface: A DFT Model Study. J. Phys. Chem. Lett. 2013, 4, 1901–1906
- Chen et al. 2013 Chen, J.; Li, Y.-F.; Sit, P.; Selloni, A. Chemical Dynamics of the First Proton-Coupled Electron Transfer of Water Oxidation on TiO2 Anatase. J. Am. Chem. Soc. 2013, 135, 18774–18777
- Bruneval and Marques 2013 Bruneval, F.; Marques, M. A. L. Benchmarking the Starting Points of the Approximation for Molecules. J. Chem. Theor. Comp. 2013, 9, 324–329
- Chung et al. 1977 Chung, Y. W.; Lo, W. J.; Somorjai, G. A. Low energy electron diffraction and electron spectroscopy studies of the clean (110) and (100) titanium dioxide (rutile) crystal surfaces. Surf. Sci. 1977, 64, 588
- Onishi et al. 1988 Onishi, H.; Aruga, T.; Egawa, C.; Iwasawa, Y. Adsorption of CH3OH, HCOOH and SO2 on TiO2(110) and stepped TiO2(441) surfaces. Surf. Sci. 1988, 193, 33–46
- Borodin and Reichling 2011 Borodin, A.; Reichling, M. Characterizing TiO2(110) surface states by their work function. Phys. Chem. Chem. Phys. 2011, 13, 15442–15447
- Onda et al. 2004 Onda, K.; Li, B.; Petek, H. Two-photon photoemission spectroscopy of surfaces modified by defects and or adsorbates. Phys. Rev. B 2004, 70, 045415
- Traylor et al. 1971 Traylor, J. G.; Smith, H. G.; Nicklow, R. M.; Wilkinson, M. K. Lattice Dynamics of Rutile. Phys. Rev. B 1971, 3, 3457–3472
- Gra 2001 Photoelectrochemical cells. Nature 2001, 414, 338–344
- Rostgaard et al. 2010 Rostgaard, C.; Jacobsen, K. W.; Thygesen, K. S. Fully self-consistent calculations for molecules. Phys. Rev. B 2010, 81, 085103
- Caruso et al. 2012 Caruso, F.; Rinke, P.; Ren, X.; Scheffler, M.; Rubio, A. Unified description of ground and excited states of finite systems: The self-consistent approach. Phys. Rev. B 2012, 86, 081102
- van Setten et al. 2013 van Setten, M. J.; Weigend, F.; Evers, F. The -Method for Quantum Chemistry Applications: Theory and Implementation. J. Chem. Theor. Comp. 2013, 9, 232–246
- Marques et al. 2011 Marques, M. A. L.; Vidal, J.; Oliveira, M. J. T.; Reining, L.; Botti, S. Density-based mixing parameter for hybrid functionals. Phys. Rev. B 2011, 83, 035119
- Skone et al. 2014 Skone, J. H.; Govoni, M.; Galli, G. Self-consistent hybrid functional for condensed systems. Phys. Rev. B 2014, 89, 195112
- Pacchioni 2014 Pacchioni, G. First Principles Calculations on Oxide-Based Heterogeneous Catalysts and Photocatalysts: Problems and Advances. Catal. Lett. 2014, 1–15