Power-efficient production of photon pairs in a tapered chalcogenide microwire
Abstract
Using tapered fibers of As2Se3 chalcogenide glass, we produce photon pairs at telecommunication wavelengths with low pump powers. We found maximum coincidences-to-accidentals ratios of for degenerate pumping with average power, and for non-degenerate pumping with and average power of the two pumps. Our results show that the ultrahigh nonlinearity in these microwires could allow single-photon pumping to produce photon pairs, enabling the production of large entangled states, heralding of single photons after lossy transmission, and photonic quantum information processing with nonlinear optics.
Photon pair sources are the simplest and most abundant devices used to produce quantum entanglement Horodecki et al. (2009), and are normally based on nonlinear optical effects that require large input light intensities. With highly efficient photon sources, it becomes possible to use spontaneous parametric down-conversion (SPDC) or four-wave mixing (FWM) acting on single photons as pumps in later stages of quantum information experiments Guerreiro et al. (2014); Hamel et al. (2014), enabling advanced protocols like loophole-free Bell tests via photon heralding Cabello and Sciarrino (2012) and photonic quantum computing Langford et al. (2011).
However, the conversion efficiency of one pump photon into a pair through SPDC in media has not substantially increased Tanzilli et al. (2001); Zhang et al. (2007) beyond . Focus has shifted to developing efficient FWM in fibers and waveguides, using materials with large nonlinearities such as silicon Takesue (2012) and chalcogenide glasses Xiong et al. (2010, 2011), and also using resonator-enhanced processes Chen et al. (2011); Reimer et al. (2014), atomic vapors Chiu et al. (2014), and microstructured silica fibers Langford et al. (2011). These would allow non-degenerate pumping with a single photon and strong pump to produce pairs.
Unfortunately, none of these sources is totally suitable for converting single photons to pairs, and it remains a challenge to design the device that offers the highest efficiency with convenient operation and low noise. Silica devices cannot reach sufficiently high efficiency due to low nonlinearity Foster et al. (2008), and though silicon exhibits much lower noise Harada et al. (2010), it suffers from two-photon and free-carrier absorption Eggleton, Luther-Davies, and Richardson (2011), limiting the maximum useable pump power. Enhancing the nonlinearity through resonators or using atomic vapors requires the input photon to be narrowband, limiting the types of initial sources for this photon.
Here we demonstrate production of photon pairs in tapered As2Se3 microwires, capable in principle of converting a broadband single photon into a pair with probability Dot et al. (2014). First we characterize the four-wave mixing properties of the microwires, then we produce photon pairs from degenerate pumping, and finally produce pairs from low-power non-degenerate pumps, as would be required for a single-photon-pumping experiment.
Our microwires combine a high nonlinear coefficient Slusher et al. (2004) ( ) with low cross-sectional area () to produce a large waveguide nonlinear parameter ( ), times larger than standard silica fibers, and ten times larger than As2S3 chalcogenide waveguides Xiong et al. (2011). Furthermore, in contrast to on-chip waveguides, microwires are drop-in compatible with existing single-mode silica fiber, are made with lengths up to tens of centimeters, and demonstrate low loss. Coupling to the microwire is accomplished by gluing standard single-mode fiber (SMF) to the chalcogenide step-index fibers on either side of the tapered region. A coating of poly(methyl methacrylate) (PMMA) increases the mechanical robustness and influences the phasematching properties of the microwires. Broadband phasematching of up to bandwidth at telecommunication wavelengths has been shown using classical four-wave mixing Ahmad and Rochette (2012).
The tapered fiber used in this work has a long microwire with a diameter of , with total insertion loss including pigtails of . We estimate the breakdown of the losses as follows: inside the microwire, due to sidewall roughness, absorption of the evanescent field by the polymer coating, and mode conversion in the tapering sections; at the SMF-chalcogenide interfaces, per interface due to Fresnel reflection, and per interface due to mode mismatch because the glued pigtails have been disrupted by transport. Losses per SMF-chalcogenide interface as low as 0.66 dB have been reported Baker and Rochette (2012).
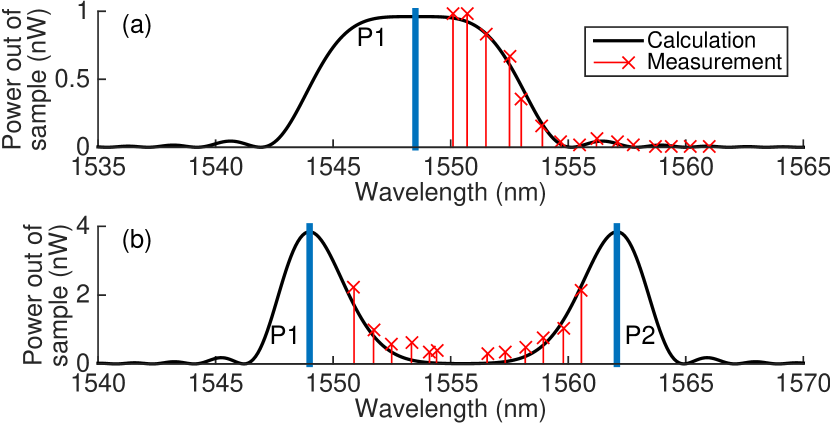
Figure 1 shows the phasematching profile of our microwire at , far from any zero dispersion wavelength, for a degenerate pump (a) and for two non-degenerate pumps apart (b). These data were obtained by pumping and seeding with continuous-wave lasers with coupled power (inferred power inside the microwire after accounting for coupling losses) each. For the degenerate case, the seed laser was scanned to the shorter wavelength side of the pump, and for the non-degenerate case, the seed was scanned between the two pump wavelengths, leaving a gap in the middle where the seed and signal cross over. In both cases the output signal was filtered through a dense-wave division multiplexer (DWDM) and measured on a power meter. The values reported here have the DWDM losses factored out.
We calculated the expected phasematching and power outputs from a standard four-wave mixing treatment Agrawal (2013), with the length, diameter, insertion loss, and nonlinear parameter as mentioned above, and calculated loss in the microwire Baker and Rochette (2010) of . In order to find the propagation constant and effective refractive index inside the microwire, we solved the characteristic equation for a step-index fiber with As2Se3 core Slusher et al. (2004) and PMMA cladding Kasarova et al. (2007). Even without fitting parameters, the phasematching calculations in Fig. 1 agree with the measured data.
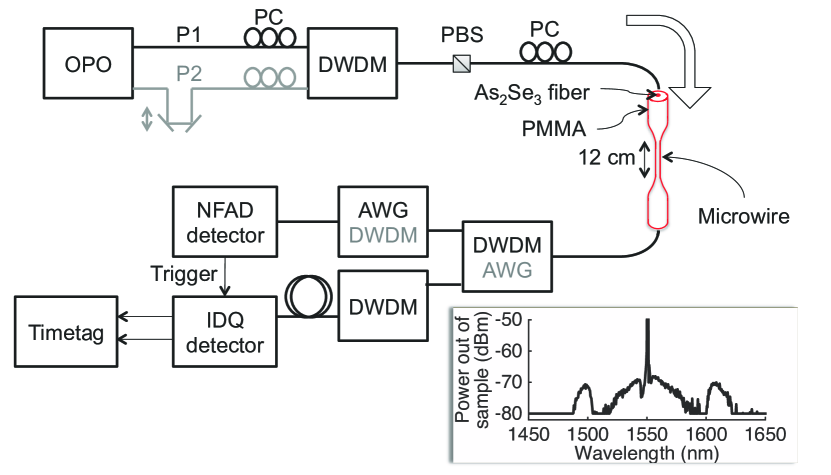
Next we produced photon pairs using a degenerate pump, with the setup shown in Fig. 2. The output of an optical parametric oscillator at with pulse length and repetition rate was filtered through a DWDM and sent through the tapered chalcogenide microwire. The FWM output signal and idler photons were split into the and channels of a DWDM, and subsequently filtered in an AWG and DWDM respectively, giving total pump isolation of and . The signal photon was detected with a free-running InGaAs negative-feedback avalanche photodiode (NFAD) with detection efficiency and dark counts per second Yan et al. (2012), which gated an id201 InGaAs single photon detector from IDQ for the idler photon, with gate width and efficiency. The gate out and detector channels from the id201 were recorded in a time-tagger to either produce timing histograms between signal and idler, or to filter with a timing window to record coincident counts.
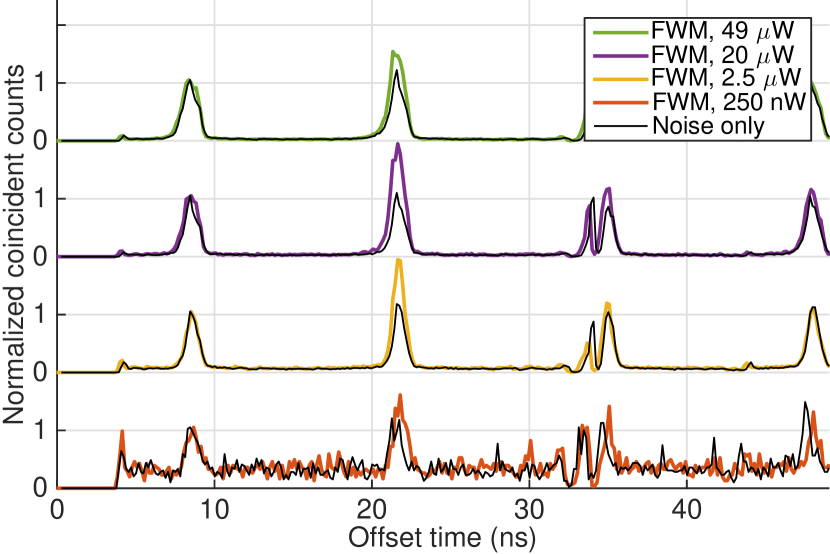
The timing histograms in Fig. 3 show the presence of photon pairs, as evidenced by a higher peak at the time delay of than the background peaks at other time delays. At the lowest power, detector dark counts at random times become prominent, while at the highest power, accidental coincidences from multiple photon pairs make a large contribution to the noise. When the idler channel is moved to (black lines in Fig. 3) such that photon pairs detected would not conserve energy and could not be from four-wave mixing, the peak at falls to the same height as the others.
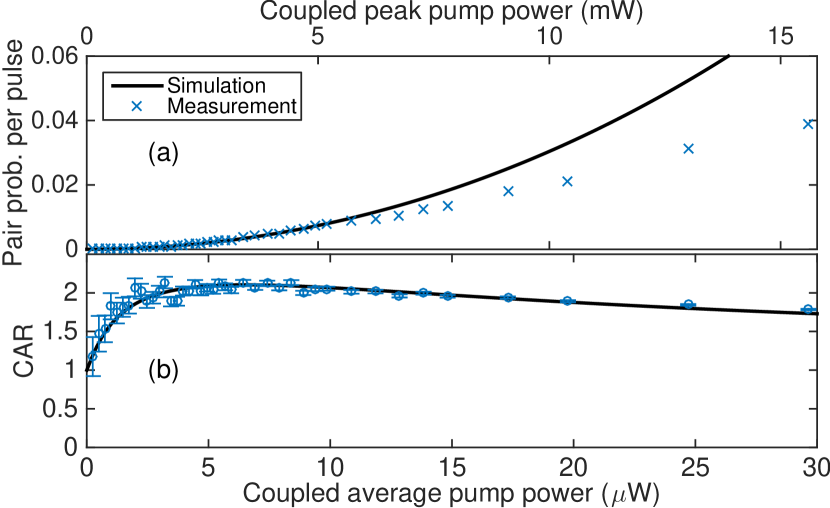
As seen in Fig. 4(a), the number of pairs per pulse increases quadratically with pump power, with dropoff seen at high count rates due to the dead time of the NFAD detector. To compare with previous photon pair sources, we calculate the number of pairs produced per second, per nanometer of signal bandwidth, per milliwatt of average pump power as for the data point with pump power. This is significantly above what is possible in crystals Steinlechner et al. (2013), and rivals the highest values reported in silicon Engin et al. (2013). Note that our filters had bandwidth, and milliwatt pump powers are too large to avoid damage to the microwire.
In Fig. 4(b), the coincidences-to-accidentals ratio reaches its maximum value of at a coupled pump power of . This ratio is defined as , where is the total number of coincident counts in the main coincidence peak and is the number of accidental coincidences, and has a lower bound of for no timing correlation. At a coupled pump power of , the CAR was , and statistical significance increased with increasing pump power. Here the coincidences are collected at the offset time of Fig. 3, while the accidentals, which are due to detector dark counts, double-pair emissions from FWM, and Raman and other optical noise, are collected at , which allows an estimation of the contribution of accidentals to the main coincidence peak. At low power, the CAR decreases due to the small number of real photon pairs compared to noise photons, and at high power, the CAR slowly decreases due to double-pair emissions from four-wave mixing. The fits to pair probability and CAR come from the FWM calculation described above, which feeds into a quantum-optical simulation including FWM, loss, detector models, and background counts measured with a continuous-wave pump. Here the pump pulse length inside the microwire is used as a fitting parameter and found to be .
In order to approach the regime of converting a single photon into a pair, the two pump photons absorbed in the FWM process must be non-degenerate in wavelength. Since FWM probability goes as the product of the pump peak powers, it is important that both pumps be synchronously pulsed, rather than continuous-wave. To demonstrate non-degenerate pumping, we took two outputs from an optical parametric oscillator, passing one through a trombone delay line to synchronize the pulses in the microwire as in the grey lines and text in Fig. 2.
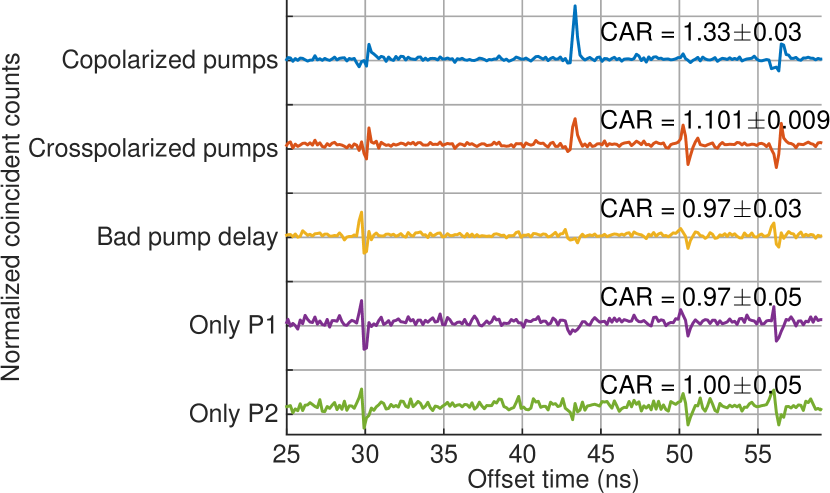
To find evidence of photon pairs with non-degenerate pumping, we took timing histograms as shown in Fig. 5. We present a number of different scenarios: co- and cross-polarized pumps, changing the delay between the two pumps so they do not overlap in the microwire, and removing either of the pumps. Only the first two cases, with the crosspolarized pumps producing 4/9 the number of pairs of the copolarized pumps Agrawal (2013), provide a peak at the proper delay after background subtraction, indicating these photons are due to non-degenerate FWM as desired. The maximum CAR for non-degenerate pumping was with and coupled powers of the two pumps, while the for the lowest asymmetric pump power was with coupled pump powers of and .
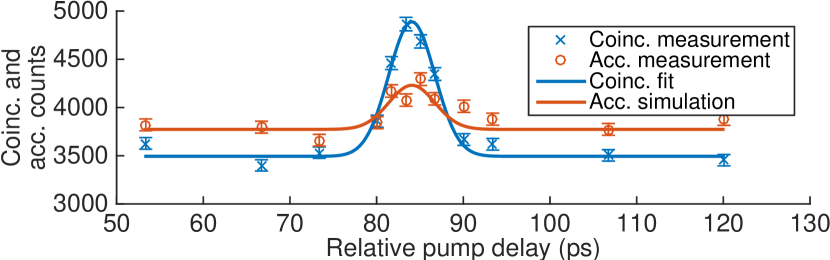
Unfortunately due to bad phasematching (see Fig. 1) and the extra noise brought by having two pumps, these data are not as clear as the degenerate case. A more convincing measurement is one of coincidences and accidentals versus time delay between the two pumps, where photon pairs are produced only when the two pumps overlap, on top a constant background caused by spontaneous Raman scattering. In Fig. 6, we show these data for P1 = , P2 = , and the signal and idler wavelengths and . The coincidence curve is a gaussian fit to the data, which is fed into a quantum-optical FWM simulation that includes higher-order emission but no other nonlinearities to find the expected number of accidentals. The simulated accidentals agree with the data, indicating that the increased accidentals when the pumps overlap are due only to photon emission statistics of the FWM process.
To achieve in future the splitting of a single photon into two will require a single-photon pump of average power. Due to the narrow phasematching shown in Fig. 1, we are currently forced to collect photon pairs in a wavelength region close to the pumps that is contaminated with noise (inset in Fig. 2). The lowest pump power for non-degenerate pumping with which we found was . Additionally, reaching conversion efficiency Dot et al. (2014) would require an average power for the other pump of , whereas we found for non-degenerate pump power only up to . This does not mean that the high conversion efficiency cannot be achieved, but it requires moving the signal and idler much farther in wavelength from the strong pump to avoid noise and broadening their phasematching bandwidths to increase efficiency. By carefully controlling core size and cladding material, it will be possible in future to fabricate microwires with engineered dispersion to reproduce broadband phasematching previously obtained Ahmad and Rochette (2012). If the current photon bandwidth can be expanded to , centered from the pump, times more efficient conversion is expected. These photon pairs would be produced in the Raman gain dips or even beyond the gain peaks, which would improve CAR drastically as shown in chalcogenide waveguides He et al. (2012); Collins et al. (2012).
We have presented evidence of photon pairs produced in an As2Se3 chalcogenide microwire for both degenerate and non-degenerate pumping. Because this device is a tapered fibre, the coupling of optical signals in and out is straightforward and stable with room for improvement in efficiency, making the system very interesting for future applications. Through timing analysis of photon pairs, we found that the coincidences-to-accidentals ratio maintains a value of over a wide range of pump powers, and inferred a maximum pair production rate inside the microwire (limited by detector dead time) of . We look forward to reducing the background noise by engineering the phasematching conditions and pushing closer to efficiency for converting a single photon into a pair.
We acknowledge support from NSERC, Ontario Ministry of Research and Innovation, CIFAR, FedDev Ontario, Industry Canada, and CFI. We are grateful to Coractive High-Tech for providing the chalcogenide glass used in the experiments.
References
- Horodecki et al. (2009) R. Horodecki, P. Horodecki, M. Horodecki, and K. Horodecki, Rev. Mod. Phys. 81, 865 (2009).
- Guerreiro et al. (2014) T. Guerreiro, A. Martin, B. Sanguinetti, J. S. Pelc, C. Langrock, M. M. Fejer, N. Gisin, H. Zbinden, N. Sangouard, and R. T. Thew, Phys. Rev. Lett. 113, 173601 (2014).
- Hamel et al. (2014) D. R. Hamel, L. K. Shalm, H. Hübel, A. J. Miller, F. Marsili, V. B. Verma, R. P. Mirin, S. W. Nam, K. J. Resch, and T. Jennewein, Nature Photon. 8, 801 (2014).
- Cabello and Sciarrino (2012) A. Cabello and F. Sciarrino, Phys. Rev. X 2, 021010 (2012).
- Langford et al. (2011) N. K. Langford, S. Ramelow, R. Prevedel, W. J. Munro, G. J. Milburn, and A. Zeilinger, Nature 478, 360 (2011).
- Tanzilli et al. (2001) S. Tanzilli, H. de Riedmatten, H. Tittel, H. Zbinden, P. Baldi, M. De Micheli, D. B. Ostrowsky, and N. Gisin, Electron. Lett. 37, 26 (2001).
- Zhang et al. (2007) Q. Zhang, X. Xie, H. Takesue, S. W. Nam, C. Langrock, M. M. Fejer, and Y. Yamamoto, Opt. Express 15, 10288 (2007).
- Takesue (2012) H. Takesue, IEEE J. Sel. Top. Quantum Electron. 18, 1722 (2012).
- Xiong et al. (2010) C. Xiong, L. G. Helt, A. C. Judge, G. D. Marshall, M. J. Steel, J. E. Sipe, and B. J. Eggleton, Opt. Express 18, 16206 (2010).
- Xiong et al. (2011) C. Xiong, G. D. Marshall, A. Peruzzo, M. Lobino, A. S. Clark, D.-Y. Choi, S. J. Madden, C. M. Natarajan, M. G. Tanner, R. H. Hadfield, S. N. Dorenbos, T. Zijlstra, V. Zwiller, M. G. Thompson, J. G. Rarity, M. J. Steel, B. Luther-Davies, B. J. Eggleton, and J. L. O’Brien, Appl. Phys. Lett. 98, 051101 (2011).
- Chen et al. (2011) J. Chen, Z. H. Levine, J. Fan, and A. L. Migdall, Opt. Express 19, 1470 (2011).
- Reimer et al. (2014) C. Reimer, L. Caspani, M. Clerici, M. Ferrera, M. Kues, M. Peccianti, A. Pasquazi, L. Razzari, B. E. Little, S. T. Chu, D. J. Moss, and R. Morandotti, Opt. Express 22, 6535 (2014).
- Chiu et al. (2014) C.-K. Chiu, Y.-H. Chen, Y.-C. Chen, I. A. Yu, Y.-C. Chen, and Y.-F. Chen, Phys. Rev. A 89, 023839 (2014).
- Foster et al. (2008) M. A. Foster, A. C. Turner, M. Lipson, and A. L. Gaeta, Opt. Express 16, 1300 (2008).
- Harada et al. (2010) K. Harada, H. Takesue, H. Fukuda, T. Tsuchizawa, T. Watanabe, K. Yamada, Y. Tokura, and S. Itabashi, IEEE J. Sel. Top. Quantum Electron. 16, 325 (2010).
- Eggleton, Luther-Davies, and Richardson (2011) B. J. Eggleton, B. Luther-Davies, and K. Richardson, Nature Photon. 5, 141 (2011).
- Dot et al. (2014) A. Dot, E. Meyer-Scott, R. Ahmad, M. Rochette, and T. Jennewein, Phys. Rev. A 90, 043808 (2014).
- Slusher et al. (2004) R. E. Slusher, G. Lenz, J. Hodelin, J. Sanghera, L. B. Shaw, and I. D. Aggarwal, J. Opt. Soc. Am. B 21, 1146 (2004).
- Ahmad and Rochette (2012) R. Ahmad and M. Rochette, Opt. Express 20, 9572 (2012).
- Baker and Rochette (2012) C. Baker and M. Rochette, Photonics Journal, IEEE, Photonics Journal, IEEE 4, 960 (2012).
- Agrawal (2013) G. P. Agrawal, Nonlinear Fiber Optics, 5th ed. (Academic Press, Boston, 2013).
- Baker and Rochette (2010) C. Baker and M. Rochette, Opt. Express 18, 12391 (2010).
- Kasarova et al. (2007) S. N. Kasarova, N. G. Sultanova, C. D. Ivanov, and I. D. Nikolov, Opt. Mater. 29, 1481 (2007).
- Yan et al. (2012) Z. Yan, D. R. Hamel, A. K. Heinrichs, X. Jiang, M. A. Itzler, and T. Jennewein, Rev. Sci. Instrum. 83, 073105 (2012).
- Steinlechner et al. (2013) F. Steinlechner, S. Ramelow, M. Jofre, M. Gilaberte, T. Jennewein, J. P. Torres, M. W. Mitchell, and V. Pruneri, Opt. Express 21, 11943 (2013).
- Engin et al. (2013) E. Engin, D. Bonneau, C. M. Natarajan, A. S. Clark, M. G. Tanner, R. H. Hadfield, S. N. Dorenbos, V. Zwiller, K. Ohira, N. Suzuki, H. Yoshida, N. Iizuka, M. Ezaki, J. L. O’Brien, and M. G. Thompson, Opt. Express 21, 27826 (2013).
- He et al. (2012) J. He, C. Xiong, A. S. Clark, M. J. Collins, X. Gai, D.-Y. Choi, S. J. Madden, B. Luther-Davies, and B. J. Eggleton, J. Appl. Phys. 112, 123101 (2012).
- Collins et al. (2012) M. J. Collins, A. S. Clark, J. He, D.-Y. Choi, R. J. Williams, A. C. Judge, S. J. Madden, M. J. Withford, M. J. Steel, B. Luther-Davies, C. Xiong, and B. J. Eggleton, Opt. Lett. 37, 3393 (2012).