Iso-Quality of Service: Fairly Ranking
Servers for Real-Time Data Analytics
Abstract
We present a mathematically rigorous Quality-of-Service (QoS) metric which relates the achievable quality of service metric (QoS) for a real-time analytics service to the server energy cost of offering the service. Using a new iso-QoS evaluation methodology, we scale server resources to meet QoS targets and directly rank the servers in terms of their energy-efficiency and by extension cost of ownership. Our metric and method are platform-independent and enable fair comparison of datacenter compute servers with significant architectural diversity, including micro-servers. We deploy our metric and methodology to compare three servers running financial option pricing workloads on real-life market data. We find that server ranking is sensitive to data inputs and desired QoS level and that although scale-out micro-servers can be up to two times more energy-efficient than conventional heavyweight servers for the same target QoS, they are still six times less energy efficient than high-performance computational accelerators.
1The School of Electronics, Electrical Engineering and Computer Science, Queen’s University Belfast, Northern Ireland BT7 1NN, United Kingdom 2The Institute for Electronics Communications and Information Technology, Queen’s University Belfast, The Northern Ireland Science Park Queen’s Road, Belfast, Northern Ireland BT3 9DT, United Kingdom 3Neueda Consulting Limited, Glenwood Business Centre, Springbank Industrial Estate Belfast, Northern Ireland BT17 0QL, United Kingdom
KEY WORDS:Event processing, numerical simulation, energy efficiency, financial analytics, datacentres, kernels, Quality of Service
1 Introduction
Sustaining a defined Quality of Service (QoS) is an integral part of any Service Level Agreement (SLA) pertaining to the provision of enterprise level compute services. These compute services run on large data centers. The key business driver for the owners of these centers is the profit to be made by charging end users for the services provided. QoS provision is an integral part of the owner profit and user cost model of datacenter and datacenter services.
Emerging services providing real-time data analytics, such as trade and credit risk analytics in the capital markets, incur a high usage and hosting premium. The reason is that the computational workloads of these services are highly dynamic, event-driven, and demanding in terms of target real-time response latency, which is often measured in microseconds. QoS provisioning for such services requires significant investments in server and networking infrastructure, in addition to painstaking optimization of the service software.
A central question in provisioning hardware for real-time data analytics is the choice of compute server architecture that will meet the latency targets of the service, while reducing the operational cost of the datacenter and energy consumption in particular. The choice is challenging because of vast differences between servers in architecture, price points, operational points, and target markets. As an example, the experimental campaign that we conducted for this paper suggests that a given QoS target for real-time option pricing workloads on actual market data feeds may be met by server hardware with power budgets ranging from 25W to over 200W and latencies ranging by a factor of five. How does the datacenter owner choose the best server for low-latency, real-time analytics workloads? Conversely, how does a user select the best equipped datacenter to run the same class of workloads? This paper sets to address these questions.
In this paper we present a new QoS metric for the fair ranking of servers that support real-time analytics workloads with low latency requirements. The metric allows direct comparison between servers in terms of raw performance and energy-efficiency, while equating the QoS that they provide to users. This leads to an iso-QoS approach for ranking servers. We present a mathematically rigorous metric that accurately models dynamic workloads with real-time event response deadlines and demonstrate that our metric fits well real-life financial option pricing workloads on actual market data. The metric and its derivation are platform-agnostic and can be used directly to optimize server provisioning for energy cost minimization under SLAs.
We mine data presented in previous papers [1, 2] to rank three servers in terms of iso-QoS under option pricing workloads: a scale-out microserver based on Calxeda SoCs; a dual-socket Intel Sandy Bridge server; and an Intel Xeon Phi server. Our experimental campaign uses option pricing workloads for which we invested identical effort to optimize on each server. The campaign reveals new findings: The scale-out microserver can be up to two times more energy-efficient than heavyweight servers under iso-QoS, but six times less energy-efficient than a high-performance co-processor. Importantly, the relative ranking of servers varies with the option pricing algorithm and input to the algorithm, while changing server provisioning produces also counter-intuitive rankings.
The paper begins by briefly defining financial option contracts and their use in our real-time workloads in Section 2. We move on to details of the platforms used and a summary of our experimental methodology in Section 3. We present our mathematical model for QoS next, in Section 4 and apply an iso-QoS for two option pricing kernels to rank platforms in terms of energy efficiency. In Section 5 we discuss the results of our experimental campaign, while in Section 6 we present related work in the field. Section 7 describes the Nanostreams project within the context of which this work took place. The paper is concluded in Section 8.
2 Computing Option Prices
A financial Option is a contract giving the owner the right to either sell (Put) or to buy (Call) a fixed number of assets, frequently company stock, for a defined price on, (European option) or before (American option) an end date. Methods from stochastic calculus produce equations to model option prices by simulating multiple paths of the underlying variables over a time window. Analytical solutions for these equations are not generally possible so a variety of computational numerical solution methods have been developed. We construct real-time analytics workloads that continuously execute Monte Carlo (MC) or Binomial Tree (BT) option pricing models.
European vanilla options are a particular subset of option types. Black and Scholes [3, 4] proposed a second-order partial differential equation which models the variation of an option price with contractual strike price , over time years to contract expiry, assuming that the underlying asset spot price, follows a log normal distribution and that the volatility of the risk free rate of return, , are constant. An analytic solution to this equation exists for European vanilla options but not generally for other types of options. Our work focuses on European vanilla options because we can then use the Black-Scholes solution to provide a reference against which to compare our code base and its generated numerical results for accuracy.
A rich literature already exists for both the MC and BT methods[5, 6]. therefore we present them only briefly here. An MC simulation computes the current price of a Put contract by
| (1) |
where is a set of random numbers drawn from the standard normal distribution. We generate these using the 32-bit version of the Mersenne Twister algorithm [7] and the Box-Muller transformation. The BT pricing model discretises the time to expiry, in years, into a lattice of levels with the root node as the current underlying asset price . Starting at the root, an up and a down factor are applied to generate two prices at the next level. This continues, using the same constant factors, for all prices at all levels until the end level is reached. The final stage of the algorithm works backwards over the lattice computing an expectation value for each price at each level, finishing at the root node, which then contains the current option price.
Both algorithms depend on a parameter and both converge non-monotonically to an exact answer in the limit . However they have different computational characteristics. Generic MC is a classic “for” loop summation, requiring evaluation of transcendental functions, and its operation count scales as while the BT is dominated by a nested for-loop of add-multiply operations implementing the backward propagation step and scaling as .
3 Experimental Setup and Measurement Methodology
Our experimental setup includes three platforms on which we execute our OptionPricer program and collect workload-specific performance and energy metrics. This Section defines our metrics, describes the platforms used and presents salient details of our methodology used to obtain the power readings and calculate the energy consumption. A complete description of our methodology is available in [1].
3.1 Definition of Metrics
Option pricing in finance takes place by consuming a live streaming data feed of stock market prices, often within the context of high frequency trading (HFT), and for pre-trade risk analytics. The execution time characteristics of option pricing are different from those of numerical simulation in computational science using HPC. By contrast to scientific codes which have measurable setup and post-processing phases, financial option pricing runs relatively small standalone kernels, such as MC and BT, at very high frequency with little set up and post processing work. Option pricing on live market data feeds is actually a form of event processing, where the event is the arrival of a price update on the underlying stock. Based on these distinctions we present and use three workload-specific metrics to compare servers under financial analytics workloads:
- QoS
-
New prices may arrive at any time in a trading session. This means that any contracts not yet priced using the previous price update are abandoned and deemed unusable. Related to the Time/option metric below, but also dependent on market activity, we define the Quality of Service metric (QoS) as the ratio of successful to the total requested option price evaluations. The QoS metric is an application-specific measure on meeting option pricing performance requirements. It is useful for characterizing application-related performance and scalability offered by deploying multiple nodes. It is worth noting that QoS depends on the rate of stock price changes and other market activities at the time of its calculation, so it will be different each time it is calculated in a live market scenario.
- Joules/option
-
(J/Opt or Jopt) The energy consumed per execution of a pricing kernel is a fundamental metric. In the case of an actively traded stock, with a high number of defined option contracts, this building block is executed repeatedly throughout the trading day. Correspondingly, a reduction in this value can result in significant energy savings for providers offering option pricing services.
- Time/option
-
(S/Opt or Sopt) In contrast to providers, end users, particularly those engaged in HFT, are sensitive to end-to-end latency, thereby constraining the elapsed time per option metric. This metric in turn can be used to evaluate the total time to price all contracts for a given stock. Option pricing shares this time-to-solution performance metric in common with HPC applications.
3.2 Hardware Platforms
We used three platforms, one state-of-the-art server architecture with Intel Sandy Bridge processors (briefly referred to as “Intel” in the rest of this paper), one state-of-the-art HPC architecture with Intel Xeon Phi Knights Corner coprocessor (referred to as “Xeon Phi”) and a Calxeda ECX-1000 microserver with ARM Cortex A9 processors, packaged in a Boston Viridis rack-mounted unit (referred to as “Viridis”). We used the version of the GCC compiler and the Intel Compiler ICC version for code generation, the latter only on Intel platforms. The three platforms offer the possibility of scaling their frequency and voltage through a DVFS interface. We conducted experiments only with the highest voltage-frequency settings on each platform, to which we refer as performance mode. Previous work shows that performance mode is the most energy efficient too [1]. The details of the platforms are as follows:
- Intel
-
is an x86-64 server with Sandy Bridge architecture, with 2 Intel Xeon CPU E5-2650 processors operating at a frequency of 2.00GHz and equipped with 8 cores each. The machine has 32GB of DRAM (4 8GB DDR3 @ 1600Mhz). The server runs on Linux CentOS 6.5 with kernel version ().
- Xeon Phi
-
(Knights Corner) is a many core, x86-64 co-processor board (5110P model) over PCIe. It features the many integrated cores (MIC) architecture which offers sixty, 4-way hyperthreaded cores, each equipped with a very wide (512-bit) vector unit. The board has more than GB of GDDR5 DRAM. and the clock frequency is GHz. High performance and high energy efficiency are the result of featuring a highly parallel many core design while running in low clock speeds. The system runs on Linux kernel 2.6.38.8+mpss3.2.1.
- Viridis
-
is a 2U rack mounted server containing sixteen microserver nodes connected internally by a high-speed 10 Gb Ethernet network. The platform appears logically as sixteen servers within one box. Each node is a Calxeda EnergyCore ECX-1000 comprising 4 ARM Cortex A9 cores and 4 GB of DRAM running Ubuntu 12.04 LTS. Viridis has a frequency of GHz.
Note, when referring to the different platform settings later we will use the following notation to represent the platform configuration [Nodes used Cores Used Threads per Core].
3.3 Software
Starting from a common C code base, we created versions which use the vector units on each platform. We achieved this in three different ways
-
•
creating assembler code implementations of hotspot loops
-
•
using compile intrinsic C functions which map to assembler instructions
-
•
using the auto vectorization functionality of the kernel.
| VEC TYPE | Description |
|---|---|
| AVX256 | Assembler code using AVX 256-bit instructions on the Intel Sandyridge. |
| INTRINSICS | Compiler supplied C functions on any platform (ARM 128-bit, Intel 256-bit, Xeon Phi 512-bit) |
| KNC512 | Assembler code for 512-bit vector instruction set on the Xeon Phi (Knights Corner). |
| NEON128 | Assembler code for the ARM NEON 128-bit unit. |
| AUTOVECT | Compiler auto-vectorization on all platforms |
Table 1 defines the labels corresponding to the type of binary. Each experiment, reported later in this paper, is conducted by executing one type of binary on one platform and is labeled accordingly.
3.4 Summary of Methodology
For our experiments, we collected Facebook stock price ticks during a full New York Stock Exchange session and replayed them using UDP multicast to all nodes in each of our platforms, as shown in Figure 1. This is as close as an experiment needs to be to reality without any external glitches or factors affecting the setup or measurements. Detection of a change in the Facebook stock price triggers computation of new prices for 617 Facebook European options at the maximum speed feasible.

Next we discuss on the power measurement methodology. The exact form of the current supply path to the CPU differs from one platform to the next but to provide a fair basis for comparison we identified two distinct points on the path, shown in Figure 2, which are measurable on all platforms. We continuously monitored power on each platform at these points during our experiments. To isolate the energy consumption of processor packages, we capture power consumption at the point before the VRM, which we label PRE-VRM. For the Intel server, PRE-VRM measurement is facilitated by reading the Running Average Power Limit (RAPL) counters while the same functionality on Viridis is available through the Intelligent Platform Management Interface (IPMI) counters, which is also available on the Xeon Phi platform

Figure 3 shows the power versus time plot for a standalone execution of the MC kernel. The BT execution plot is similar.
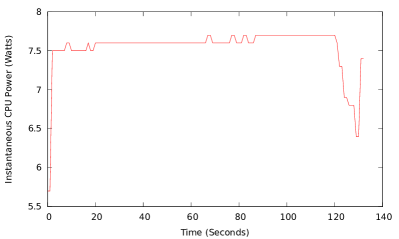
The profile of instantaneous power versus time follows a very sharp trapezoidal shape: the CPU is fully utilized during execution and there are no periods of inactivity. This is a common feature with other numerically intensive HPC applications. It means that the measured average power is a representative measure of energy consumption throughout kernel execution.
4 The Mathematical basis of the QoS Metric
Many of the worlds leading financial trading venues are order driven markets, meaning that investors, especially high frequency traders, submit buy and sell orders independently to matching engine software operating at high speed at the venue. These engines cross buy and sell orders to create trades and are a key part of the electronic trading platforms which underpin high frequency trading. Sequential models, which are the basis to analyze trading patterns in high frequency trading, assume a Poisson distribution to model the arrival of orders affecting stock price into the system.
4.1 The QoS as a cumulative frequency distribution
In this section we explain how we create a QoS curve as a function of price gap frequencies. It is important to note that this curve is dictated solely by the market activity. In the next section we explain how we can determine using the Sopt ad Jopt metrics for a given platform whether we can meet a required QoS value or not.
From our data, we created a histogram of the distribution of time gaps between price updates for the Facebook stock and from this computed a cumulative frequency distribution (CFD) which we noted exhibits the characteristics of a Poisson CFD. This reflects the assumptions of the sequential model of financial trading.
Normally in a CFD the value assigned to bin is the sum of all values in bins . In our case these are time bins so that the frequency is the number of price updates arriving at time intervals up to and including that represented by bin . There is a value of the time gap, depending on the performance of the platform, the number of options to be priced and the kernel used, below which it is not possible to satisfy the hard constraint of computing prices for all defined options. We denoted this by . Our QoS metric actually corresponds to the sum over all time bins greater than this threshold. It follows that our QoS function is obtained by reflecting the initial CFD around its mid-point on the time axis. This means that we can fit our observed time gap distribution to the form
| (2) |
Furthermore, we define the QoS, the y-axis, as a percentage rather an absolute value.
The data for our experiments are taken from a trading session of 6.5 hours where price updates occurred for the Facebook (FB) stock, resulting in the cumulative distribution function representing the QoS shown in figure 4.


The solid line shows the measured values joined directly by straight lines while the dashed curve shows the result of fitting the measured data to the analytic expression for the cumulative Poisson distribution. Further confirmation of the Poisson-like behavior of the arrival of price updates is seen in the profile for the Google stock which is also presented in figure 4. Similar price update profiles occur in work [8] studying prices on the German DAX exchange.
4.2 iso-QoS and total energy consumed
Let us set a required QoS for all our platforms. From the QoS curve we can determine a minimum time constraint, , that we must satisfy. Within seconds we need to compute all options defined on the stock. First of all a platform can only satisfy this constraint if
| (3) |
Assuming this is met, we know that the energy consumed in each time gap is then
| (4) |
where we ignore idle power. Next, we know from the definition of QoS that the total number of time gaps in which we will perform the computation is
| (5) |
so that the energy consumed doing option pricing while meeting QoS is
| (6) |
Platforms may then be ranked, for this QoS, in order of energy consumption.
4.3 Application to platforms
We have applied the equations defined above using the QoS curve in figure 4. Table 2 is the result of the analysis of delivering option pricing with a QoS using the MC kernel operated with 0.5M iterations. Only the five cases (platform plus software) which can satisfy the constraint in equation (3) are reported.
| Platform | VEC TYPE | S/Opt | J/Opt | Energy(KJ) |
|---|---|---|---|---|
| Viridis(1641) | INTRINSICS | 0.0038 | 0.3830 | 239.85 |
| Intel(281) | AUTOVECT | 0.0044 | 0.3794 | 237.58 |
| Xeon Phi(1601) | KNC512 | 0.0046 | 0.2234 | 139.92 |
| Xeon Phi(1602) | NOVECT | 0.0036 | 0.1856 | 116.26 |
| Xeon Phi(1604) | INTRINSICS | 0.0030 | 0.1584 | 99.19 |
We noted that at QoS none of our platform/software combinations could satisfy the constraint in equation (3). We have commented on this characteristic previously [2] explaining that it means only that a subset of all available options can be priced, but not the full set. The MC kernel involves relatively expensive evaluation of the natural logarithm in the Box Muller transform and the exponential function to compute the option price.
We repeated the analysis with the BT kernel, which is dominated by multiply add operations, and report results for QoS values of and in tables 3 - 8.
| Platform | VEC TYPE | S/Opt | J/Opt | Energy(KJ) |
|---|---|---|---|---|
| Intel(281) | AVX256 | 0.0007 | 0.0611 | 306.49 |
| Viridis(1641) | NEON128 | 0.0006 | 0.0603 | 302.41 |
| Intel(181) | INTRINSICS | 0.0013 | 0.0527 | 264.32 |
| Xeon Phi(1604) | INTRINSICS | 0.0005 | 0.0131 | 65.88 |
| Xeon Phi(1602) | INTRINSICS | 0.0004 | 0.0107 | 53.50 |
| Xeon Phi(1601) | INTRINSICS | 0.0004 | 0.0092 | 46.27 |
| Platform | VEC TYPE | S/Opt | J/Opt | Energy(KJ) |
|---|---|---|---|---|
| Intel(281) | INTRINSICS | 0.0015 | 0.1180 | 591.65 |
| Intel(181) | INTRINSICS | 0.0022 | 0.1017 | 509.69 |
| Viridis(1641) | INTRINSICS | 0.0010 | 0.0912 | 457.05 |
| Xeon Phi(1601) | INTRINSICS | 0.0006 | 0.0157 | 78.58 |
| Xeon Phi(1604) | INTRINSICS | 0.0006 | 0.0152 | 76.23 |
| Xeon Phi(1602) | KNC512 | 0.0005 | 0.0139 | 69.76 |
| Platform | VEC TYPE | S/Opt | J/Opt | Energy(KJ) |
|---|---|---|---|---|
| Intel(281) | INTRINSICS | 0.0032 | 0.3038 | 1522.85 |
| Viridis(1641) | INTRINSICS | 0.0017 | 0.1679 | 841.83 |
| Xeon Phi(1602) | AUTOVECT | 0.0007 | 0.0281 | 140.84 |
| Xeon Phi(1604) | INTRINSICS | 0.0009 | 0.0275 | 138.02 |
| Xeon Phi(1601) | KNC512 | 0.0007 | 0.0216 | 108.28 |
| Platform | VEC TYPE | S/Opt | J/Opt | Energy(KJ) |
|---|---|---|---|---|
| Intel(281) | AVX256 | 0.0007 | 0.0611 | 153.24 |
| Viridis(1641) | NEON128 | 0.0006 | 0.0603 | 151.21 |
| Intel(181) | INTRINSICS | 0.0013 | 0.0527 | 132.16 |
| Xeon Phi(1604) | INTRINSICS | 0.0005 | 0.0131 | 32.94 |
| Xeon Phi(1602) | INTRINSICS | 0.0004 | 0.0107 | 26.75 |
| Xeon Phi(1601) | INTRINSICS | 0.0004 | 0.0092 | 23.13 |
| Platform | VEC TYPE | S/Opt | J/Opt | Energy(KJ) |
|---|---|---|---|---|
| Intel(281) | INTRINSICS | 0.0015 | 0.1180 | 295.82 |
| Intel(181) | INTRINSICS | 0.0022 | 0.1017 | 254.85 |
| Viridis(1641) | INTRINSICS | 0.0010 | 0.0912 | 228.52 |
| Xeon Phi(1601) | INTRINSICS | 0.0006 | 0.0157 | 39.29 |
| Xeon Phi(1604) | INTRINSICS | 0.0006 | 0.0152 | 38.11 |
| Xeon Phi(1602) | KNC512 | 0.0005 | 0.0139 | 34.88 |
| Platform | VEC TYPE | S/Opt | J/Opt | Energy(KJ) |
|---|---|---|---|---|
| Intel(281) | INTRINSICS | 0.0032 | 0.3038 | 761.42 |
| Intel(181) | AVX256 | 0.0052 | 0.2526 | 632.95 |
| Viridis(1641) | INTRINSICS | 0.0017 | 0.1679 | 420.92 |
| Xeon Phi(1602) | AUTOVECT | 0.0007 | 0.0281 | 70.42 |
| Xeon Phi(1604) | INTRINSICS | 0.0009 | 0.0275 | 69.01 |
| Xeon Phi(1601) | KNC512 | 0.0007 | 0.0216 | 54.14 |
In figure 5 we show how energy of the scaled out configurations varies with the number of points used. We are comparing Viridis(1641) to Intel(281) and show how the Viridis can actually outperform Intel’s Sandy Bridge while provisioning for an 80% QoS.
5 Discussion
With a fixed number of options, achieving the constraint for a given QoS is inversely proportional to the Sopt metric for the platform and software combination. The energy consumption, therefore the ranking, is not only proportional to the Jopt metric but also depends on Sopt, which determines the time needed to price a set of options. In our work, the top of ranking means the least energy consumption.
Across all the experiments, Xeon Phi is an excellent proposition for energy efficiency, ranking at the top. It consumes 2 up to an order of magnitude less energy than any other platform in any iso-QoS comparison. This is because Xeon Phi features a highly parallel and highly energy efficient manycore architecture which matches the parallelization and vectorization opportunities of the pricing kernels, especially BT. Interestingly, Xeon Phi has increasingly better energy efficiency compared to other platforms the higher the QoS target is and the more iterations the kernels performs. This means Xeon Phi energy efficiency scales better than in any other platform.
Viridis, scaled out to 16 nodes, ranks equivalently and up to 2 better than Intel across all experiments. A trend is visible in the BT kernel results, as the problem size increases. Specifically, the energy used by Viridis(1641) rises more slowly than Intel the bigger the problem size. Indicatively, when , regardless the QoS target, Viridis consumes almost the same energy as Intel. However, when , Viridis uses approximately half the energy of the Intel configurations.
Focusing on BT kernel experiment, it is interesting to note that details of the Xeon Phi configurations which rank at the top are different. Assuming a target QoS of , when , the BT kernel can be served most efficiently by the Xeon Phi(1601) INTRINSICS configuration. When N is increased to this configuration is no longer the most energy efficient being replaced by the Xeon Phi(1602) KNC512. Most interesting when moving to , the Xeon Phi(1601) KNC512 becomes again the most energy efficient. Although, a higher N indicates a heavier computational load, the single-thread per core Xeon Phi configuration has better energy efficiency. This indicates that algorithmic input affects energy consumption in ways that are hard to predict and provision and we leave this investigation as future work.
It is worth noting that none of the top performers involved compiler auto-vectorization. AUTOVECT binaries are absent from most of the tables because these configuration were frequently unable to satisfy the constraint. Observing the tables, the AUTOVECT compiler approach may generate the lowest Sopt metrics but this does not correspond necessarily to a low Jopt metric. This is because compiler optimizations target reducing execution time but not energy consumption.
In addition to the use of the QoS metric to rank platforms fairly, the graph and its analytic fit when combined with values for the Sopt and Jopt metrics allow dynamic predictions and modeling which is of use to data center managers for capacity planning exercises. There are a variety of costs involved in running a data center but simulations of energy consumption and for a three tier (3T) configuration report [9] of the energy being consumed by the servers of which , the largest single component, is from CPUs (modeled as running 130W). Economic cost models distinguish variable cost from fixed cost. For example, the purchase and installation of the platform represents the fixed cost. Our QoS metric addresses part of the so-called variable costs by targeting the cost of the fundamental building block of the service provision, namely the timely computation of option kernels. This allows predictive modeling of the economic option cost, which is associated with choosing to target the requirements of one set of end user customers rather than another.
6 Related Work
Recent related work explores the performance and power consumption of servers based on low-power ARM processors [10, 11] suggests that not all server workloads benefit from maximizing core counts and core frequencies, thus pinpointing opportunities for energy-efficiency optimization. Our work supports these findings but establishes a new metric and method for comparing servers fairly, whereby we equate the objective QoS and allow server resource scaling in our comparisons, as opposed to equating hardware parameters such as hardware feature sizes or core counts. The work of Blem et al [12] studies the performance and power consumption of several ARM and Intel processors but performs head-to-head comparisons of numerous performance and energy metrics, instead of normalizing against one key metric, which is our approach.
Iso-metrics are common tools parallel and distributed computing. Iso-efficiency [13] in terms of sustained to theoretical maximum speedup has routinely been used to compare combinations of parallel algorithms and architectures. Iso-energy-efficiency [14, 15] explores the influence of core scaling and frequency scaling on the energy-efficiency of algorithms and architectures. We establish a new metric that caters to the needs of real-time analytical workloads and emerging architectures that differ vastly in power budgets and form factors, and further establish that the new metric is more appropriate to compare server value propositions given modern hardware diversity.
Related to our work is also prior research on improving the energy-efficiency of real-time financial workloads. Schryver et al [16] present a methodology for efficient design of hardware accelerators for option pricing, whereby they cap the power consumption of the accelerator and the system as a whole. Morales et al [17] propose an FPGA design, programmable using OpenCL to build energy-efficient versions of binomial option pricing algorithms. They report a performance of 2,000 Options/second which is consistent or lower than the performance attained by our Xeon Phi and scaled-out Viridis implementations, but with a power budget of 20W, which is lower than that of any of our platforms. Hardware optimization of our workloads is beyond the scope of this paper but within the scope of our ongoing work in the NanoStreams project 222(http://www.nanostreams.eu). The method presented in this paper fixes a workload-centric QoS metric instead of a system-centric metric, while allowing flexibility in tuning both system and workload parameters to meet the objective metric.
7 The NanoStreams Project
The work reported in this paper has been carried out within the wider context of our Nanostreams project 333(http://www.nanostreams.eu). The project bridges the performance gap between microservers and large servers by enhancing microservers with application-specific, energy-efficient and programmable accelerators. The project is building a heterogeneous microserver with a host SoC and an analytics accelerator SoC, with a total power budget under 10 Watts, where a performance-equivalent system with state of the art server-class processors would consume about 170 Watts.
NanoStreams achieves its goals by adopting a scale-out approach where multiple microservers and sharable accelerators are densely replicated and packaged to build systems with equivalent performance of large-scale servers but a dramatically smaller form factor. A central feature of this is a co-designed software stack providing elastic and scale-free co-execution of parallel workloads. NanoStreams uses processor-based FPGAs using dataflow processing engines (nano-cores) and automatic C compiler generation technology to ease programming of the heterogeneous micro-server. In this paper we have demonstrated that microservers are viable alternatives for low-latency, real-time financial analytics, even if based on the now outphased Calxeda ECX-1000 SoC and the dated Cortex A9 core. We will be evaluating more recent ARM-based SoCs based on 64-bit cores with GPU and FPGA accelerators in future work.
8 Conclusions
In this paper we have presented a mathematical formulation of an application-driven QoS metric for the provision of financial option pricing services. This metric is a function of two workload-specific but architecture-agnostic metrics, seconds per option and Joules per option, plus several application parameters which define the numerical approximation computed. Notably, our study used real stock market streaming data and captured the dynamic, event-driven nature of real-time financial analytics workloads.
Our metric facilitated direct performance comparisons between server platforms with radically different architectural operating points and price points. By defining a fixed QoS, a typical requirement for a service level agreement between a datacenter provider and the end user, we have applied iso-QoS to rank different platforms fairly, with a repeatable workload using real-life and real-time data. Our results show reveal several interesting findings: For example, a microserver with scaled out nodes (Viridis 1641) consumes significantly less energy than a heavy-duty Intel Sandy Bridge server (281) for multiple QoS targets. When scaling out the number of points for computations the microserver consumes about half of the Intel server’s energy.
Our model benefits directly datacenter operators during hardware procurement and capacity planning exercises as it provides values which contribute to the economic option cost of providing service to one or other group of end-users.
Our approach creates many avenues for future research. At its most fundamental our method allows evaluation of a QoS metric for any problem domain in which events, in the present case price updates, have to be processed by intense compute kernels, before the next event arrives. Thus the seconds per option metric would be replaced more generally by a seconds per kernel metric, similarly for the Joules per option metric. An alternative direction of research is to incorporate the number of processors as a variable in the methodology and thus dynamically provision the platforms to accommodate varying demand and a target QoS, while attempting to minimize energy consumption. The metric can also be extended to cater for the provisioning of heterogeneous platforms.
Acknowledgments
The work was supported by the European Commission under its Seventh Framework Programme, grant number 610509 (NanoStreams). This work was also supported by the UK Engineering and Physical Sciences Research Council, under grant agreements EP/K017594/1, EP/L000055/1 and EP/L004232/1.
References
- [1] Georgakoudis G, Gillan C, Sayed A, Spence I, Faloon R, Nikolopoulos D. Methods and metrics for fair server assessment under real-time financial workloads 2014. URL http://arxiv.org/abs/1501.00048.
- [2] Gillan CJ, Nikolopoulos DS, Georgakoudis G, Faloon R, Tzenakis G, Spence I. On the viability of microservers for financial analytics. Proceedings of the 7th Workshop on High Performance Computational Finance, WHPCF ’14, IEEE Press: Piscataway, NJ, USA, 2014; 29–36, doi:10.1109/WHPCF.2014.11. URL http://dx.doi.org/10.1109/WHPCF.2014.11.
- [3] Black F, Scholes M. The valuation of option contracts and a test of market efficiency. J. Finance 1972; 27:399–418.
- [4] Black F, Scholes M. The pricing of options and corporate liabilities. J. Political Econonomy 1973; 81:637–54.
- [5] P Boyle MB, Glasserman P. Monte carlo methods for security pricing. J. Econ. Dynamics and Control 1997; 21:1267–321.
- [6] J C Cox SAR, Rubinstein M. Option pricing: A simplified approach. Journal of Financial Economics 1979; 7:779.
- [7] Matsumoto M, Nishimura T. Mersenne twister: a 623-dimensionally equidistributed uniform pseudo-random number generator. ACM Transactions on Modeling and Computer Simulation 1998; 8:3–30.
- [8] Liu X, Wu X, Wang H, Zhang R, Bailey J, Ramamohanarao K. Mining distribution change in stock order streams. Proceedings of the 26th International Conference on Data Engineering, ICDE 2010, March 1-6, 2010, Long Beach, California, USA, 2010; 105–108, doi:10.1109/ICDE.2010.5447901. URL http://dx.doi.org/10.1109/ICDE.2010.5447901.
- [9] D Kliazovich PB, Khan SU. Greencloud, a packet-level simulator of energy-aware cloud computing data centers. Supercomput. 2012; 62:1263–83.
- [10] Tudor BM, Teo YM. On understanding the energy consumption of arm-based multicore servers. Proceedings of the ACM SIGMETRICS/International Conference on Measurement and Modeling of Computer Systems, SIGMETRICS ’13, 2013; 267–278, doi:10.1145/2465529.2465553. URL http://doi.acm.org/10.1145/2465529.2465553.
- [11] Ou Z, Pang B, Deng Y, Nurminen JK, Yla-Jaaski A, Hui P. Energy- and cost-efficiency analysis of arm-based clusters. Proceedings of the 2012 12th IEEE/ACM International Symposium on Cluster, Cloud and Grid Computing (Ccgrid 2012), CCGRID ’12, 2012; 115–123, doi:10.1109/CCGrid.2012.84. URL http://dx.doi.org/10.1109/CCGrid.2012.84.
- [12] Blem E, Menon J, Sankaralingam K. Power struggles: Revisiting the risc vs. cisc debate on contemporary arm and x86 architectures. Proceedings of the 2013 IEEE 19th International Symposium on High Performance Computer Architecture (HPCA), HPCA ’13, 2013; 1–12, doi:10.1109/HPCA.2013.6522302. URL http://dx.doi.org/10.1109/HPCA.2013.6522302.
- [13] Grama AY, Gupta A, Kumar V. Isoefficiency: Measuring the scalability of parallel algorithms and architectures. IEEE Parallel Distrib. Technol. Aug 1993; 1(3):12–21, doi:10.1109/88.242438. URL http://dx.doi.org/10.1109/88.242438.
- [14] Song S, Grove M, Cameron KW. An iso-energy-efficient approach to scalable system power-performance optimization. Proceedings of the 2011 IEEE International Conference on Cluster Computing, CLUSTER ’11, IEEE Computer Society: Washington, DC, USA, 2011; 262–271, doi:10.1109/CLUSTER.2011.37. URL http://dx.doi.org/10.1109/CLUSTER.2011.37.
- [15] Song S, Su CY, Ge R, Vishnu A, Cameron KW. Iso-energy-efficiency: An approach to power-constrained parallel computation. Proceedings of the 2011 IEEE International Parallel & Distributed Processing Symposium, IPDPS ’11, IEEE Computer Society: Washington, DC, USA, 2011; 128–139, doi:10.1109/IPDPS.2011.22. URL http://dx.doi.org/10.1109/IPDPS.2011.22.
- [16] de Schryver C, Jung M, Wehn N, Marxen H, Kostiuk A, Korn R. Energy efficient acceleration and evaluation of financial computations towards real-time pricing. Knowledge-Based and Intelligent Information and Engineering Systems, Lecture Notes in Computer Science, vol. 6884, K nig A, Dengel A, Hinkelmann K, Kise K, Howlett R, Jain L (eds.). Springer Berlin Heidelberg, 2011; 177–186, doi:10.1007/978-3-642-23866-6˙19. URL http://dx.doi.org/10.1007/978-3-642-23866-6_19.
- [17] Morales VM, Horrein PH, Baghdadi A, Hochapfel E, Vaton S. Energy-efficient fpga implementation for binomial option pricing using opencl. Proceedings of the Conference on Design, Automation & Test in Europe, DATE ’14, European Design and Automation Association: 3001 Leuven, Belgium, Belgium, 2014; 208:1–208:6. URL http://dl.acm.org/citation.cfm?id=2616606.2616862.