Origin of Spinel Nanocheckerboards via First Principles
Abstract
Self-organizing nanocheckerboards have been experimentally fabricated in Mn-based spinels, but have not yet been explained with first principles. Using density-functional-theory, we explain the phase diagram of the system and the origin of nanocheckerboards. We predict total phase separation at zero temperature, then show the combination of kinetics, thermodynamics, and Jahn-Teller physics that generates the system’s observed behavior. We find the {011} surfaces are strongly-preferred energetically, which mandates checkerboard ordering by purely geometrical considerations.
Experimental observation demonstrates intriguing nanoscale compositional ordering in a variety of material alloys. These include noble-metal-alloy nanocheckerboards Leroux1991PMB ; Udoh1995MSEA ; Winn2000JAC , - nanopillars Zheng2004Science , and an assortment of manganite-spinel nanocheckerboards Yeo2006APL ; Park2008NL ; OMalley2008PRB ; Zhang2007APL133123 ; Zhang2007APL233110 . Nanoscale phenomena are inherently difficult to treat with quantum mechanics’ first principles, due to the prohibitive scaling of electronic-structure methods. Previous theoretical studies Bouar1998AM ; Ni2007AM ; Ni2008AM ; Ni2009NL ; Ni2009NM used phase-field models Boettinger2002ARMR ; Steinbach2009MSMSE to simulate nanocheckerboard formation. However, those models rely upon coefficients chosen without first-principles justification. In contrast, our work reveals the origin of nanocheckerboards from first-principles.
Here we examine the experimentally well-characterized manganite spinels . These cooperative-Jahn-Teller crystals, upon doping with certain transition metals, organize into nanocheckerboards. Experiments showed that high-temperature mixing, followed by slow cooling, yields a spontaneously-formed checkerboard whose squares alternate tetragonal Mn-rich and cubic Mn-poor phases. These checkerboards emerge from the cross-section of spontaneously-aligned nanorods. Yeo et al. Yeo2006APL fabricated self-assembling nanocheckerboards from (ZGO) + (ZMO), comprised of nanorods. Later work grew checkerboards with nanorods over 700 nm long on a MgO substrate OMalley2008PRB ; Park2008NL . Checkerboards were later extended to other Mn-based spinels, first (MMFO) Zhang2007APL133123 and then the tunable-sized checkerboards of (CMFO) Zhang2007APL233110 . The latter are notable for a patterning that alternates ferro- and paramagnetic phases, which yields potential for ultrahigh-density information storage.
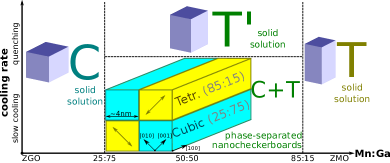
We analyze the nanocheckerboard system , whose relative simplicity renders it a minimal prototype. We sketch the main experimental results of Ref. Yeo2006APL, in Figure 1. ZGO is a cubic spinel while ZMO is a tetragonal spinel ( Asbrink1999PRB ), which immediately leads to some anomalous differences between experiment and naive expectations. First, room-temperature experiments reveal solid solutions at non-negligible concentrations, despite the disparate crystal structures of the end-members, in violation of the Hume-Rothery rules. Second, x-ray diffraction experiments show a cubic structure up to 25% ZMO (and 75% ZGO), whereas a non-negligible tetragonality would be expected at this concentration, regardless of the origin of the observed solubility. Third, in the region where ZMGO phase-separates, experiment shows checkerboard formations instead of traditional spinodal decomposition.
To address these issues, we compute the energetics of using density functional theory as implemented in the Vienna Ab-initio Simulation Package (VASP) Kresse1993PRB ; Kresse1994PRB ; Kresse1996CMS ; Kresse1996PRB . We use a plane-wave cutoff energy of 415 eV, the PW91 generalized gradient approximation (GGA) functional Perdew1992PRB ; Perdew1993PRB , and projector augmented wave (PAW) based pseudopotentials Kresse1999PRB . All calculations are initialized with ferromagnetic ordering for simplicity, a well-justified approach for the Néel temperature of merely K Asbrink1999PRB ; Choi2006PRB ; Li2011MCP . We compute a phase diagram via a cluster expansion Ruban2008RPP of the DFT energetics with Monte-Carlo simulations, as implemented in the Alloy Theoretic Automated Toolkit (ATAT) package Walle2002Calphad ; Walle2002JPE ; Walle2002MSMSE ; Walle2013JOM .
Both ZGO and ZMO crystallize in the spinel structure, with nominal valences of . Zn occupies the tetrahedral (“A”) sites and Ga / Mn occupy the octahedral (“B”) sites, with negligible inversion Fritsch2000SSI ; Errandonea2009PRB . Therefore, our study focuses on the effect of Ga / Mn occupation of the B sites. Each B-centered octahedron shares edges with six others, which couples their anionic distortions. ZGO forms a cubic spinel (space group ) Errandonea2009PRB , while ZMO is a tetragonal spinel (space group ) with significant distortion Asbrink1999PRB . The T′ of Figure 1 (high-temperature fully-mixed ZMGO) has Yeo2006APL . We have provided lattice constants from the literature, and their DFT-calculated analogs, in Supplementary Material (Table S1); DFT calculations agree with experiment. ZMO’s sizable tetragonal distortion is due to the Jahn-Teller (JT) effect in the ions, where the configuration in a high-spin octahedral environment causes the orbitals to break symmetry by a tetragonal distortion. This orbital ordering leads to a martensitic cubic-to-tetragonal transition in a variety of crystals, including spinels Kanamori1960JAP ; Irani1962JPCS ; Englman1972The ; Gehring1975RPP ; Kugel1982SPU . For consistency, we take [001] to be the JT-distorted direction.
Experiments, summarized in Figure 1, show solid solutions for and . Yet the cubic and strongly-tetragonal crystal structures of the end members are expected to be immiscible: Placing a non-JT octahedron in a tetragonal JT-active environment, and vice versa, costs energy. Our DFT calculations quantitatively verify the qualitative Hume-Rothery rules: We generated 192 supercells ( atoms) then fully relaxed the structures. (See Supplementary Material for further calculation details.) Figure 2(a) shows their formation energies, demonstrating that mixing the disparate crystal structures incurs an energy cost 111We would rather not blunt Occam’s razor and trample intuition by suggesting a long-range-only phase-mixing effect with absolutely no evidence.. A ground-state search using the cluster expansion (via the aforementioned ATAT package) revealed no lower-energy supercells. Therefore, the zero-temperature ground state of ZMGO is actually phase separation into bulk ZGO and ZMO, a conclusion absent from previous non-first-principles analyses Ni2007AM ; Ni2008AM ; Ni2009NL ; Ni2009NM . There is no chemical or physical reason to believe that ZGO and ZMO should mix at anything but elevated temperatures.
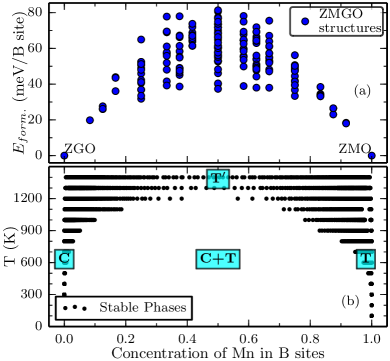
To further verify this, we computed a phase diagram via a cluster expansion, using the aforementioned ATAT package. (See Supplementary Material for extensive calculation details.) As shown in Figure 2(b), the zero-temperature stable phases are immiscible bulk ZGO and ZMO. In fact, the observed miscibility at and is unreasonable at all but extreme temperatures.
We therefore attribute the anomalous miscibility to kinetic limitations, i.e. diffusion constraints. This is corroborated by the experimental observation that slower cooling (i.e. better diffusion) leads to larger checkers (i.e. less miscibility) Zhang2007APL133123 ; Zhang2007APL233110 . In fact, kinetics are the obvious origin of the miscible state observed upon rapid quenching (shown in Figure 1). DFT’s prediction for the state for (taken as the mean of all calculated structures) agrees well with the experimental measurements. For example, DFT predicts , comparable with experiment’s . (See Supplementary Material for all data.) Similarly, kinetic limitations must cause the apparent solubility of and . For example, if diffusion essentially freezes by e.g. 900 K, the system cannot separate into 100/0% Mn mixtures and will remain a high-entropy frozen solid solution. Unfortunately, quantitatively predicting kinetics (including checker size) requires detailed knowledge of the diffusion mechanisms, coupled with complex JT lattice dynamics, which is beyond the scope of this Letter.
Having explained that the apparent solubility is due to kinetics, we must address the second anomaly, the experimental observation of a cubic structure for . In contrast, DFT predicts a tetragonal structure ( for all calculated structures at ) due to the cooperative Jahn-Teller effect.
We propose that the cubic structure of the Mn-poor phase is caused by noncooperative JT distortions at finite temperatures. It is well-known that, as in many spinels, ZMO undergoes a phase transition to a cubic spinel above approximately 1323 K, due to noncooperative JT distortions (each octahedron distorting in a random direction) Irani1962JPCS ; Fritsch2000SSI ; Kanamori1960JAP . The transition temperature scales with doping: Within mean-field theory it is approximately linear with doping Wojtowicz1959PR ; experimentally, a variety of spinels transition at K Irani1962JPCS , where is the tetragonal distortion induced by the cooperative distortion 222Although our calculations show zero-temperature distortion, while the empirical fitting is for room-temperature distortion, the same experiments show relatively little change in distortion below the transition temperature, so the equation is still valid.. As illustrated in Figure 3, both these trends imply that at room temperature, structures of are cubic due to this transition, while are tetragonal. Similar “critical concentrations” of JT-ions have been documented in the literature Wojtowicz1959PR ; Englman1970PRB . This is also consistent with the conclusion of Noh et al. Noh2006APL that although has an XRD pattern of a cubic spinel, it has a rather large JT splitting of eV, i.e. a high-spin electronic configuration, which leads to JT distortion. (See Supplementary Material for detailed analysis of the reliability of GGA’s high-spin prediction.) Therefore, low-temperature measurements should reveal DFT’s tetragonally-distorted structure for .
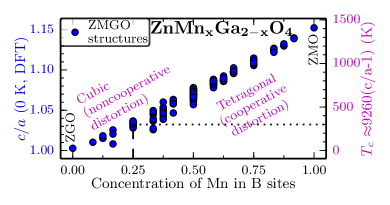
Therefore, the cubic structure is due to the high-entropy noncooperative distortion. We should note that these finite-temperature Jahn-Teller lattice dynamics are expected to enhance miscibility, as noted by other experiments Yeo2009JPCM . For example, whereas experiment places the boundaries at 25/85% Mn, our phase diagram (Figure 2(b)) shows that ZMO is more tolerant of Ga-doping than ZGO of Mn-doping. This discrepancy is likely due to the lack of noncooperative distortions in the cluster-expansion model, although a quantitative treatment is beyond the scope of this Letter. However, this alone would not suffice to cause appreciable solubility near room temperature.
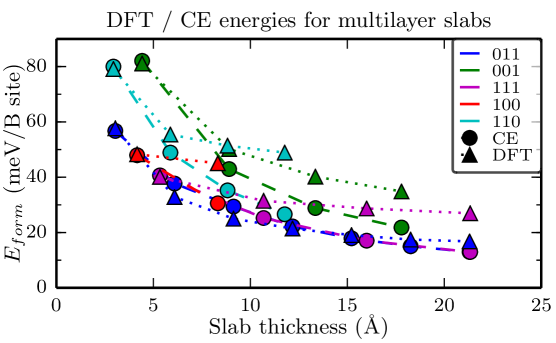
Now we turn to , where slowly-cooled samples phase-separate on a diffusion-limited scale. We seek to explain how this leads to nanocheckerboards rather than traditional spinodal decomposition. We calculate the energy of joining a slab of ZGO to a slab of ZMO along a particular surface; lower energies indicate stable interface directions Liu2007PRL . Figure 4(a) shows the energies of formation for various slab thicknesses. (Larger thicknesses are inaccessible due to large, convergence-challenged supercells.) In agreement with experiment, DFT prefers the {011} surfaces. The energy relative to the next-preferred surface is about (160 meV per cubic unit cell) at only 1.5 nm, and presumably larger for the 4 nm nanocheckerboards.
Due to symmetry, only five directions are calculated directly. We search formation energies of multilayer slabs of thickness oriented in an arbitrary direction by performing an expansion in the symmetry-adapted (tetragonal) harmonics, a standard group-theory methodology Laks1992PRB ; Walle2014PRB . It is apparent from Figure 4(b) that the total formation energy can be approximated by , where A is the cross-sectional area and are constants. We perform an expansion of in the four lowest-order harmonics via a least-squares fit for the five calculated values of . (Fitting data appear in Supplementary Material.) We thus confirm that (011), and equivalently , are the lowest-energy surfaces.
Hence physics dictates that when our system coherently mixes cubic and tetragonal phases, it forms and interfaces. Now pure geometry dictates checkerboard configurations for coherent interfaces. As shown in Figure 4(c), due to bent angles at the interfaces, the only configuration that retains a coherent lattice is the checkerboard formation. It was previously observed that alternating cubic phases are rotated by a few degrees, while alternating tetragonal phases are rotated by Yeo2006APL ; Park2008NL ; Zhang2007APL233110 . The origin is now obvious from Figure 4(c), with the cubic-phase angle of rotation . This agrees with measured values within (data in Supplementary Material, Table S2). This analysis relates our checkerboards to the CoPt cubic-tetragonal nanostructures Leroux1991PMB ; Bouar1998AM and other lattice-induced interface rotations Honig2013NM .
Whence does the {011} preference originate? Previous work showed the importance of both strain and local ionic distortions (i.e. phonons) to the Jahn-Teller effect Marianetti2001PRB . Our slabs’ formation energy consists of strain energy, due to biaxial lattice-matching, and contact energy, due to local ionic distortions and local binding energies. Specifically, for two slabs of thickness joined in direction , we write:
| (1) |
where the units now ensure that the latter two terms converge for for . As shown in Figure 5(a), the strain energy can be computed directly by relaxing ionic coordinates for ZGO and ZMO separately, with strained lattice vectors (the “strained bulk” calculation). Then the contact energy is simply the difference between the formation energy and the strain energy. (Detailed equations appear in Supplementary Material.)
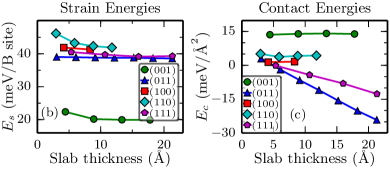
These energies are shown in Figure 5(b-c). We note that {111} and especially {011} have negative contact energies, meaning the strained layered-slab heterostructure is more stable than the strained ZGO and ZMO separated bulk. Hence the local ionic distortions couple beneficially to the lattice strain, i.e. atomic rearrangements partially alleviate the energy penalties of lattice strain. This is predominantly concentrated in the breathing and tetragonal-distortion local modes ( and in the notation of Ref. Vleck1939JCP, ). Remarkably, the contact energy does not converge in the accessible thicknesses, due to the long range of the Jahn-Teller effect. Rather, even a remarkable distance from the surface, interoctahedron coupling leads to intracellular atomic displacement. Therefore the {011} preference originates in a beneficial coupling between strain and long-range atomic displacements (contrary to previous non-first-principles work neglecting the latter Bouar1998AM ; Ni2007AM ; Ni2008AM ; Ni2009NL ; Ni2009NM ).
In conclusion, we have presented the physics of nanocheckerboards based on first-principles calculations. We established that the thermodynamic ground state is complete phase separation. The incomplete separation originates in diffusion limitations, leading to nanoscale phase domains. We explained the observed cubic crystal structure at based on noncooperative Jahn-Teller distortions at room temperature. Therefore, although ZMGO’s ground state is bulk-incoherent, the diffusion-limited structure is bulk-coherent (using the terminology of Ref. Liu2008PRB, ). This bulk coherence leads to phase separation of cubic and tetragonal phases along {011} surfaces, which we showed from first principles. This, in the presence of kinetic constraints, automatically leads to checkerboards, based on pure geometry. The preference for {011} surfaces originates in beneficial coupling between local distortions and lattice strain. Further quantitative understanding will require robust models for the Jahn-Teller effect in doped materials at finite temperatures.
Acknowledgements.
This research used resources of the National Energy Research Scientific Computing Center, a DOE Office of Science User Facility supported by the Office of Science of the U.S. Department of Energy under Contract No. DE-AC02-05CH11231. The authors acknowledge support from a DARPA Young Faculty Award, Grant No. D13AP00051.Supplemental Materials
Here we describe various calculation details in the Letter.
-
•
We provide lattice constants for various crystals according to both experiment and theory.
-
•
We detail the cluster expansion (CE) and related phase-diagram calculations. We discuss the quality of the CE and its challenges for quantitative prediction.
-
•
We justify GGA’s calculation of a high-spin Mn electronic state.
-
•
We provide the calculation details for our expansion of surface energies in the symmetry-adapted harmonics.
-
•
We explain more details of the decomposition of multilayer-slab formation energies into strain and contact components.
I Lattice Constants
Here we detail the lattice constants of the bulk ZMO, ZGO, and mixed structure (). Data are provided in Table I. DFT accurately captures the lattice constants of ZGO, ZMO, and the high-temperature fully-mixed ZMGO (). We model as the average of all calculated structures. These calculations agree with experiment Errandonea2009PRB ; Asbrink1999PRB ; Yeo2006APL , within the 1-2% overestimation characteristic of GGA calculations. We adopt the convention where a cubic crystal has , rather than .
| Lattice param. | Exp. | DFT | DFT Err. | |
|---|---|---|---|---|
| ZGO bulk | 8.34Å | 8.46Å | 1.5% | |
| ZMO bulk | 8.09Å | 8.15Å | 0.8% | |
| ZMGO hi-T | 8.2Å | 8.31Å | 1.3% | |
| ZGOZMGO | -1.6% | -1.8% | ||
| ZMOZMGO | 1.4% | 1.9% | ||
| ZGO bulk (=) | 8.34Å | 8.46Å | 1.5% | |
| ZMO bulk | 9.24Å | 9.41Å | 1.8% | |
| ZMGO hi-T | 8.7Å | 8.89Å | 2.2% | |
| ZGOZMGO | 4.4% | 5.1% | ||
| ZMOZMGO | -5.9% | -5.5% | ||
| ZMO bulk | 1.14 | 1.15 | 0.9% | |
| ZMGO hi-T | 1.06 | 1.07 | 0.9% |
Table 2 compares theory and experiment for the rotation angle of the cubic nanochecker domains. (See the Letter for the equation used.) It is apparent that this simple model successfully calculates the rotation to within .
| Ref. | Substrate | meas. | (Å) | (Å) | (calc.) |
|---|---|---|---|---|---|
| Yeo2006APL, | None | ||||
| Park2008NL, | MgO | ||||
| OMalley2008PRB, | MgO |
II Cluster Expansion Calculations
Here we detail the cluster expansion (CE) and related calculations used to calculate the phase diagram in Figure 2(b). The CE was based on ZMGO structures. These calculations relied on VASP and the ATAT package; references appear in the Letter.
The supercells were generated with ATAT’s MAPS code; then VASP fully relaxed the structure and calculated total energy. Varying supercell sizes require varying numbers of k-points; we use a -centered mesh of at least 1000 k-points per reciprocal atom, as implemented in ATAT. ATAT’s MAPS code then performs a cluster expansion to these energies. Then ATAT’s EMC2 code uses the same cluster expansion for phase diagram calculations.
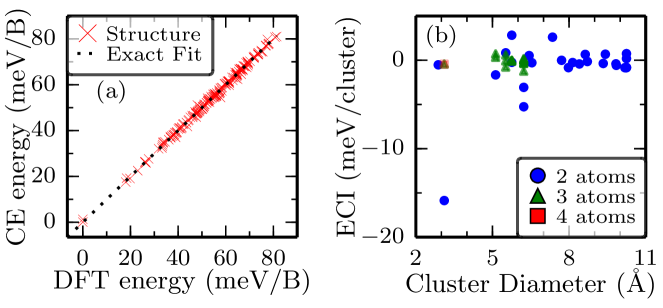
The structure generation, cluster determination, and effective cluster interaction (ECI) fitting was performed with the default settings of ATAT’s MAPS code. The calculation used a total of 192 supercells, of size atoms (). The expansion’s cross-validation score is meV/B-site (compare to energies of formation of 0-80 meV/B). A few additional structures relaxed to a high-energy peculiarity: 5 antiferromagnetic, 4 low-spin, 2 with reoriented distortions (some or all octahedra distorted in instead of ), and 2 anomalous cubic high-spin structures. All remained above the convex hull. When we restricted the antiferromagnetic and low-spin structures to a ferromagnetic high-spin configuration, the energy cost was only 4-12 meV/B. These are omitted from the expansion, because they simply add noise to the physics being fit in the expansion. Due to their high energy and minority, they cannot be expected to change the physics of the system.
Figure S1(a) shows the quality of the fit for the various computed structures. Figure S1(b) shows the ECI as a function of cluster diameter. Intriguingly, the strongest interaction corresponds to the of Wojtowicz Wojtowicz1959PR , a pair repulsion between two adjacent atoms whose shared plane contains the JT-distorted direction. We suspect this interaction’s strength originates in the effect one cation’s (JT-active) mode has on its neighbors’ octahedral modes and the associated energy cost. However, such a discussion is beyond the scope of this work.
We then computed the phase diagram using ATAT’s EMC2 code. We sampled temperatures from 100 to 1400 K in steps of 100 K, with chemical potential (differences) from -30 to +30 meV/B in steps of 0.5 meV/B. For temperatures above 600 K, we additionally sampled from -120 to +120 meV/B in steps of 0.5 meV/B and from -200 to +200 meV/B in steps of 5 meV/B. Results appear in Figure 2(b) of the Letter. We verified the phase diagram with DFT+U, where eV, using the same VASP + MAPS + EMC2 calculations. The phase diagram emerged qualitatively similar, although obviously the temperature scale differed.
As mentioned in the Letter, long-range effects are notoriously difficult to capture with the CE. Later in the Letter, we analyze ZGO/ZMO slabs of thickness layered in the direction . Figure S2 compares the energies of these slabs according to DFT and the above CE.
From this figure, we conclude:
-
1.
The CE has a tendency to overmix relative to the exact result. This is because the phase-separation is due to the long-range JT effect; once the CE has difficulty capturing the full JT effect (see below), it will underestimate phase separation. Therefore, given that the CE phase diagram shows total phase separation, a fortiori this is the correct thermodynamic conclusion.
-
2.
The CE’s failure to precisely resolve these energies means the expansion is insufficiently robust to perform first-principles simulations of kinetics. A more accurate model will be necessary for that.
The origin of the CE’s failure, as mentioned, lies in the long-range nature of the JT effect. This is corroborated by the long-range contact energies described in the Letter. Although the CE is a complete basis, in practice it is truncated after a finite number of terms. To successfully capture this, we would need to include many long-range and large (i.e. many-atom) clusters to the expansion.
We attempted to capture these energetics with a variety of methods.
First, we added these multilayer slabs to the CE’s list of known structures. However, the expansion still did not converge well.
Second, we attempted including reciprocal-space clusters in our fit, via the mixed-basis cluster expansion Laks1992PRB ; Holliger2011PRB . This method fits energies to clusters in reciprocal space that are defined by the structure factor:
| (S1) |
where refers to the pseudospin of a particular site and its location. However, this approach did not succeed either. The variety of necessary -space clusters, especially for the low-symmetry crystal, makes this difficult. Additionally, the discrete phase boundaries make the -space expansion difficult.
Third, we tried enhancing the fitting procedure with a compressive-sensing approach similar to that of Ref. Nelson2013PRB035125, ; Nelson2013PRB155105, . This approach adds a penalty term for nonzero ECI in order to truncate the expansion after a few significant clusters. However, practically this penalty term takes the form of the norm (proportional to the ECI magnitude), rather than the norm (equal for all nonzero ECI). This leads to homogenization of ECI magnitudes, rather than physically expected decay of ECI with cluster size and distance. Despite attempts to compensate for this (similar to the reweighted normalization in Nelson2013PRB155105 ), we could not find a convergent cluster expansion for this difficult system.
Therefore, our CE is insufficiently robust for quantitative simulation, as evidenced by its failure to successfully predict the energies of ZGO/ZMO multilayer slabs. However, despite its tendency to overmix, it demonstrates the tendency of ZMGO to phase-separate even at high temperatures.
III Spin-Crossover Calculations
It may be tempting to propose a spin crossover transition, either to explain the cubic structure at , or to cast aspersions on the GGA calculations. Perhaps Ga-doping raises the crystal field splitting (by shrinking crystal volume), moving the Mn’s -band occupation from to . Then the insignificantly weak JT effect in the manifold leads to an undistorted crystal strucutre. In fact, this spin-crossover transition was attributed to the tetragonal-to-cubic transition of ZMO at a pressure of 23 GPa Asbrink1999PRB ; Choi2006PRB ; Yamanaka2008AMin . Therefore, we further scrutinize GGA’s prediction of spin state and its reliability.
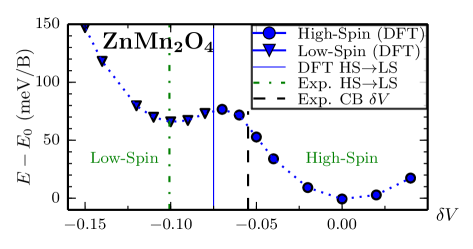
However, it is clear that GGA is correct in predicting a high-spin state. As illustrated in Figure S3, the reported nanocheckerboard lattice parameters place only a 5% (volumetric) strain on the Mn octahedra, whereas the ZMO phase transition occurs at a 10% (volumetric) strain Asbrink1999PRB ; furthermore, GGA predicts the ZMO transition at only 7% (volumetric) strain. It is obvious, then, that GGA has a tendency to overpredict the low-spin state, relative to experiment. Therefore, whereas GGA overpredicts the spin-crossover transition in ZMO, the absence of such a prediction in our structures—and the insufficient strain for such a transition—indicates that there is no spin-crossover transition in our structures or checkerboards. According to this, experiment should find high-spin Mn in , in agreement with GGA; no such experiments have been reported to our knowledge.
IV Symmetry-Adapted Harmonics
In the Letter, we present formation energies for multilayer ZGO/ZMO slabs oriented in five directions. Here we detail the expansion to slabs oriented in an arbitrary direction.
It is obvious from Figure 4(b) that the slab formation energy of multilayer slabs of thickness and cross-section , oriented in direction , can be expressed as , where and scale with area and volume (), respectively. The values of for five directions are calculated from first principles as shown in Figure 4(b).
We now expand the coefficients as linear combinations of the symmetry-adapted harmonics, here the tetragonal () harmonics. These polynomials are orthonormal, where we take the inner product as:
| (S2) |
| Order | ||||
|---|---|---|---|---|
| Irrep. | ||||
| (eV/) | ||||
| (eV/) |
Table 3 shows the first four terms, along with a graphical representation, term order, and irreducible representation that the term transforms as. (The polynomial transforming as also is of the order of , but is a linear combination of those listed.) The same table lists values for and , obtained by a least-squares fit of the four expansion terms to the five known energies.
V Energy Decomposition
In the Letter, we describe the energy decomposition into strain and contact energy, and specifically its interpretation of the (011) preference. Here we present this decomposition in more detail.
The formation energy of a structure (where ) is:
| (S3) |
where all energies are given per-B-site, and refers to the energy of bulk ZG(M)O. The energy of formation is thus the difference between the energy and the “tie-line” connecting the ZGO / ZMO extrema.
The energy of multilayer slabs are comprised of (a) bulk energies of the ZGO and ZMO slabs; (b) strain energy due to coherent lattice matching; (c) chemical binding energies; and (d) intracellular atomic displacements near the surface ( optical phonons). We combine these last two into a contact energy, noting that (unlike the strain) it must decay for infinitely thick slabs. We avoid the term “surface energy” because it can ambiguously refer to contact energy or total slab formation energy.
Therefore, for two slabs of thickness joined in direction :
| (S4) |
We now seek to determine each of these terms from first-energy calculations. Consider the three structures shown in Figure I: relaxed bulk (RB) of pure ZGO and ZMO, strained heterostructure (SH) of fully-relaxed adjacent slabs, and strained bulk (SB) of pure ZM(G)O with lattice parameters set to those of SH.
![[Uncaptioned image]](/html/1501.03480/assets/x15.png)
We can easily calculate the energy of each structure with DFT, using periodic boundary conditions. It is immediately apparent that
| (S5) | ||||
| (S6) | ||||
| (S7) |
It is then trivial to extract and from DFT energies, as depicted in Figure I.
Results are presented in the Letter (Fig. 5). For example, (001) layering contains little strain energy, because the JT-distorted [001] direction is perpendicular to the surface, so ZGO can achieve a cubic lattice and ZMO a tetragonal one. However, this is offset by significant contact energy, due to atomic rearrangements (interoctahedron coupling) near the surface.
In the Letter we interpret the (011) preference with this decomposition.
References
- (1) C. Leroux, A. Loiseau, D. Broddin, and G. Vantendeloo, Phil. Mag. B 64, 57 (Jul 1991)
- (2) K.-I. Udoh, A. E. Araby, Y. Tanaka, K. Hisatsune, K. Yasuda, G. V. Tendeloo, and J. V. Landuyt, Mater. Sci. Eng. A 203, 154 (Nov 1995)
- (3) H. Winn, Y. Tanaka, T. Shiraishi, K. Udoh, E. Miura, R. Hernandez, Y. Takuma, and K. Hisatsune, J. Alloys Compd. 306, 262 (Jun 2000)
- (4) H. Zheng, Science 303, 661 (Jan 2004)
- (5) S. Yeo, Y. Horibe, S. Mori, C. Tseng, C. Chen, A. Khachaturyan, C. Zhang, and S.-W. Cheong, Appl. Phys. Lett. 89, 233120 (2006)
- (6) S. Park, Y. Horibe, T. Asada, L. Wielunski, N. Lee, P. Bonanno, S. O’Malley, A. Sirenko, A. Kazimirov, M. Tanimura, et al., Nano Lett. 8, 720 (2008)
- (7) S. O’Malley, P. Bonanno, K. Ahn, A. Sirenko, A. Kazimirov, M. Tanimura, T. Asada, S. Park, Y. Horibe, and S. Cheong, Phys. Rev. B 78, 165424 (2008)
- (8) C. Zhang, S. Yeo, Y. Horibe, Y. Choi, S. Guha, M. Croft, S.-W. Cheong, and S. Mori, Appl. Phys. Lett. 90, 133123 (2007)
- (9) C. Zhang, C. Tseng, C. Chen, S. Yeo, Y. Choi, and S. Cheong, Appl. Phys. Lett. 91, 233110 (2007)
- (10) Y. Le Bouar, A. Loiseau, and A. Khachaturyan, Acta Mater. 46, 2777 (1998)
- (11) Y. Ni, Y. Jin, and A. Khachaturyan, Acta Mater. 55, 4903 (2007)
- (12) Y. Ni and A. G. Khachaturyan, Acta Mater. 56, 4498 (2008)
- (13) Y. Ni, W. Rao, and A. G. Khachaturyan, Nano Lett. 9, 3275 (Sep 2009)
- (14) Y. Ni and A. G. Khachaturyan, Nat. Mater. 8, 410 (May 2009)
- (15) W. J. Boettinger, J. A. Warren, C. Beckermann, and A. Karma, Annu. Rev. Mater. Res. 32, 163 (Aug 2002)
- (16) I. Steinbach, Modell. Simul. Mater. Sci. Eng. 17, 073001 (2009)
- (17) S. Åsbrink, A. Waśkowska, L. Gerward, J. S. Olsen, and Talik, Phys. Rev. B 60, 12651 (1999)
- (18) G. Kresse and J. Hafner, Phys. Rev. B 47, 558 (1993)
- (19) G. Kresse and J. Hafner, Phys. Rev. B 49, 14251 (1994)
- (20) G. Kresse and J. Furthmüller, Comp. Mater. Sci. 6, 15 (1996)
- (21) G. Kresse and J. Furthmüller, Phys. Rev. B 54, 11169 (1996)
- (22) J. P. Perdew, J. Chevary, S. Vosko, K. A. Jackson, M. R. Pederson, D. Singh, and C. Fiolhais, Phys. Rev. B 46, 6671 (1992)
- (23) J. P. Perdew, J. Chevary, S. Vosko, K. A. Jackson, M. R. Pederson, D. Singh, and C. Fiolhais, Phys. Rev. B 48, 4978 (1993)
- (24) G. Kresse and D. Joubert, Phys. Rev. B 59, 1758 (1999)
- (25) H. Choi, J. Shim, and B. Min, Phys. Rev. B 74, 172103 (2006)
- (26) H. Li, B. Song, W. Wang, and X. Chen, Mater. Chem. Phys. 130, 39 (Oct 2011)
- (27) A. V. Ruban and I. Abrikosov, Rep. Prog. Phys. 71, 046501 (2008)
- (28) A. van de Walle, M. Asta, and G. Ceder, Calphad 26, 539 (Dec 2002)
- (29) A. van de Walle and G. Ceder, J. Phase Equilib. 23, 348 (2002)
- (30) A. Van de Walle and M. Asta, Modell. Simul. Mater. Sci. Eng. 10, 521 (2002)
- (31) A. van de Walle, JOM 65, 1523 (2013), ISSN 1047-4838
- (32) S. Guillemet-Fritsch, C. Chanel, J. Sarrias, S. Bayonne, A. Rousset, X. Alcobe, and M. M. Sarriòn, Solid State Ionics 128, 233 (2000), ISSN 0167-2738
- (33) D. Errandonea, R. S. Kumar, F. Manjón, V. Ursaki, and E. Rusu, Phys. Rev. B 79, 024103 (2009)
- (34) J. Kanamori, J. Appl. Phys. 31, S14 (1960)
- (35) K. Irani, A. Sinha, and A. Biswas, J. Phys. Chem. Solids 23, 711 (Jun 1962)
- (36) R. Englman, The Jahn-Teller effect in molecules and crystals (Wiley-Interscience New York, 1972)
- (37) G. A. Gehring and K. A. Gehring, Rep. Prog. Phys. 38, 1 (Jan 1975)
- (38) K. I. Kugel and D. I. Khomskii, Sov. Phys. Usp. 25, 231 (Apr 1982)
- (39) We would rather not blunt Occam’s razor and trample intuition by suggesting a long-range-only phase-mixing effect with absolutely no evidence.
- (40) P. Wojtowicz, Phys. Rev. 116, 32 (Oct 1959)
- (41) Although our calculations show zero-temperature distortion, while the empirical fitting is for room-temperature distortion, the same experiments show relatively little change in distortion below the transition temperature, so the equation is still valid.
- (42) R. Englman and B. Halperin, Phys. Rev. B 2, 75 (Jul 1970)
- (43) H.-J. Noh, S. Yeo, J.-S. Kang, C. Zhang, S.-W. Cheong, S.-J. Oh, and P. Johnson, Appl. Phys. Lett. 88, 081911 (2006)
- (44) S. Yeo, S. Guha, and S. Cheong, J. Phys. Condens. Matter 21, 125402 (2009)
- (45) J. Z. Liu, G. Trimarchi, and A. Zunger, Phys. Rev. Lett. 99, 145501 (Oct 2007)
- (46) D. B. Laks, L. Ferreira, S. Froyen, and A. Zunger, Phys. Rev. B 46, 12587 (1992)
- (47) A. van de Walle, Q. Hong, L. Miljacic, C. B. Gopal, S. Demers, G. Pomrehn, A. Kowalski, and P. Tiwary, Phys. Rev. B 89, 184101 (May 2014)
- (48) M. Honig, J. A. Sulpizio, J. Drori, A. Joshua, E. Zeldov, and S. Ilani, Nat. Mater. 12, 1112 (2013)
- (49) C. Marianetti, D. Morgan, and G. Ceder, Phys. Rev. B 63 (May 2001), doi:“bibinfo–doi˝–10.1103/PhysRevB.63.224304˝
- (50) J. H. V. Vleck, J. Chem. Phys. 7, 72 (1939)
- (51) J. Z. Liu and A. Zunger, Phys. Rev. B 77, 205201 (May 2008)
- (52) L. Holliger and R. Besson, Phys. Rev. B 83, 174202 (2011)
- (53) L. J. Nelson, G. L. Hart, F. Zhou, and V. Ozoliņš, Phys. Rev. B 87, 035125 (2013)
- (54) L. J. Nelson, V. Ozoliņš, C. S. Reese, F. Zhou, and G. L. Hart, Phys. Rev. B 88, 155105 (2013)
- (55) T. Yamanaka, A. Uchida, and Y. Nakamoto, Am. Mineral. 93, 1874 (Nov 2008)