Long-term causal effects via behavioral game theory
Abstract
Planned experiments are the gold standard in reliably comparing the causal effect of switching from a baseline policy to a new policy. One critical shortcoming of classical experimental methods, however, is that they typically do not take into account the dynamic nature of response to policy changes. For instance, in an experiment where we seek to understand the effects of a new ad pricing policy on auction revenue, agents may adapt their bidding in response to the experimental pricing changes. Thus, causal effects of the new pricing policy after such adaptation period, the long-term causal effects, are not captured by the classical methodology even though they clearly are more indicative of the value of the new policy. Here, we formalize a framework to define and estimate long-term causal effects of policy changes in multiagent economies. Central to our approach is behavioral game theory, which we leverage to formulate the ignorability assumptions that are necessary for causal inference. Under such assumptions we estimate long-term causal effects through a latent space approach, where a behavioral model of how agents act conditional on their latent behaviors is combined with a temporal model of how behaviors evolve over time.
1 Introduction
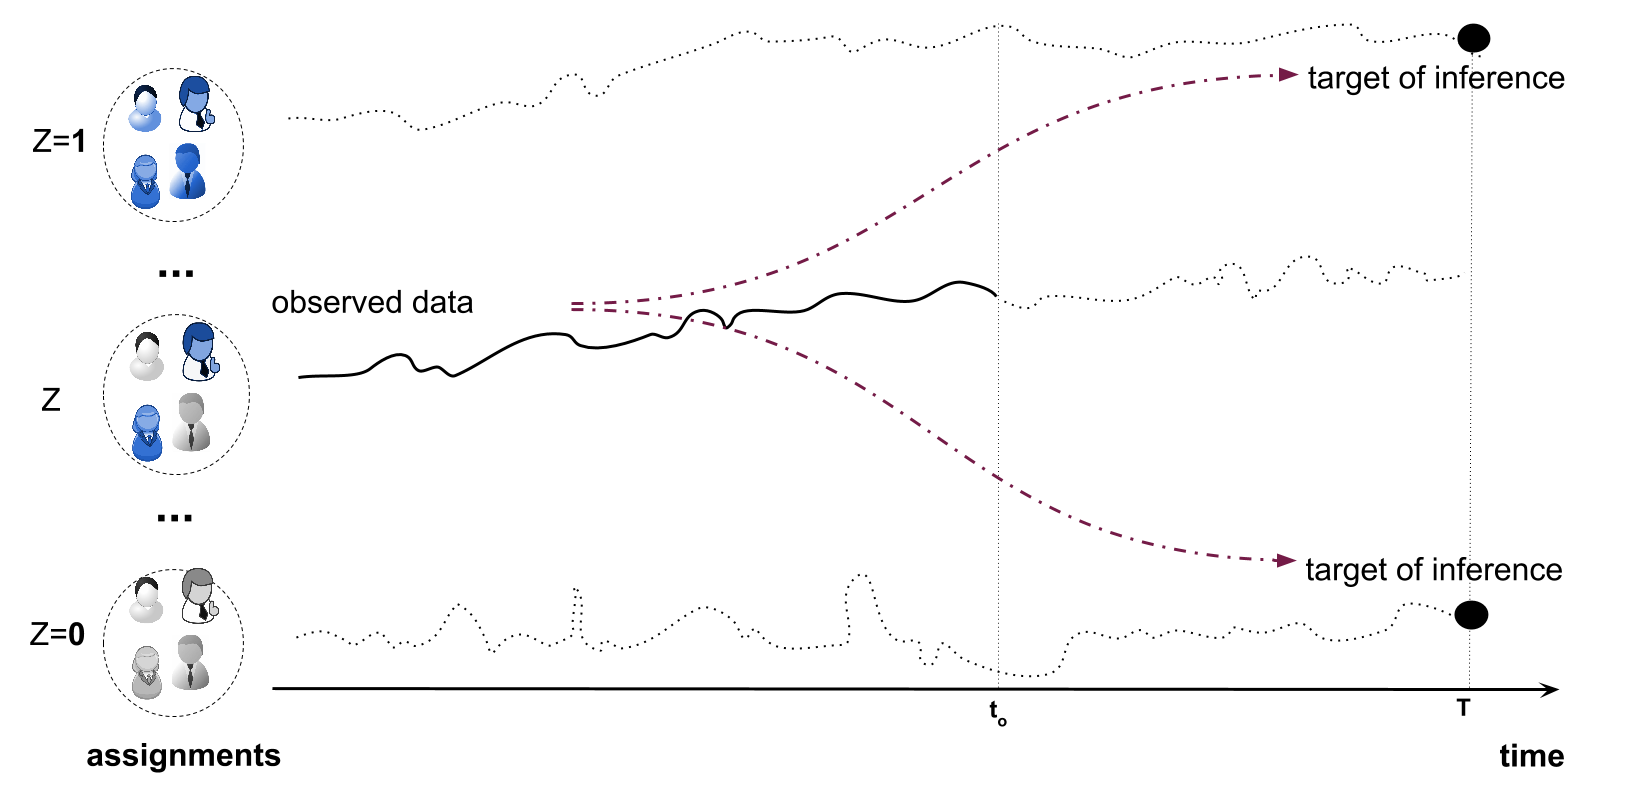
A multiagent economy is comprised of agents interacting under specific economic rules. A common problem of interest is to experimentally evaluate changes to such rules, also known as treatments, on an objective of interest. For example, an online ad auction platform is a multiagent economy, where one problem is to estimate the effect of raising the reserve price on the platform’s revenue. Assessing causality of such effects is a challenging problem because there is a conceptual discrepancy between what needs to be estimated and what is available in the data, as illustrated in Figure 1.
What needs to be estimated is the causal effect of a policy change, which is defined as the difference between the objective value when the economy is treated, i.e., when all agents interact under the new rules, relative to when the same economy is in control, i.e., when all agents interact under the baseline rules. Such definition of causal effects is logically necessitated from the designer’s task, which is to select either the treatment or the control policy based on their estimated revenues, and then apply such policy to all agents in the economy. The long-term causal effect is the causal effect defined after the system has stabilized, and is more representative of the value of policy changes in dynamical systems. Thus, in Figure 1 the long-term causal effect is the difference between the objective values at the top and bottom endpoints, marked as the “targets of inference”.
What is available in the experimental data, however, typically comes from designs such as the so-called A/B test, where we randomly assign some agents to the treated economy (new rules B) and the others to the control economy (baseline rules A), and then compare the outcomes. In Figure 1 the experimental data are depicted as the solid time-series in the middle of the plot, marked as the “observed data”.
Therefore the challenge in estimating long-term causal effects is that we generally need to perform two inferential tasks simultaneously, namely,
The first task is commonly known as the “fundamental problem of causal inference” (Holland, 1986; Rubin, 2011) because it underscores the impossibility of observing in the same experiment the outcomes for both policy assignments that define the causal effect; i.e., that we cannot observe in the same experiment both the outcomes when all agents are treated and the outcomes when all agents are in control, the assignments of which are denoted by and , respectively, in Figure 1. In fact the role of experimental design, as conceived by Fisher (1935), is exactly to quantify the uncertainty about such causal effects that cannot be observed due to the aforementioned fundamental problem, by using standard errors that can be observed in a carefully designed experiment.
The second task, however, is unique to causal inference in dynamical systems, such as the multiagent economies that we study in this paper, and has received limited attention so far. Here, we argue that it is crucial to study long-term causal effects, i.e., effects measured after the system has stabilized, because such effects are more representative of the value of policy changes. If our analysis focused only on the observed data part depicted in Figure 1, then policy evaluation would reflect transient effects that might differ substantially from the long-term effects. For instance, raising the reserve price in an auction might increase revenue in the short-term but as agents adapt their bids, or switch to another platform altogether, the long-term effect could be a net decrease in revenue (Holland and Miller, 1991).
1.1 Related work and our contributions
There have been several important projects related to causal inference in multiagent economies. For instance, Ostrovsky and Schwarz (2011) evaluated the effects of an increase in the reserve price of Yahoo! ad auctions on revenue. Auctions were randomly assigned to an increased reserve price treatment, and the effect was estimated using difference-in-differences (DID), which is a popular econometric method (Card and Krueger, 1994; Donald and Lang, 2007; Ostrovsky and Schwarz, 2011). The DID method compares the difference in outcomes before and after the intervention for both the treated and control units —the ad auctions in this experiment— and then compares the two differences. In relation to Figure 1, DID extrapolates across assignments (y-axis) and across time (x-axis) by making a strong additivity assumption (Abadie, 2005; Angrist and Pischke, 2008, Section 5.2), specifically, by assuming that the dependence of revenue on reserve price and time is additive.
In a structural approach, Athey et al. (2011) studied the effects of auction format (ascending versus sealed bid) on competition for timber tracts. Their approach was to estimate agent valuations from observed data (agent bids) in one auction format and then impute counterfactual bid distributions in the other auction format, under the assumption of equilibrium play in the observed data. In relation to Figure 1, their approach extrapolates across assignments by assuming that agent individual valuations for tracts are independent of the treatment assignment, and extrapolates across time by assuming that the observed agent bids are already in equilibrium. Similar approaches are followed in econometrics for estimation of general equilibrium effects (Heckman et al., 1998; Heckman and Vytlacil, 2005).
In a causal graph approach (Pearl, 2000), Bottou et al. (2013) studied effects of changes in the algorithm that scores Bing ads on the ad platform’s revenue. Their approach was to create a directed acyclic graph (DAG) among related variables, such as queries, bids, and prices. Through a “Causal Markov” assumption they could predict counterfactuals for revenue, using only data from the control economy (observational study). In relation to Figure 1, their approach is non-experimental and extrapolates across assignments and across time by assuming a directed acyclic graph (DAG) as the correct data model, which is also assumed to be stable with respect to treatment assignment, and by estimating counterfactuals through the fitted model.
Our work is different from prior work because it takes into account the short-term aspect of experimental data to evaluate long-term causal effects, which is the key conceptual and practical challenge that arises in empirical applications. In contrast, classical econometric methods, such as DID, assume strong linear trends from short-term to long-term, whereas structural approaches typically assume that the experimental data are already long-term as they are observed in equilibrium. We refer the reader to Sections 2 and 3 of the supplement for more detailed comparisons.
In summary, our key contribution is that we develop a formal framework that (i) articulates the distinction between short-term and long-term causal effects, (ii) leverages behavioral game-theoretic models for causal analysis of multiagent economies, and (iiii) explicates theory that enables valid inference of long-term causal effects.
2 Definitions
Consider a set of agents and a set of actions , indexed by and , respectively. The experiment designer wants to run an experiment to evaluate a new policy against the baseline policy relative to an objective. In the experiment each agent is assigned to one policy, and the experimenter observes how agents act over time. Formally, let be the assignment vector where denotes that agent is assigned to the new policy, and denotes that is assigned to the baseline policy; as a shorthand, denotes that all agents are assigned to the new policy, and denotes that all agents are assigned to the baseline policy, where , generally denote an appropriately-sized vector of ones and zeroes, respectively. In the simplest case, the experiment is an A/B test, where is uniformly random on subject to .
After the initial assignment agents play actions at discrete time points from to . Let be the random variable that denotes the action of agent at time under assignment . The population action , where denotes the -dimensional simplex, is the frequency of actions at time under assignment of agents that were assigned to game ; for example, assuming two actions , then denotes that, under assignment , of agents assigned to the new policy play action at , while the rest play . We assume that the objective value for the experimenter depends on the population action, in a similar way that, say, auction revenue depends on agents’ aggregate bidding. The objective value in policy at time under assignment is denoted by , where . For instance, suppose in the previous example that and produce revenue and , respectively, each time they are played, then is linear and .
Definition 1.
The average causal effect on objective at time of the new policy relative to the baseline is denoted by and is defined as
| (1) |
Suppose that is the time interval required for the economy to adapt to the experimental conditions. The exact definition of is important but we defer this discussion for Section 3.1. The designer concludes that the new policy is better than the baseline if . Thus, is the long-term average causal effect and is a function of two objective values, and , which correspond to the two inferential target endpoints in Figure 1. Neither value is observed in the experiment because agents are randomly split between policies, and their actions are observed only for the short-term period . Thus we need to (i) extrapolate across assignments by pivoting from the observed assignment to the counterfactuals and ; (ii) extrapolate across time from the short-term data to the long-term . We perform these two extrapolations based on a latent space approach, which is described next.
2.1 Behavioral and temporal models
We assume a latent behavioral model of how agents select actions, inspired by models from behavioral game theory. The behavioral model is used to predict agent actions conditional on agent behaviors, and is combined with a temporal model to predict behaviors in the long-term. The two models are ultimately used to estimate agent actions in the long-term, and thus estimate long-term causal effects. As the choice of the latent space is not unique, in Section 3.1 we discuss why we chose to use behavioral models from game theory.
Let denote the behavior that agent adopts at time under experimental assignment . The following assumption puts a constraints on the space of possible behaviors that agents can adopt, which will simplify the subsequent analysis.
Assumption 1 (Finite set of possible behaviors).
There is a fixed and finite set of behaviors such that for every time , assignment and agent , it holds that ; i.e., every agent can only adopt a behavior from .
The set of possible behaviors essentially defines a collection of probabilities that is sufficient to compute the likelihood of actions played conditional on adopted behavior—we refer to such collection as the behavioral model.
Definition 2 (Behavioral model).
The behavioral model for policy defined by set of behaviors is the collection of probabilities
for every action and every behavior , where denotes the characteristics of policy .
As an example, a non-sophisticated behavior could imply that , i.e., that the agent adopting simply plays actions at random. Conditioning on policy in Definition 2 allows an agent to choose its actions based on expected payoffs, which depend on the policy characteristics. For instance, in the application of Section 4 we consider a behavioral model where an agent picks actions in a two-person game according to expected payoffs calculated from the game-specific payoff matrix—in that case is simply the payoff matrix of game .
The population behavior denotes the frequency at time under assignment of the adopted behaviors of agents assigned to policy . Let denote the entire history of population behaviors in the experiment up to time . A temporal model of behaviors is defined as follows.
Definition 3 (Temporal model).
For an experimental assignment a temporal model for policy is a collection of parameters , and densities , such that for all ,
| (2) |
A temporal model defines the distribution of population behavior as a time-series with a Markovian structure subject to and being stable with respect to . In other words, regardless of how agents are assigned to games, the population behavior in the game will evolve according to a fixed model described by and . The model parameters may still depend on the treatment assignment .
3 Estimation of long-term causal effects
Here we develop the assumptions that are necessary for inference of long-term causal effects.
Assumption 2 (Stability of initial behaviors).
Let be the proportion of agents assigned to the new policy under assignment . Then, for every possible ,
| (3) |
where is a fixed population behavior invariant to .
Assumption 3 (Behavioral ignorability).
The assignment is independent of population behavior at time , conditional on policy and behavioral history up to ; i.e., for every and policy ,
Remarks. Assumption 2 implies that the agents do not anticipate the assignment as they “have made up their minds” to adopt a population behavior before the experiment. It follows that the population behavior marginally corresponds to draws from bins of total size . The bin selection probabilities at every draw depend on the experimental design; for instance, in an A/B experiment where the population behavior at can be sampled uniformly such that . Quantities such as that in Eq. (3) are crucial in causal inference because they can be used as a pivot for extrapolation across assignments.
Assumption 3 states that the treatment assignment does not add information about the population behavior at time , if we already know the full behavioral history of up to , and the policy which agents are assigned to; hence, the treatment assignment is conditionally ignorable. This ignorability assumption precludes, for instance, an agent adopting a different behavior depending on whether it was assigned with friends or foes in the experiment.
Algorithm 1 is the main methodological contribution of this paper. It is a Bayesian procedure as it puts priors on parameters of the temporal model, and then marginalizes these parameters out.
Input:
Output: Estimate of long-term causal effect in Eq. (1).
Theorem 1 (Estimation of long-term causal effects).
Suppose that behaviors evolve according to a known temporal model, and actions are distributed conditionally on behaviors according to a known behavioral model. Suppose that Assumptions 1, 2 and 3 hold for such models. Then, for every policy as the iterations of Algorithm 1 increase, The output of Algorithm 1 asymptotically estimates the long-term causal effect, i.e.,
Remarks. Theorem 1 shows that consistently estimates the long-term causal effect in Eq. (1). We note that it is also possible to derive the variance of this estimator with respect to the randomization distribution of assignment . To do so we first create a set of assignments by repeatedly sampling according to the experimental design. Then we adapt Algorithm 1 so that (i) Step 4 is removed; (ii) in Step 5, is sampled from its posterior distribution conditional on observed data, which can be obtained from the original Algorithm 1. The empirical variance of the outputs over from the adapted algorithm estimates the variance of the output of the original algorithm. We leave the full characterization of this variance estimation procedure for future work.
As Theorem 1 relies on Assumptions 2 and 3, it is worth noting that the assumptions may be hard but not impossible to test in practice. For example, one idea to test Assumption 3 is to use data from multiple experiments on a single game . If fitting the temporal model (3) on such data yields parameter estimates that depend on experimental assignment , then Assumption 3 would be unjustified. A similar test could be used for Assumption 2 as well.
3.1 Discussion
Methodologically, our approach is aligned with the idea that for long-term causal effects we need a model for outcomes that leverages structural information pertaining to how outcomes are generated and how they evolve. In our application such structural information is the microeconomic information that dictates what agent behaviors are successful in a given policy and how these behaviors evolve over time.
In particular, Step 1 in the algorithm relies on Assumptions 2 and 3 to infer that model parameters, are stable with respect to treatment assignment. Step 5 of the algorithm is the key estimation pivot, which uses Assumption 2 to extrapolate from the experimental assignment to the counterfactual assignments and , as required in our problem. Having pivoted to such counterfactual assignment, it is then possible to use the temporal model parameters , which are unaffected by the pivot under Assumption 3, to sample population behaviors up to long-term , and subsequently sample agent actions at (Steps 8 and 9).
Thus, a lot of burden is placed on the behavioral game-theoretic model to predict agent actions, and the accuracy of such models is still not settled (Hahn et al., 2015). However, it does not seem necessary that such prediction is completely accurate, but rather that the behavioral models can pull relevant information from data that would otherwise be inaccessible without game theory, thereby improving over classical methods. A formal assessment of such improvement, e.g., using information theory, is open for future work. An empirical assessment can be supported by the extensive literature in behavioral game theory (Stahl and Wilson, 1994; McKelvey and Palfrey, 1995), which has been successful in predicting human actions in real-world experiments (Wright and Leyton-Brown, 2010).
Another limitation of our approach is Assumption 1, which posits that there is a finite set of predefined behaviors. A nonparametric approach where behaviors are estimated on-the-fly might do better. In addition, the long-term horizon, , also needs to be defined a priori. We should be careful how interferes with the temporal model since such a model implies a time at which population behavior reaches stationarity. Thus if we implicitly assume that the long-term causal effect of interest pertains to a stationary regime (e.g., Nash equilibrium), but if we assume that the effect pertains to a transient regime, and therefore the policy evaluation might be misguided.
4 Application on data from a behavioral experiment
In this section, we apply our methodology to experimental data from Rapoport and Boebel (1992), as reported by McKelvey and Palfrey (1995). The experiment consisted of a series of zero-sum two-agent games, and aimed at examining the hypothesis that human players play according to minimax solutions of the game, the so-called minimax hypothesis initially suggested by Von Neumann and Morgenstern (1944). Here we repurpose the data in a slightly artificial way, including how we construct the designer’s objective. This enables a suitable demonstration of our approach.
Each game in the experiment was a simultaneous-move game with five discrete actions for the row player and five actions for the column player. The structure of the payoff matrix, given in the supplement in Table 1, is parametrized by two values, namely and ; the experiment used two different versions of payoff matrices, corresponding to payments by the row agent to the column agent when the row agent won (), or lost (): modulo a scaling factor Rapoport and Boebel (1992) used for game 0 and for game 1.
Forty agents, , were randomized to one game design (20 agents per game), and each agent played once as row and once as column, matched against two different agents. Every match-up between a pair of agents lasted for two periods of 60 rounds, with each round consisting of a selection of an action from each agent and a payment. Thus, each agent played for four periods and 240 rounds in total. If is the entire assignment vector of length 40, means that agent was assigned to game 1 with payoff matrix and means that was assigned to game 0 with payoff matrix .
In adapting the data, we take advantage of the randomization in the experiment, and ask a question in regard to long-term causal effects. In particular, assuming that agents pay a fee for each action taken, which accounts for the revenue of the game, we ask the following question:
What is the long-term causal effect on revenue if we switch from payoffs of game 0 to payoffs of game 1?”.
The games induced by the two aforementioned payoff matrices represent the two different policies we wish to compare. To evaluate our method, we consider the last period as long-term, and hold out data from this period. We define the causal estimand in Eq. (1) as
| (4) |
where and is a vector of coefficients. The interpretation is that, given an element of , the agent playing action is assumed to pay a constant fee . To check the robustness of our method we test Algorithm 1 over multiple values of .
4.1 Implementation of Algorithm 1 and results
Here we demonstrate how Algorithm 1 can be applied to estimate the long-term causal effect in Eq. (4) on the Rapoport & Boebel dataset. To this end we clarify Algorithm 1 step by step, and give more details in the supplement.
Step 1: Model parameters. For simplicity we assume that the models in the two games share common parameters, and thus , where are the parameters of the behavioral model to be described in Step 8. Having common parameters also acts as regularization and thus helps estimation.
Step 4: Sampling parameters and initial behaviors As explained later we assume that there are 3 different behaviors and thus are vectors with 3 components. Let denote that every component of is uniform on , independently. We choose diffuse priors for our parameters, specifically, , , and . Given we sample the initial behaviors as Dirichlet, i.e., and , independently.
Steps 5 & 7: Pivot to counterfactuals. Since we have a completely randomized experiment (A/B test) it holds that and therefore . Now we can pivot to the counterfactual population behaviors under and by setting .
Step 8: Sample counterfactual behavioral history. As the temporal model, we adopt the lag-one vector autoregressive model, also known as . We transform111 is defined as the function , , where wlog. the population behavior into a new variable (also do so for ). Such transformation with a unique inverse is necessary because population behaviors are constrained on the simplex, and thus form so-called compositional data (Aitchison, 1986; Grunwald et al., 1993). The VAR(1) model implies that
where is the th component of and is i.i.d. standard bivariate normal. Eq. (6) is used to sample the behavioral history, , in Step 8 of Algorithm 1.
Step 9: Behavioral model. For the behavioral model, we adopt the quantal -response () model (Stahl and Wilson, 1994), which has been successful in predicting human actions in real-world experiments (Wright and Leyton-Brown, 2010). We choose behaviors, namely of increased sophistication parametrized by . Let denote the payoff matrix of game and let the term strategy denote a distribution over all actions. An agent with behavior plays the uniform strategy,
An agent of level-1 (row player) assumes to be playing only against level-0 agents and thus expects per-action profit (for column player we use the transpose of ). The level-1 agent will then play a strategy proportional to , where for vector denotes the element-wise exponentiation, . The precision parameter determines how much an agent insists on maximizing expected utility; for example, if , the agent plays the action with maximum expected payoff (best response); if , the agent acts as a level-0 agent. An agent of level-2 (row player) assumes to be playing only against level-1 agents with precision and therefore expects to face strategy proportional to . Thus its expected per-action profit is , and plays strategy .
Given and we calculate a matrix where the th column is the strategy played by an agent with behavior . The expected population action is therefore . The population action is distributed as a normalized multinomial random variable with expectation , and so , where is the multinomial density of observations with probabilities . Hence, the full likelihood for observed actions in game in Steps 10 and 11 of Algorithm 1 is given by the product
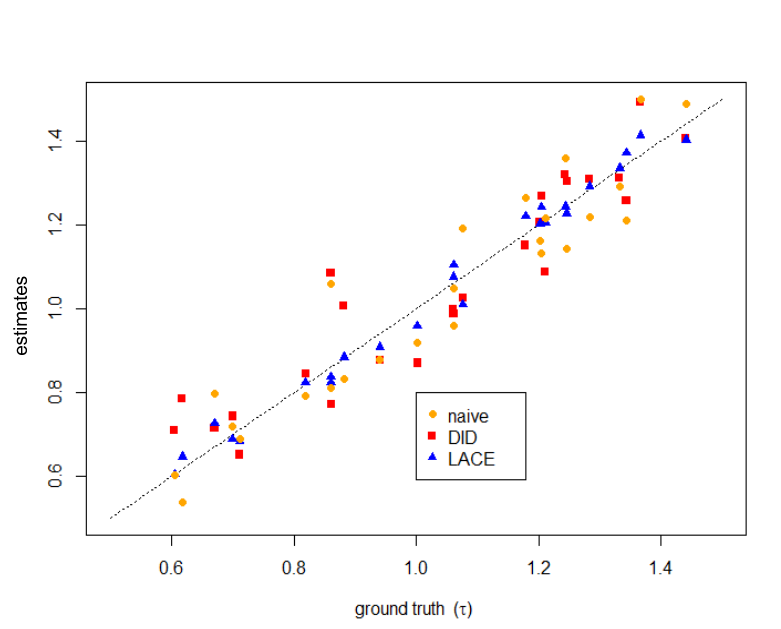
Running Algorithm 1 on the Rapoport and Boebel dataset yields the estimates shown in Figure 2, for 25 different fee vectors , where each component is sampled uniformly at random from . We also test difference-in-differences (DID), which estimates the causal effect through
and a naive method (“naive” in the plot), which ignores the dynamical aspect and estimates the long-term causal effect as .
Our estimates (“LACE” in the plot) are closer to the truth () than the estimates from the naive method () and from DID (). This illustrates that our method can pull game-theoretic information from the data for long-term causal inference, whereas the other methods cannot.
5 Conclusion
One critical shortcoming of statistical methods of causal inference is that they typically do not assess the long-term effect of policy changes. Here we combined causal inference and game theory to build a framework for estimation of such long-term effects in multiagent economies. Central to our approach is behavioral game theory, which provides a natural latent space model of how agents act and how their actions evolve over time. Such models enable to predict how agents would act under various policy assignments and at various time points, which is key for valid causal inference. Working on data from an actual behavioral experiment set we showed how our framework can be applied to estimate the long-term effect of changing the payoff structure of a normal-form game.
Our framework could be extended in future work by incorporating learning (e.g., fictitious play, bandits, no-regret learning) to better model the dynamic response of multiagent systems to policy changes. Another interesting extension would be to use our framework for optimal design of experiments in such systems, which needs to account for heterogeneity in agent learning capabilities and for intrinsic dynamical properties of the systems’ responses to experimental treatments.
Acknowledgements
The authors wish to thank Leon Bottou, the organizers and participants of CODE@MIT’15, GAMES’16, the Workshop on Algorithmic Game Theory and Data Science (EC’15), and the anonymous NIPS reviewers for their valuable feedback. Panos Toulis has been supported in part by the 2012 Google US/Canada Fellowship in Statistics. David C. Parkes was supported in part by NSF grant CCF-1301976 and the SEAS TomKat fund.
References
- Abadie (2005) Abadie, A. (2005). Semiparametric difference-in-differences estimators. The Review of Economic Studies, 72(1), 1–19.
- Aitchison (1986) Aitchison, J. (1986). The statistical analysis of compositional data. Springer.
- Angrist and Pischke (2008) Angrist, J. D. and Pischke, J.-S. (2008). Mostly harmless econometrics: An empiricist’s companion. Princeton university press.
- Athey et al. (2011) Athey, S., Levin, J., and Seira, E. (2011). Comparing open and sealed bid auctions: Evidence from timber auctions. The Quarterly Journal of Economics, 126(1), 207–257.
- Bottou et al. (2013) Bottou, L., Peters, J., Quiñonero-Candela, J., Charles, D. X., Chickering, D. M., Portugualy, E., Ray, D., Simard, P., and Snelson, E. (2013). Couterfactual reasoning and learning systems. J. Machine Learning Research, 14, 3207–3260.
- Brodersen et al. (2014) Brodersen, K. H., Gallusser, F., Koehler, J., Remy, N., and Scott, S. L. (2014). Inferring causal impact using bayesian structural time-series models. Annals of Applied Statistics.
- Card and Krueger (1994) Card, D. and Krueger, A. B. (1994). Minimum wages and employment: A case study of the fast food industry in New Jersey and Pennsylvania. American Economic Review, 84(4), 772–793.
- Dash (2005) Dash, D. (2005). Restructuring dynamic causal systems in equilibrium. In Proceedings of the Tenth International Workshop on Artificial Intelligence and Statistics (AIStats 2005), pages 81–88.
- Dash and Druzdzel (2001) Dash, D. and Druzdzel, M. (2001). Caveats for causal reasoning with equilibrium models. In Symbolic and Quantitative Approaches to Reasoning with Uncertainty, pages 192–203. Springer.
- Donald and Lang (2007) Donald, S. G. and Lang, K. (2007). Inference with difference-in-differences and other panel data. The review of Economics and Statistics, 89(2), 221–233.
- Fisher (1935) Fisher, R. A. (1935). The design of experiments. Oliver & Boyd.
- Granger (1988) Granger, C. W. (1988). Some recent development in a concept of causality. Journal of econometrics, 39(1), 199–211.
- Grunwald et al. (1993) Grunwald, G. K., Raftery, A. E., and Guttorp, P. (1993). Time series of continuous proportions. Journal of the Royal Statistical Society. Series B (Methodological), pages 103–116.
- Hahn et al. (2015) Hahn, P. R., Goswami, I., and Mela, C. F. (2015). A bayesian hierarchical model for inferring player strategy types in a number guessing game. The Annals of Applied Statistics, 9(3), 1459–1483.
- Heckman and Vytlacil (2005) Heckman, J. J. and Vytlacil, E. (2005). Structural equations, treatment effects, and econometric policy evaluation1. Econometrica, 73(3), 669–738.
- Heckman et al. (1998) Heckman, J. J., Lochner, L., and Taber, C. (1998). General equilibrium treatment effects: A study of tuition policy. American Economic Review, 88(2), 3810386.
- Holland and Miller (1991) Holland, J. H. and Miller, J. H. (1991). Artificial adaptive agents in economic theory. The American Economic Review, pages 365–370.
- Holland (1986) Holland, P. W. (1986). Statistics and causal inference. Journal of the American statistical Association, 81(396), 945–960.
- McKelvey and Palfrey (1995) McKelvey, R. D. and Palfrey, T. R. (1995). Quantal response equilibria for normal form games. Games and economic behavior, 10(1), 6–38.
- Ostrovsky and Schwarz (2011) Ostrovsky, M. and Schwarz, M. (2011). Reserve prices in internet advertising auctions: A field experiment. In Proceedings of the 12th ACM conference on Electronic commerce, pages 59–60. ACM.
- Pearl (2000) Pearl, J. (2000). Causality: models, reasoning and inference. Cambridge University Press.
- Rapoport and Boebel (1992) Rapoport, A. and Boebel, R. B. (1992). Mixed strategies in strictly competitive games: A further test of the minimax hypothesis. Games and Economic Behavior, 4(2), 261–283.
- Rubin (2011) Rubin, D. B. (2011). Causal inference using potential outcomes. Journal of the American Statistical Association.
- Stahl and Wilson (1994) Stahl, D. O. and Wilson, P. W. (1994). Experimental evidence on players’ models of other players. Journal of Economic Behavior & Organization, 25(3), 309–327.
- Von Neumann and Morgenstern (1944) Von Neumann, J. and Morgenstern, O. (1944). Theory of games and economic behavior. Princeton University Press.
- Wright and Leyton-Brown (2010) Wright, J. R. and Leyton-Brown, K. (2010). Beyond equilibrium: Predicting human behavior in normal-form games. In Proc. 24th AAAI Conf. on Artificial Intelligence.
Appendix A Proof of Theorem 1
Theorem 1 (Estimation of long-term causal effects).
Suppose that behaviors evolve according to a known temporal model, and actions are distributed conditionally on behaviors according to a known behavioral model. Suppose that Assumptions 1, 2 and 3 hold for such models. Then, for every policy as the iterations of Algorithm 1 increase, The output of Algorithm 1 asymptotically estimates the long-term causal effect, i.e.,
Proof.
Fix a policy in Algorithm 1 and drop the subscript in the notation of the algorithm. Therefore we can write:
The way Algorithm 1 is defined, as the iterations increase the variable is estimating
We now rewrite this integral as follows.
The first equation, , holds by definition of the behavioral model: the history of latent behaviors is sufficient for the likelihood of observed actions. Another way to phrase this is that conditional on latent behavior the observed action is independent from any other variable.
Similarly, as the iterations increase the variable is estimating
We now rewrite this integral as follows.
By the continuous mapping theorem we conclude that
Thus and and so
i.e., Algorithm 1 consistently estimates the long-term causal effect. ∎
Appendix B Connection of assumptions to policy invariance
Assumption 3 in our framework is related to policy invariance assumptions in econometrics of policy effects (Heckman and Vytlacil, 2005; Heckman et al., 1998). Intuitively, policy invariance posits that given the choice of policy by an agent, the initial process that resulted in this choice does not affect the outcome. For example, given that an individual chooses to participate in a tax benefit program, the way the individual was assigned to the program (e.g., lottery, recommendation, or point of a gun) does not alter the outcome that will be observed for that individual. Our assumption is different because we have a temporal evolution of population behavior and there is no free choice of an agent about the assignment, since we assume a randomized experiment. But our assumption shares the essential aspect of conditional ignorability of assignment that is crucial in causal inference.
Appendix C Discussion of related methods
Consider the estimand for the Rapoport-Boebel experiment (Rapoport and Boebel, 1992):
Here we discuss how standard methods would estimate such estimand. Our goal is to illustrate the fundamental assumptions underpinning each method, and compare with our Assumptions 2 and 3. To illustrate we will assume a specific value . In discussing these methods, we will mostly be concerned with how point estimates compare to the true value of the estimand, which here is using the experimental data in Table 2.
The naive approach would be to consider only the latest observed time point () under the experiment assignment , and use the observed population actions under as an estimate for ; i.e.,
But for this estimate to be unbiased for , we generally require that
The naive estimate therefore makes a direct extrapolation from to and from the observed assignment to the counterfactual assignments and . This ignores, among other things, the dynamic nature of agent actions.
A more sophisticated approach is to analyze the agent actions as a time series. For example, Brodersen et al. (2014) developed a method to estimate the effects of ad campaigns on website visits. Their method was based on the idea of “synthetic controls”, i.e., they created a time-series using different sources of information that would act as the counterfactual to the observed time-series after the intervention. However, their problem is macroeconometric and they work with observational data. Thus, there is neither experimental randomized assignment to games, nor strategic interference between agents, nor dynamic agent actions. More crucially, they do not study long-term equilbrium effects. By construction, in our problem we can leverage behavioral game theory to make more informed predictions of counterfactuals to time points after the intervention at which the distribution of outcomes has stabilized.
Another approach, common in econometrics, is the difference-in-differences (DID) estimator (Card and Krueger, 1994; Donald and Lang, 2007; Ostrovsky and Schwarz, 2011). In our case, this method is not perfectly applicable because there are no observations before the intervention, but we can still entertain the idea by considering period as the pre-intervention period. The DID estimator compares the difference in outcomes before and after the intervention for both the treated and control groups. In our application, this estimator takes the value
| (5) |
This estimate is also far from the true value similar to the naive estimate. The DID estimator is unbiased for only if there is an additive structure in the actions (Abadie, 2005), (Angrist and Pischke, 2008) (Section 5.2), e.g., , where is a policy-specific parameter, is a temporal parameter, and is noise. The DID estimator thus captures a linear trend in the data by assuming a common parameter for both treatment arms () that is canceled out in subtraction in Eq. (5). The extent to which an additivity assumption is reasonable depends on the application, however, by definition, it implies ignorability of the assignment (i.e., does not appear in the model of ), and thus it relies on assumptions that are stronger than our assumptions (Abadie, 2005; Angrist and Pischke, 2008).
In a structural approach, Athey et al. (2011) studied the effects of timber auction format (ascending versus sealed bid) on competition for timber tracts. They estimated bidder valuations from observed data in one auction and imputed counterfactual bid distributions in the other auction, under the assumption of equilibrium play in both auctions. This approach makes two critical implicit assumptions that together are stronger than Assumption 3. First, the bidder valuation distribution is assumed to be a primitive that can be used to impute counterfactuals in other treatment assignments. In other words, the assignment is independent of bidder values, and thus it is strongly ignorable. Second, although imputation is performed for potential outcomes in equilibrium, which captures the notion of long-term effects, inference is performed under the assumption of equilibrium play in the observed outcomes, and thus temporal dynamic behavior is assumed away.
Finally, another popular approach to causality is through directed acyclical graphs (DAGs) between the variables of interest (Pearl, 2000). For example, Bottou et al. (2013) studied the causal effects of the machine learning algorithm that scores online ads in the Bing search engine on the search engine revenue. Their approach was to create a full DAG of the system including variables such as queries, bids, and prices, and made a Causal Markov assumption for the DAG. This allows to predict counterfactuals for the revenue under manipulations of the scoring algorithm, using only observed data generated from the assumed DAG. However, a key assumption of the DAG approach is that the underlying structural equation model is stable under the treatment assignment, and only edges coming from parents of the manipulated variable need to be removed; as before, assignment is considered strongly ignorable. As pointed out by Dash and Druzdzel (2001) this might be implausible in equilibrium systems. Consider, for example, a system where , and a manipulation that sets the distribution of independently of . Then after manipulation the two edges will need to be removed. However, if in an equilibrium it is required that , then the two arrows should be reversed after the manipulation. Proper causal inference in equilibrium systems through causal graphs remains an open area without a well-established methodology (Dash, 2005).
Finally we note that there exists the concept of Granger causality (Granger, 1988), which remains important in econometrics. The central idea in Granger causality is predictability, in particular the ability of lagged iterates of a time series to predict future values of the outcome of interest, which in our case is the population action . This causality concept does not take into account the randomization from the experimental design, which is key in statistical causal inference.
Appendix D Application: Rapoport and Boebel (1992) data
The following tables report the payoff matrix structure (Table 1 used by Rapoport and Boebel) and the observed data (Table 2), as reported by McKelvey and Palfrey (1995).
| W | L | L | L | L | |
| L | L | W | W | W | |
| L | W | L | L | W | |
| L | W | L | W | L | |
| L | W | W | L | L |
| row agent | column agent | ||||||||
|---|---|---|---|---|---|---|---|---|---|
| Game | Period | ||||||||
| 1 | 1 | 0.308 | 0.307 | 0.113 | 0.120 | 0.350 | 0.218 | 0.202 | 0.092 |
| 1 | 2 | 0.293 | 0.272 | 0.162 | 0.100 | 0.333 | 0.177 | 0.190 | 01.40 |
| 1 | 3 | 0.273 | 0.350 | 0.103 | 0.123 | 0.353 | 0.133 | 0.258 | 0.102 |
| 1 | 4 | 0.295 | 0.292 | 0.113 | 0.135 | 0.372 | 0.192 | 0.222 | 0.063 |
| 2 | 1 | 0.258 | 0.367 | 0.105 | 0.143 | 0.332 | 0.115 | 0.245 | 0.140 |
| 2 | 2 | 0.290 | 0.347 | 0.118 | 0.110 | 0.355 | 0.198 | 0.208 | 0.108 |
| 2 | 3 | 0.355 | 0.313 | 0.082 | 0.100 | 0.355 | 0.215 | 0.187 | 0.110 |
| 2 | 4 | 0.323 | 0.270 | 0.093 | 0.105 | 0.343 | 0.243 | 0.168 | 0.107 |
Appendix E More details on Bayesian computation
Here we offer more details about the choices in implementing Algorithm 1 in Section 4.1 of the main paper. For convenience we repeat the content of Section 4.1 in the main paper and then expand with our details.
Step 1: Model parameters. For simplicity we assume that the models in the two games share common parameters, and thus , where are the parameters of the behavioral model to be described in Step 8. Having common parameters also acts as regularization and thus helps estimation. We emphasize that this simplification is not necessary as we could have two different set of parameters for each game. It is crucial, however, that the parameters are stable with respect to the treatment assignment because we need to extrapolate from the observed assignment to the counterfactual ones.
Step 4: Sampling parameters and initial behaviors As explained later we assume that there are 3 different behaviors and thus are vectors with 3 components. Let denote that every component of is uniform on , independently. We choose diffuse priors for our parameters, specifically, , , and . Given we sample the initial behaviors in the two games as and , independently.
Regarding the particular choices of these distributions, we first note that needs to have positive components because it is used as an argument to the Dirichlet distribution. Larger values than 10 could be used for the components of but the implied Dirichlet distributions would not differ significantly than the ones we use in our experiments. Regarding we note that its components are used in quantities of the form and so it is reasonable to bound them, and the interval is diffuse enough given the values of implied by the payoff matrix in Table 1. Finally the prior for the temporal model parameters, , is also diffuse enough. An alternative would be to use a multivariate normal distribution as the prior for but this would not alter the procedure significantly.
Steps 5 & 7: Pivot to counterfactuals. Since we have a completely randomized experiment (A/B test) it holds that and therefore . Now we can pivot to the counterfactual population behaviors under and by setting .
Step 8: Sample counterfactual behavioral history. As the temporal model, we adopt the lag-one vector autoregressive model, also known as . We transform222The map is defined as the function such that, for vectors and , , and wlog, indicates that , for . the population behavior into a new variable (also do so for ). Such transformation with a unique inverse is necessary because population behaviors are constrained on the simplex, and thus form so-called compositional data (Aitchison, 1986; Grunwald et al., 1993). The VAR(1) model implies that
| (6) |
where is the th component of and is i.i.d. standard bivariate normal. Eq. (6) is used to sample the behavioral history, , from to , as described in Step 8 of Algorithm 1.
Such sampling is straightforward to do. We simply need to sample the random noises for every , and then compute each successively. Given the sample we can then transform back to calculate the population behaviors —for we repeat the same procedure with a new sample of since the two games share the same temporal model parameters .
Step 9: Behavioral model. Here we rewrite the specifics of the behavioral model with more details. In agents possess increasing levels of sophistication. Following earlier work Wright and Leyton-Brown (2010), we adopt , and thus consider a behavioral space with three different behaviors .
Recall that a behavior represents the distribution of actions that an agent will play conditional on adopting that behavior. In such distributions depend on an assumption of quantal response, which is defined as follows. Let denote a vector such that is the expected utility of an agent taking action , and let denote the payoff matrix in game as in Table 1. If an agent is facing another agent with strategy (distribution over actions) , then . The quantal best-response with parameter determines the distribution of actions that the agent will take facing expected utilities , and is defined as
where, for a vector with elements , is a vector with elements . The parameter is called the precision of the quantal best-response. If is very large then the response is closer to the classical Nash best-response, whereas if the agent ignores the utilities and randomizes among actions.
Let be the precision parameters. Let denote the distribution over actions implied for an agent who adopts behavior. Given the model calculates , for , as follows:
-
•
Agents who adopt , termed level-0 agents, have precision , and thus will randomly pick one action from the action space . Thus,
regardless of the argument .
-
•
An agent who adopts , termed level-1 agent, has precision and assumes that is playing against a level-0 type agent. Thus, the agent is facing a vector of utilities , and so
-
•
An agent who adopts , termed level-2 agent, has precision and assumes is playing against a level-1 agent with precision . Thus, it estimates that it is facing strategy , where as above. The expected utility vector of the level-2 agent is , and thus
Given and we can therefore write down a matrix where the th column is the distribution over actions played by an agent conditional on adopting behavior . Conditional on population action the expected population action is . The population action is distributed as a multinomial with expectation , and so , where is the multinomial density of observations with expected frequencies . Hence, the full likelihood for observed actions in game required in Steps 10 and 11 of Algorithm 1 is given by the product