Suffolk University,
73 Tremont St., Boston, MA 02108, USA
{dzinoviev,zzhu,kjli}@suffolk.edu
Building Mini-Categories in Product Networks
Abstract
We constructed a product network based on the sales data collected and provided by a Fortune 500 Specialty Retailer. The structure of the network is dominated by small isolated components, dense clique-based communities, and sparse stars and linear chains and pendants. We used the identified structural elements (tiles) to organize products into mini-categories—compact collections of potentially complementary and substitute items. The mini-categories extend the traditional hierarchy of retail products (group–class–subcategory) and may serve as building blocks towards exploration of consumer projects and long-term customer behavior.
Keywords:
retailing, product network, mini-category, category management1 Introduction
Consumer projects are large and major customer undertakings, often involving a considerable amount of money, effort, and emotions. Examples of consumer projects include porch renovation, Christmas decoration, wedding planning, and moving into a college dorm. For each project, customers often make multiple cross-category purchases through multiple shopping trips. Such projects, in light of their significant relevance to retailers’ financial outcomes and customer relationship [1], are subject to thorough academic and managerial investigations.
Theoretically, customer project management represents the frontier of the category management domain, which is considered crucial by 72% of retailers surveyed by Kantar Retail in 2011. For years, most retailers have been using only standard market research tools, mostly for within-transaction product associations (e.g., market basket analysis [2]) and only from the functional or manufacturers’ perspectives for understanding product categories [3]. Few studies have explored product association at the consumer project level.
The criticality of category management and the dearth of understanding of consumers’ project purchase behaviors serve as the impetus of this research. This study aims to answer a key question: how to categorize purchased products properly to prepare for project detection? Equipped with the new advancements in complex network analysis techniques [4, 5], we expect our study to discover product associations from the customers’ view point, identify mini-categories that serve as building blocks of project material list, and provide guidance on managing project-level shopping behaviors. In particular, we use Product Network Analysis (PNA) as the primary analytical tool for this study. PNA applies Social Network Analysis (SNA) algorithms to category management and is the automated discovery of relations and key products within a product portfolio.
Methodologically, our research applies network analysis methods to categorize products based on community discovery, a novel and potentially insightful approach to the retailing field. Managerially, findings of this study will facilitate improving consumer-centric category management beyond the traditional market basket analysis [6]. Our results will also provide guidance on designing customized recommendation and promotion systems based on identified project shopping behaviors [7].
The rest of the paper is organized as follows. We overview prior work in Section 2. In Section 3, we describe the data set. In Section 4, we explain the product network construction algorithm. We explore the structure of the constructed network and introduce mini-categories in Section 5. We conclude and outline future work in Section 6.
2 Prior Work
Raeder and Chawla [8] are among the pioneers of product network-leveled analysis. The authors follow an intuitive approach to constructing a network of products from a list of sales transactions: each node in the network represents a product, and two nodes are connected by an edge if they have been bought together in a transaction. Many real-world interaction networks contain communities, which are groups of nodes that are heavily connected to each other, but not much to the rest of the network. It is logical to expect that product networks contain communities as well. Detecting communities in complex networks is known as “community discovery”[9]. In recent years, it has been one of the most prolific sub-branches of complex network analysis, with dozens of algorithms proposed and the agreement within the scientific community that there is no unique solution to this problem given the many different possible definitions of “community” for different applications [10]. Raeder and Chawla [8] focus on community discovery in product networks and show how communities of products can be used to gain insight into customer behavior.
Pennacchioli et al. [10] compare two community discovery approaches: a partitioning approach, where each product belongs to a single community, and an overlapping approach, where each product may belong to multiple communities. The authors apply the approaches to a data set of an Italian retailer and find that the former is useful to improve product classification while the latter can create a collection of different customer profiles. Xie et al. [7] provide a review and comparative study of overlapping community discovery techniques. Videla-Cavieres and Ríos [11] propose a community discovery approach based on graph mining techniques that distinguishes two forms of overlapping: crisp overlapping, where each product belongs to one or more communities with equal strength; and fuzzy overlapping, where each product may belong to more than one community but the strength of its membership in each community may vary. Kim et al. [6] extend the idea of using only sales transaction data to build product networks by utilizing customer information as well. The authors construct two types of product networks: a market basket network (MBN), which spatially expands the relationship between products purchased together into relationship among all products using network analysis; and a co-purchased product network (CPN), which is extracted from customer-product bipartite network obtained using transaction data. The topological characteristics and performances of the two types of networks are compared.
3 The Data Set
The data set provided to us through the Wharton Customer Analytics Initiative (WCAI) [12], consists of product descriptions and purchase descriptions.
The product part includes descriptions of ca. 111,000 material items, 351 non-material items (such as gift cards, warranties, deposits, rental fees, and taxes), and 71 items that combine materials and services. Since the descriptions of the non-material items are generic and not easy to associate with particular customer projects, we excluded them from our analysis.
The products are organized into a three-level hierarchy of 1,778 subcategories (e.g., landscaping), 235 classes (e.g., live goods), and 15 groups loosely corresponding to departments (e.g., outdoor). The members at each level in the hierarchy are non-overlapping.
The purchase part contains the information of about 11,631,000 sales111For the purpose of this study, all items with the same product ID, purchased by the same customer at the same register at the same time, are considered one sale. and 545,000 returns. For each sale and return, we know the product ID, the buyer ID, and the location (store ID and register ID), date, time, quantity, and price of the sale, and discounts, if applicable. The sales recorded in the data set took place over two years between 05/03/2012 and 02/03/2014. 99.6% of the sales were initiated and completed in stores; the remaining sales were made online.
The members at each level in the product hierarchy significantly vary in size. The variance can be estimated in terms of the observed entropy versus the entropy of a uniform, homogeneous distribution of member sizes (higher entropy means higher homogeneity). The data set group sizes range from 6 to 25,888 (=3.57 vs. =3.91); class sizes—from 1 to 21,167 (=4.37 vs. =7.88); subcategory sizes—from 1 to 12,355 (=4.55 vs. =10.79). The striking heterogeneity of the hierarchy members makes it hard to treat them as first-order building blocks for further research.
The data set product hierarchy reflects the store organization by departments, sections, and subsections/shelves. While this grouping makes perfect sense from the functional perspective (items performing similar functions or intended for similar purposes, such as nails and screws, are shelved together), it does not reveal latent task-oriented connections between products. For example, 91% of screws are in the hardware and electrical groups, but 82% of screwdrivers are in the tools group, another 18% are in the electrical group, and none are in the hardware. The assignment of screws and screwdrivers to different groups (and, therefore, different departments) ignores the fact that both are required for screwdriving. As a consequence, by observing the purchase of screws as an item from the hardware group and a screwdriver as an item from the tools group, a researcher may not be able to detect that the customer is about to start a screwdriving “project.”
To circumvent the problems of heterogeneity and lack of support for task- or project-orientated classification, we introduce another level in the data set hierarchy—mini-categories. We later define the mini-categories as structural subnetworks within the overall product network. The product network construction algorithm is described in the next Section.
4 Product Network Construction
A product network [3, 6, 10] is a graph reflecting the product co-occurrences in a customer’s “basket” [6, 8, 11]. The graph nodes represent individual material items purchased by customers. Two nodes and are connected with an edge if the products and are frequently purchased together (not necessarily by the same customer). The existence of an edge between two products suggests a purposeful connection between the products, such as co-suitability for a certain task, as in the screws and screwdriver example above.
A product network graph is undirected (if is connected to then is connected to ). It does not contain loops (a node cannot be connected to itself) or parallel edges ( can be connected to at most once). The graph in general is disconnected—it consist of multiple components, one of which, the giant connected component (GCC), may have a substantially bigger size than the others.
Depending on the construction procedure, the graph can be unweighted or weighted. In the former case, the existence of an edge indicates that the strength of the connection between the two incident nodes (e.g., the likelihood of the two items to be in the same “basket”) is simply at or above certain threshold . In the latter case, the strength of the connection is treated as an attribute of the edge; this way, some edges are stronger than others. A weighted graph can be converted to an unweighted graph by eliminating weak edges and treating strong edges as unweighted. An unweighted, undirected graph with no loops and parallel edges is called a simple graph.
While weighted graphs are more detailed, simple graphs are easier to visualize and comprehend. Many graph processing algorithms (and applications) are optimized for simple graphs. In our quest for mini-categories, which are ambiguously defined, we believe that the benefits of having a more detailed representation of product interconnections are offset by the fuzzy mini-category detection techniques, and do not outweigh the added complexity of handling weighted graphs. That is why we chose simple graphs as the representation of the product network.
At the first stage of the network construction, we create a graph node for each material item that has been purchased by a customer at least once over the observation period, to the total of 85,865 nodes.
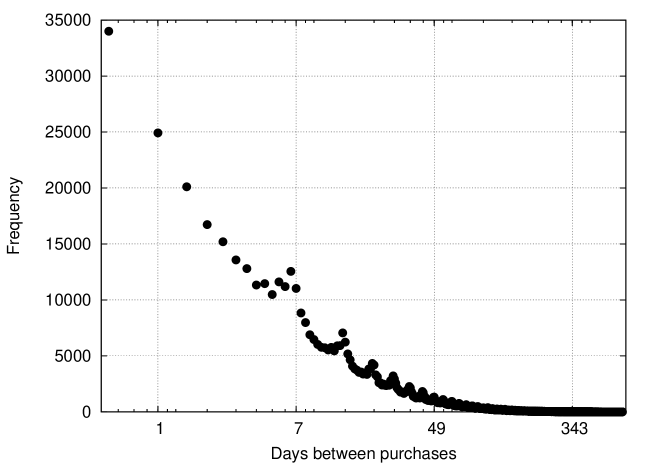
At the second stage, two nodes are connected if the corresponding items have been purchased together at least times. To quantify the concept of togetherness, we first observed that the customers are more likely to visit the store every weeks (Fig. 1), which must be caused by the weekly work cycle. We use one week as a natural window span and consider two purchases by the same customer to be in the same “basket” if they were made within seven days (not necessarily within one calendar week).
The choice of controls the density and the connectedness of the product network. A bigger results in a sparse network with many tiny isolated components that cannot be efficiently grouped into mini-categories. A smaller yields a very dense network, dominated by the GCC and unsuitable for community detection algorithms.
Table 1 presents product network statistics for =1, 5, 10, and 20: numbers of edges, nodes, isolated single nodes, isolated pairs of nodes, and components; the size of the giant connected component, and the relative volume of sales of the GCC items. The two least dense networks (=10 and 20) have a subtle GCC and many isolates. The densest network (=1) essentially consists only of a very dense, nonclusterable GCC. The transition from =1 to =5 substantially reduces the GCC size while preserving its relative sales volume, thus making it possible, without the loss of generality, to disregard the sales of the isolated items. For this reason, we adopted =5.
| N | 1 | 5 | 5∗ | 10 | 20 |
|---|---|---|---|---|---|
| Edges | 8,066,192 | 104,643 | 28,760 | 26,187 | 7,126 |
| Nodes | 85,865 | 85,865 | 85,053 | 85,865 | 85,865 |
| Isolated nodes | 1,026 | 67,007 | 69,619 | 78,283 | 82,982 |
| Isolated pairs | 71 | 682 | 953 | 494 | 244 |
| Components | 1,107 | 67,989 | 71,069 | 79,051 | 83,352 |
| Absolute GCC size | 84,669 | 16,215 | 11,164 | 5,296 | 1,677 |
| Relative GCC size | 98.6% | 18.9% | 13.1% | 6.2% | 2.0% |
| Sales in the GCC | 99.9% | 70.0% | 51.3% | 45.0% | 26.0% |
4.1 Staples
The resulting product network is a power-law graph with a long-tail degree distribution with (Fig. 2). The distribution of sales volumes for individual items also follows the power law222In fact, node degrees and the corresponding sales volumes are correlated with . with . Most items are isolated nodes or have fewer than 10 connections. However, there is a number of staples [14] in the tails of the distributions that are (a) frequently purchased from the store and (b) frequently purchased together with other items.

The top 20 staples in the product network are shown in Table 2.
The staples are either not related to any specific projects or are generic and can be related to a multitude of projects. Since staples belong to many “baskets,” they lay on many network shortest paths and connect nodes that otherwise would probably be disconnected. The shortest paths induced by the staples, increase graph coupling and lower its modularity, thus eroding potential mini-communities. To minimize the influence of the staples, we eliminate, in the spirit of market basket analysis, 5% of the GCC nodes with the highest degrees—that is, 812 nodes with the degree . The product network with the truncated tail is referenced in Table 1 as 5∗.
| Product | Degree | Sales |
|---|---|---|
| wood stud | 1,410 | 3,305 |
| bucket | 1,333 | 3,344 |
| plastic tray liner | 1,049 | 3,078 |
| biodegradable pot | 1,031 | 3,756 |
| seal tape | 986 | 2,491 |
| carbonated drink | 943 | 3,407 |
| adhesive tape | 897 | 2,258 |
| diet soda | 810 | 2,897 |
| flat brush | 715 | 2,241 |
| drywall | 681 | 1,395 |
| tray set | 677 | 2,051 |
| topsoil | 674 | 3,498 |
| vegetable peat pot | 634 | 2,706 |
| insulating foam sealant | 613 | 2,103 |
| plastic bag | 593 | 2,529 |
| latex caulk | 587 | 1,453 |
| garden soil | 586 | 2,753 |
| drinking water | 556 | 2,523 |
| poly roll | 549 | 1,524 |
| contractor trashbag | 549 | 2,057 |
5 Network Structure and Mini-Categories
A visual inspection of reveals rich internal structure of the product network. In particular, we noticed three major types of structural tiles: dense clique-based communities, sparse stars, and linear chains and pendants—and randomly structured connecting matter. Often, the tiles overlap (e.g., a node can be a leaf of a star and a member of a dense community). We propose an automated procedure for the structural tile extraction.
5.1 Tile Extraction
At the pre-processing stage, all small unconnected components (having fewer than five nodes) are removed from the network. The new network has 12,416 nodes and 26,943 edges.
We define an imperfect star as a connected subgraph of that consists of at least four nodes of degree , connected to a common central node. We allow for a modest number () of chords in an -node star, because the graph was constructed through a binarization procedure with an arbitrary chosen threshold and an absence of a connection between two nodes does not imply a zero co-occurrence.
A chain/pendant is a linear sequence of nodes that is connected to anchor nodes at one (pendant) or both (chain) ends. We define an imperfect chain/pendant (a linear tile) as a connected subgraph of that consists of nodes of degree 1 through 3. The nodes of degree 3 introduce defects (chords and mini-stars) but do not significantly distort the linear structure of the subgraphs.
An anchor node is a node that is shared by a linear tile and the rest of . We attached anchor nodes to the incident linear tiles. As a result, we get 5,197 small linear tiles with nodes and 375 large linear tiles with nodes. In the spirit of restricting the size of individual tiles to nodes, we combined the small linear tiles with their larger immediate neighbors.
We used CFinder [5] for the extraction of dense communities. CFinder is based on the Clique Percolation Method: it builds -cliques—fully connected subgraphs of of size —and then computes the union of all -cliques that share nodes pairwise. Clique-based communities have an important advantage over -cliques: they are less rigidly defined and can absorb more potentially related nodes than a clique, thus improving the tile coverage of and reducing the number of required tiles.
We eliminated communities with nodes to be consistent with the previously adopted approach to small tiles.
5.2 Coverage Optimization
As a result of the network decomposition, we constructed 5,035 possibly overlapping tiles of three different types: stars (3,553), dense clique-based communities (1,107), and chains/pendants (375). The union of all tiles contains 12,370 product network nodes, with the average coverage of 2.45 nodes per tile. Table 3 shows the summary of the tile coverage (before and after optimization).
| Tile type | Count | Node Coverage | Mean Size | ||
|---|---|---|---|---|---|
| Original | Optimized | Original | Optimized | Optimized | |
| Stars | 3,553 | 289 | 10,486 | 5,589 | 30 |
| Dense communities | 1,107 | 216 | 5,457 | 8,123 | 47 |
| Pendants/chains | 375 | 313 | 2,065 | 4,278 | 17 |
| Total: | 5,035 | 818 | 12,370 | 12,274 | |
The amount of overcoverage (average number of tiles that a node belongs to) can be reduced by optimizing the coverage, identifying essential tiles, and discarding redundant tiles. For optimization, we chose a variant of a greedy maximum coverage algorithm [13]. We start with an empty set of covering tiles. At each iteration, we select an unused tile that, if added to the coverage set, minimizes the number of uncovered nodes and increases the number of covered nodes. The process stops when no such tile exists.
The optimization reduced the number of essential tiles to 818—16% of the original tile set (see Table 3). Only 142 nodes remained uncovered by any essential tile. As a result, the average number of nodes per tile increased to 15, and the amount of overcoverage was dramatically reduced (Fig. 3).

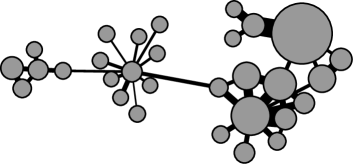
Figure 4 shows the outlines of three randomly selected average-sized sample tiles of each type.


5.3 Mini-Categories
The optimized tile set contains a reasonable number of members and has a good uniformity. The entropy of the tile size distribution for the set is versus for the uniform, homogeneous distribution. The collection of essential tiles forms a good structural basis for further research of customer behavior and customer-driven projects.
From a retailing perspective, different types of structural tiles correspond to different relationships between the products associated with the tile nodes. We call these building blocks mini-communities and suggest that they reflect consumers’ view on the product hierarchy.
A cliques-based community (and especially a generating -clique) is characterized by homogeneity and complete or almost complete connectivity between the nodes. In other words, any product in a community is commonly purchased together with all other products in the community. The products in a community form a topical complementary group [14, 15, 16], e.g., alarms and smoke detectors—elements of home security.
On the contrary, a star is heterogeneous. The nodes in a star form two different groups: the high-degree hub (the lead product) and small-degree spokes (the peripheral products). The lead product is frequently purchased together with one or few peripheral products. However, the peripheral products are never or almost never purchased together. The hub with the peripherals form a group of substitutes [14, 15, 16], e.g., snow removal tools and materials: ice melt bag as the lead and shovels, rock salt, and sand as the peripherals (Figure 4a).
Chains/pendants (linear tiles) are perhaps the hardest mini-category to interpret. They describe a set of products that are almost never purchased together, but often purchased pairwise. An almost perfect example of a chain is shown in (Figure 4c): all products in the tile are zinc wood screws and differ only in length and number (diameter). Most of the screws are #8 and #10. Any two neighbors differ either in diameter (#8 vs. #10) or length, and the difference between the neighbors is always smaller than between any non-neighbors. We hypothesize that a customer buys a pair of items if she is not sure about the precise values of certain attributes (such as screw dimensions). In other words, a linear tile represents substitutes by ignorance, as opposed to substitutes by choice.
6 Conclusion and Future Work
The goal of this research is to pave the road to the automated identification of consumer projects, based on the available retail data. One possible direction that we explored is to deconstruct the product network into structural tiles that correspond to groups of products—mini-categories.
We built a product network from the purchase data provided by a Fortune 500 Specialty Retailer through the Wharton Customer Analytics Initiative (WCAI). A visual inspection of the network revealed three major types of structural blocks: dense clique-based communities, stars, and linear structures (chains and pendants).
We developed a procedure for the automated tile extraction and coverage optimization. As a result, we produced a reasonably uniform in size collection of ca. 800 tiles of all three types that cover the majority of the giant connected component of the product network. We associate each tile type with the nature of the products in the tile: either complements or substitutes.
We believe that the extracted mini-categories represent consumer view on the retail product hierarchy and can be used as an efficient managerial and research tool.
In the future, we plan to study mini-categories as first-class objects, rather than building blocks for possible consumer projects. That way, there will be no need to minimize their count and lump mini-chains into adjacent stars and cliques, thus preserving relative cleanness of the stars and cliques and making them easier to analyze.
We hope that the planned use of structural role extraction algorithms [17] will uncover more tile categories, that, in turn, would yield more retailing-related mini-categories.
Finally, we will look into validating our complement/substitute tile theory using Amazon Mechanical Turk [18] crowdsourcing platform.
Acknowledgments.
The authors would like to thank Wharton Customer Analytics Initiative (WCAI) for the provided data set that made this research possible and an anonymous reviewer for the suggestion to use role extraction algorithms.
References
- [1] Tuli, K. R., Kohli, A. K., Bharadwaj, S. G.: Rethinking Customer Solutions: from Product Bundles to Relational Processes. J. of Marketing, 71 (3), 1–17 (2007)
- [2] Agrawal, R., Imielinski, T., Swami, A.: Mining Association Rules between Sets of Items in Large Databases. In: Proc. of the ACM SIGMOD International Conference on Management of Data, Washington, D.C., pp. 207–16 (1993)
- [3] Forte Consultancy. Product Network Analysis—the Next Big Thing in Retail Data Mining, http://forteconsultancy.wordpress.com/2013/02/19/product-network-analysis-the-next-big-thing-in-retail-data-mining/
- [4] Blondel, V. D., Guillaume, J. L., Lambiotte, R., and Lefebvre, E.: Fast Unfolding of Communities in Large Networks. J. of Statistical Mechanics: Theory and Experiment, vol. 10, p. 10008 (2008)
- [5] Palla, G., Derényi, I., Farkas, I., and Vicsek, T.: Uncovering the Overlapping Community Structure of Complex Networks in Nature and Society. Nature, 435 (7043), 814–818 (2005)
- [6] Kim, H.K., Kim, J.K., Chen, Q.Y.: A Product Network Analysis for Extending the Market Basket Analysis. Expert Systems with Applications, vol. 39, 7403–7410 (2012)
- [7] Xie, J., Kelley, S., Szymanski, B. K.: Overlapping Community Detection in Networks: The State-of-the-Art and Comparative Study. ACM Computing Surveys, 45 (4), 1–37 (2013)
- [8] Raeder, T., Chawla, N.V.: Market Basket Analysis with Networks. Social Network Analysis and Mining, 1 (2), 97–113 (2011)
- [9] Coscia, M., Giannotti, F., Pedreschi, D.: A Classification for Community Discovery Methods in Complex Networks. Statistical Analysis and Data Mining, 4 (5), 512–46 (2011)
- [10] Pennacchioli, D., Coscia, M., Pedreschi, D.: Overlap versus Partition: Marketing Classification and Customer Profiling in Complex Networks of Products. In: 2014 IEEE 30th International Conference on Data Engineering Workshops (ICDEW), pp. 103–110, IEEE (2014)
- [11] Videla-Cavieres, I. F., Ríos, S. A.: Extending Market Basket Analysis with Graph Mining Techniques: a Real Case. Expert Systems with Applications, 41 (4), 1928–1936 (2014)
- [12] A Wharton Customer Analytics Initiative dataset provided by a Fortune 500 Specialty Retailer (2014)
- [13] Johnson, D.S.: Approximation Algorithms for Combinatorial Problems. J. Comput. Syst. Sci., 9 (3), 256–278 (1974)
- [14] Brijs, T. et al.: Building an Association Rules Framework to Improve Product Assortment Decision. Data Mining and Knowledge Discovery, 8, 7–23 (2004).
- [15] Lattin, J.M., McAlister, L.: Using a Variety-Seeking Model to Identify Substitute and Complementary Relationships among Competing Products. J. of Marketing Research, 22 (3), 330–339 (1985)
- [16] Elrod, T. et al.: Inferring Market Structure from Customer Response to Competing and Complementary Products. Marketing Letters, 13 (3), 221–232 (2002)
- [17] Henderson, K. et al.: RolX: Structural Role Extraction and Mining in Large Graphs. In: Proc. of the 18th ACM SIGKDD International Conference on Knowledge Discovery and Data Mining, pp. 1231–1239, ACM (2012)
- [18] Buhrmester, M., Kwang, T., Gosling, S.D.: Amazon’s Mechanical Turk: A New Source of Inexpensive, yet High-Quality, Data? Perspectives on Psychological Science, 6, 3–5 (2011)