The Outer Stellar Populations and Environments of Unusually HI-rich Galaxies
Abstract
We investigate the nature of HI-rich galaxies from the ALFALFA and GASS surveys, which are defined as galaxies in the top 10th percentile in atomic gas fraction at a given stellar mass. We analyze outer () stellar populations for a subset of face-on systems using optical versus colour/colour diagrams. The results are compared with those from control samples that are defined without regard to atomic gas content, but are matched in redshift, stellar mass and structural parameters. HI-rich early-type () and late-type () galaxies are studied separately. When compared to the control sample, the outer stellar populations of the majority of HI-rich early-type galaxies are shifted in the colour/colour plane along a locus consistent with younger stellar ages, but similar metallicities. The outer colours of HI-rich late-type galaxies are much bluer in than the HI-rich early types, and we infer that they have outer disks which are both younger and more metal-poor. We then proceed to analyze the galaxy environments of HI-rich galaxies on scales comparable to the expected virial radii of their dark matter halos ( kpc). Low mass () HI-rich early-type galaxies have galaxy environments that differ significantly from the control sample. HI-rich early types are more likely to be central rather than satellite systems. Their satellites are also less massive and have younger stellar populations. Similar, but weaker effects are found for HI-rich late-type galaxies of the same mass. In addition, we find that the satellites of HI-rich late-types exhibit a greater tendency to align along the major axis of the primary. No environmental differences are found for massive () HI-rich galaxies, regardless of type.
keywords:
galaxies: formation; galaxies: ISM; galaxies: stellar content1 Introduction
Recent targeted HI surveys of representative samples of galaxies selected by stellar mass (Catinella et al 2010; 2013) have demonstrated that galaxies like our own Milky Way span a broad range in atomic gas mass fraction. The median HI mass fraction for galaxies with stellar masses of 4-5 is , but 10% of galaxies in this mass range have gas fractions that are more than three times higher (Kauffmann et al 2012; Lemonias et al 2013).
Galaxies that are significantly more gas-rich than average are extremely interesting for further study. If the atomic gas is able to reach high enough densities and metallicities to become shielded from the ambient UV radiation field, it will form and from there, molecular clouds and stars. Atomic gas may thus be regarded as a “reservoir” for future star formation in a galaxy. By studying HI-rich systems, we gain significant insight into the way in which galaxies grow in mass at the present day.
By comparing the colour profiles of large samples of HI-rich galaxies drawn from the wide-field ALFALFA survey (Giovanelli et al 2005) to those of normal spirals, we learned that gas-rich galaxies have unusually blue outer disks (Wang et al 2011). Follow-up spectroscopy demonstrated that H emission was strong in these regions and that the ionized gas metallicities frequently exhibited strong drops beyond the optical radius (Moran et al 2010; 2012). Analysis of the ratio of star formation rate to stellar mass surface densities as a function of radius demonstrated that most of the present-day growth in HI-rich galaxies occurs in their outskirts. These results have recently been confirmed by independent studies (Huang et al 2014).
We then undertook a follow-up program to map the HI in a small sample of 25 unusually HI-rich galaxies and 25 “control” galaxies with normal HI content using the Westerbork Synthesis Radio Telescope (WSRT; Wang et al 2013, 2014). The incidence of galaxies with disturbed HI morphologies was slightly lower in the HI-rich sample than in the control sample, strongly arguing against a scenario in which the extra HI gas had been recently added by a significant merging event. The main distinguishing characteristic of the HI-rich galaxies was the very large radial extent of the HI in comparison to the optical light. In addition, there was tentative evidence that the outer HI gas was more clumpy/irregular in HI-rich galaxies than in the control sample.
In this paper, we extend our work on HI-rich galaxies by studying their outer stellar populations in more detail, as well as their environments on scales of 20-500 kpc. We extract the largest available sample by combining the latest public release from the ALFALFA survey (the alpha.40 catalog; Haynes et al 2011) with the final data release from the GASS survey (Catinella et al 2013). As in previous papers, we focus our attention on galaxies with stellar masses greater than . We divide this sample into two classes: a) Galaxies that are structurally “early-type” in that they have have concentrated light profiles, indicative of galaxies with large bulge-to-disk ratios, b) Galaxies that are structurally “late-type” in that they have extended light profiles indicative of disk-dominated systems. The stellar populations and environments of the 10-25% most HI-rich systems are then compared with galaxies of the same mass and structural type drawn from the full Sloan Digital Sky Survey data release 7 (DR7; Abazajian et al 2009).
The paper is divided into two parts. In the first part, we address the question of what can be learned about stellar populations using available SDSS photometry. We discuss previous work on the colour profiles of disk galaxies and ellipticals, and then show how unusually HI-rich galaxies of both types compare with the parent samples. In the second part of the paper, we examine whether HI-rich galaxies are more likely to be central or satellite galaxies in their halos. We also analyze the stellar masses, star formation rates and orientations of the galaxies in the vicinity of the HI-rich systems and analyze whether any systematic difference is seen with respect to control samples.
2 Stellar populations
2.1 Colour profiles of spiral and elliptical galaxies: background
The existence of colour gradients in both spiral and elliptical galaxies has been known for more than 50 years (e.g. Tifft 1963). In the 1970’s, astronomers began to image galaxies at near-IR wavelengths for the first time. One of the important motivations for near-IR surveys was to break the degeneracy of the UBV colour-system in distinguishing whether age or metallicity effects drive basic scaling relations, for example the relation between galaxy colour and velocity dispersion. Strom et al (1976) used the V-K radial colour profiles of 5 elliptical and S0 galaxies to derive metallicity gradients and compared them with the model predictions of Larson & Tinsley (1974). Aaronson, Huchra & Mould( 1979) and Terndrup et al (1994) emphasized the importance of dust extinction when interpreting radial colour trends in galactic disks.
The most recent work on colour gradients in nearby galaxies has involved statistical studies of much larger samples. The Sloan Digital Sky Survey (York et al 2000) provided very uniform 5-band photometry for millions of galaxies across a quarter of the sky and has served as the underlying data set for most of these. Tortora et al (2010) derived colour gradients for 50,000 galaxies with redshifts . They found stronger gradients for low mass galaxies than high mass galaxies. Suh et al (2010) studied colour gradients for a large sample of early-type galaxies. They found that the majority of early-types have flat colour profiles. 11 percent of the sample exhibited negative colour gradients (i.e. bluer colours on the outside), while 4 percent were “blue core” systems with positive gradients. Gonzalez-Perez, Castander & Kauffmann (2011) showed that if galaxies were split into early and late-type classes at a -band concentration index on 2.6, there was no longer a significant dependence of colour gradient on stellar mass for each type (i.e. the trend with mass found by Tortora et al was driven by an increasing early-type fraction among more massive galaxies). The SDSS survey has also been used to study the colour gradients of rare galaxy types. Roche, Bernardi & Hyde (2010) compared the colour profiles of brightest cluster galaxies with those of ordinary ellipticals and SOs and found that they were flatter on average. We note that most studies of colour gradients using SDSS have been confined to a single colour (most often or ).
2.2 Two-colour profiles of HI-rich galaxies compared to the underlying population
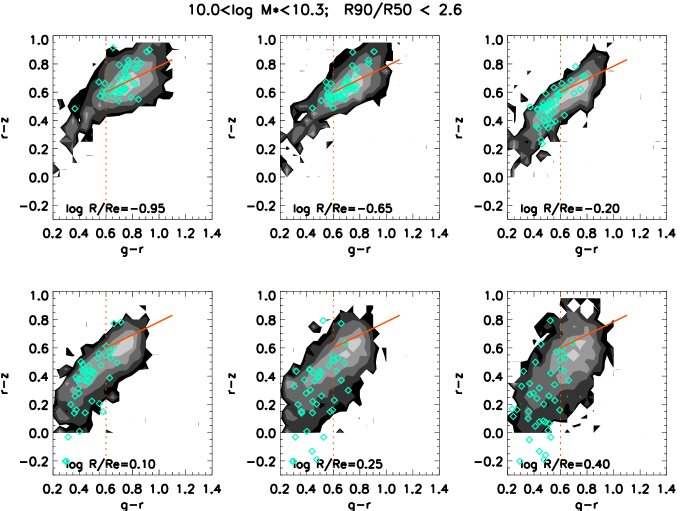
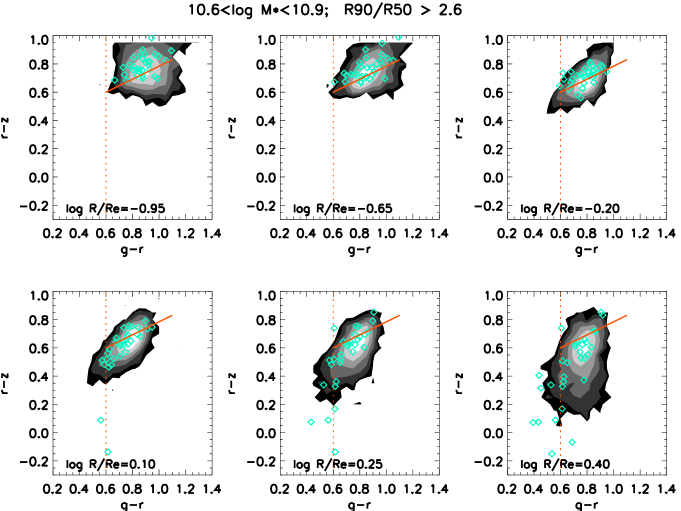
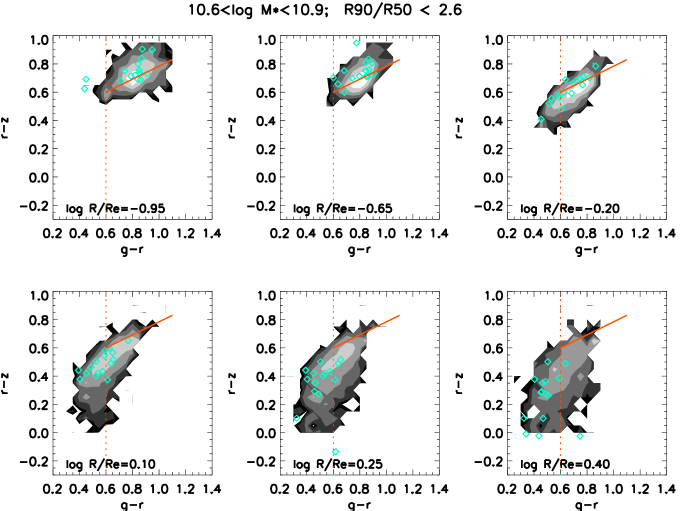
In figures 1-4, we show a series of versus colour-colour diagrams. In each figure, the the 6 panels show the colours of galaxies at a fixed radius normalized to the radius , defined as the radius containing half the total r-band luminosity of the galaxy. The radii plotted range from one tenth to 2.5 . The SDSS photometry is not deep enough to extract colours at radii larger than this for individual galaxies.
Figure 1 shows results for early-type galaxies in the mass range , while Figure 2 shows results for late-type galaxies in the same mass range. We divide galaxies into early/late-type using a simple cut on the -band concentration index of 2.6, where is defined as the ratio of the radii enclosing 90% and 50% of the total band light from the galaxy. Shimasaku et al (2001) have shown that this cut can separate galaxies that are visually classified as E/S0/Sa from later-type spirals and irregulars with reasonable accuracy. Figures 3 and 4 are the same as Figures 1 and 2, except that they show galaxies in the mass range .
In each figure, the grey-scale contours show the location of the general population of galaxies in versus colour/colour space. These contour plots are constructed as follows:
-
1.
From the data release 7 (DR7) of the Sloan Digital Sky Survey, we select all spectroscopically-targeted galaxies with redshifts in the range and with stellar masses greater than . The stellar masses are taken from the the MPA/JHU value-added catalogue (http://www.mpa-garching.mpg.de/SDSS/DR7/). We discard galaxies that are highly inclined with axial ratios in order to minimize the effects of dust extinction on our analysis.
-
2.
The SDSS photometric pipeline extracts azimuthally averaged radial surface brightness profiles for all the objects in the survey. In the catalogs, this is given as the average surface brightness in a series of annuli with fixed angular dimension, which we then interpolate onto a fixed grid in units of . We discard the outer annuli in which the errors on the or colours are greater than 0.2. 111This corresponds to a 20% error on the colour, which may seem rather large. We note that will mostly be concerned with relative comparisons between different sub-samples at fixed radius in this section. In section 2.4, where we attempt to interpret the colours in terms of physical parameters, we will create higher estimates of outer colours.
-
3.
The contours indicate the stellar mass-weighted fraction of the galaxy population with and colours in a given range. We bin the versus colour/colour plane into cells of size . Each galaxy is weighted by , its mass, and , the inverse of the volume over which it is found in our sample. Our chosen contours are spaced a factor 2.5 apart in mass fraction, i.e. the lowest (black) contour corresponds to a factor 244 lower mass-weighted fraction than the highest (white) contour.

The main two-colour trends can be summarized as follows:
On average, early-type galaxies exhibit weak gradients in both and colours. The peak of the distribution shifts from at 0.1 to at 2.5, while changes from 0.7 to 0.6. As noted by Suh et al (2010), a minority of early-type galaxies have significantly bluer outer regions. In our plots, it can be seen that the blue tail is much more prominent in than it is in , but as we will show later, at least part of this is due to larger errors on the colours at large radii.
Comparison of Figures 1 and 3 shows that more massive early type galaxies exhibit less scatter in their central colours and have weaker colour gradients. The shift in colour from 0.1 to 2.5 is 0.1 for ellipticals compared to 0.17 for ellipticals that are 4 times more massive. However, colour gradients do not appear to vary with stellar mass.
As seen in Figure 2, the central colours of late-type galaxies are spread much more widely than those of early-type galaxies. As radius increases, the mass weighted fraction of galaxies in the very blue part of the versus colour plane increases. Interestingly, however, the location of the peak of the colour-colour distribution remains very nearly fixed with radius.
Comparison of Figures 2 and 4 show that massive late-type galaxies exhibit significantly smaller dispersion in colour in their central regions than their less massive counterparts. However, and colour gradients appear to be stronger for more massive late type galaxies. At radii , the colours of low mass late-types exhibit a peak in the range 0.7-0.8, i.e. at relatively red colours. This red peak is not found in the high mass late-type sample. Likewise, there are no massive late-type galaxies with colours greater than 0.65 in their very outer regions, whereas a fair number exist in the low mass sample.
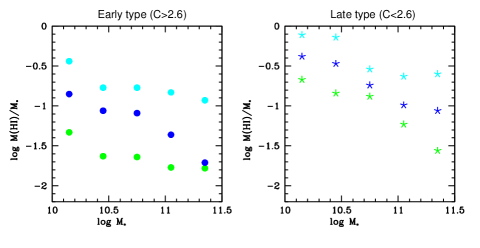
Cyan symbols in Figures 1-4 show the locations of HI-rich galaxies in versus colour-colour space. Our HI-rich sample is constructed by combining the final data release of the GALEX Arecibo SDSS Survey (GASS; Catinella et al 2013) with the alpha.40 HI Source Catalog from the Arecibo Legacy Fast ALFA Survey (Haynes et al 2011). GASS is designed to reach a limiting HI mass fraction of between 1.5 and 3% for galaxies with and thus can be used to define our HI-rich sample. In Figure 5, we plot plot 50th, 75th, and 90th percentiles of the distribution of M(HI)/ as a function of stellar mass for early-type galaxies with concentration index and for late-type galaxies with . This plot is constructed using the GASS DR3 “representative sample”, which samples the M(HI)/M∗ distribution in each stellar mass in an unbiased way (see Catinella 2010; 2013 for details). Note that more than half of early-type galaxies with masses greater than are not detected in HI. For these galaxies, the median value of M(HI)/ is plotted at the value of the upper limit, correpsonding to a HI mass fraction of 0.015. This is an over-estimate of the true median value. This will not concern us here, because we define HI-rich galaxies as those with HI mass fractions that lie above the 90th percentile points shown as filled cyan circles in the two panels. As can be seen, the 90th percentile points span gas fractions in the range 0.1-0.3 for early-type galaxies and 0.3-1 for late-type galaxies.
It is immediately clear that HI-rich galaxies are almost always displaced towards the blue region of colour-space when compared to the underlying population. A closer examination of Figures 1-4 reveals, however, that the nature of the displacement depends on radius, on galaxy mass, and on morphological type. HI-rich early-type galaxies with low masses have bluer colours in their inner regions (), but this is not seen for HI-rich early-type galaxies with high masses. Both low and high mass HI-rich late-type galaxies become significantly bluer than the underlying population in at . The colours of both early-type and late-type HI-rich galaxies with low stellar masses are not noticeably displaced from the underlying population at . At larger radii, there is increasing scatter in colour towards the blue. In section 2.4, we will come back to whether this effect is real or simply a reflection of increasing photometric errors in the lower surface brightness outer regions of the galaxy. Finally, we note that the colours of both early-type and late-type HI-rich galaxies with high stellar masses are displaced to slightly redder values in their central regions. Once again, we find large scatter to bluer colours at large radii.
2.3 Interpretation of versus colour/colour diagrams in terms of stellar population parameters
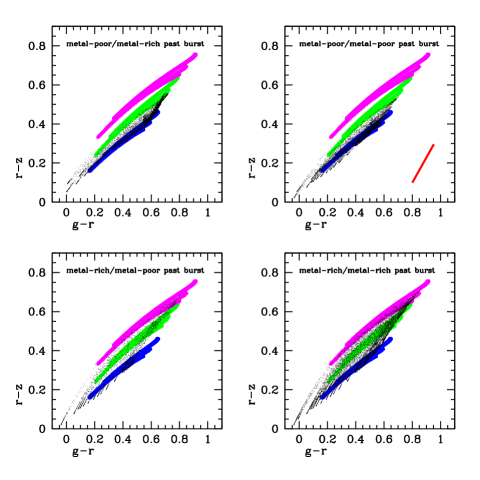
The combination of optical and optical/infrared colours has been used a way of estimating stellar ages and metallicities in both spiral and elliptical galaxies (Bell & De Jong 2000; MacArthur et al 2004; Tortora et al 2010). These methods are only likely to yield accurate answers if the star formation histories of galaxies have been smooth rather than bursty, and if there is very little dust. These limitations are illustrated in detail in Figure 6, where we show the predicted locations of galaxies with different star formation histories in the versus colour-colour plane using the population synthesis models of Bruzual & Charlot (2003).
The coloured tracks indicate the location of galaxies that have had smooth star formation histories of the form SFR , where ranges from 0.1 to 100 Gyr. Three different look-back times for star formation to commence are adopted: 13, 6 and 3 Gyr. Different colours indicate different metallicities: magenta corresponds to 1.5 solar, green to 0.5 solar and blue to 0.1 solar. As can be seen, models of differing age, but the same metallicity, occupy very narrow loci in the versus plane. Under the assumption of smooth star formation histories and no dust, galaxies with different stellar metallicities can be separated quite easily if their colours can be measured accurately enough.
If galaxies have experienced bursts of star formation in their recent past, the situation becomes significantly more complicated. The four different panels in Figure 6 show four different possibilities. In the top-left panel we show what happens if a metal-rich burst is superposed on a smooth metal-poor model, while the bottom left panel shows the opposite case of a metal-poor burst superposed on a metal-rich model. The top and bottom-right panels show the cases of metal-poor burst with metal-poor , and metal-rich burst with metal-rich , respectively. In all cases, “metal-rich” corresponds to metallicities between solar and 1.5 solar, while “metal-poor” corresponds to metallicities between 0.1 and 0.25 solar. The bursts are allowed to begin at look-back times ranging from 2 Gyr to 0.1 Gyr past and last for 0.1 Gyr. Between 1% and 90% of the total mass of the galaxy is allowed to form in the burst.
As can be seen, the power of the colour to differentiate metallicity can be compromised by bursts. Superposing a metal-rich starburst on a metal-rich model can lead to and colours that overlap the locus of models with 0.1 solar metallicity. Our experiment of superposing different model star formation histories leads to the following general conclusion: if, in the absence of dust, the colour of a galaxy is red, then the galaxy is metal-rich. However, the opposite does not necessarily hold. If the colour is blue, then the galaxy may be metal poor, or it may have undergone a recent burst of star formation.
The effect of dust on the versus colours is illustrated by the red vector plotted in the bottom-right corner of the top-right panel in Figure 6. We adopt a standard Milky Way extinction law (Cardelli, Clayton & Mathis 1989) and the length of the vector corresponds to (V)=0.5 mag and R(V)=3.1. 222The choice of extinction law makes almost no difference to the orientation of the vector in the versus plane. Extinction will move galaxies away from the loci defined by the dust-free models in the sense of causing them to have redder-than-predicted colours at a given metallicity.
2.4 Application to outer stellar populations
Given the complications discussed in the previous section, we do not attempt a detailed quantitative analysis of age or metallicity trends as a function of radius in galaxies in this paper. However, the strong trend towards bluer outer and colours in the galaxy population as a whole, and in in HI-rich galaxies in particular, is worthy of further analysis. The outer regions of galaxies viewed face-on are sites where one might reasonably conjecture that neither recent bursts of star formation nor dust play a significant role.
One question that arises is the extent to which the “blue tails” seen in the outer radii in Figures 1-4 are simply due to increasing errors in the measured colours at large radii. In particular the SDSS -band photometry has lower signal-to-noise than the and -band photometry, so the colours will exhibit greater spread simply due to photometric errors. To answer this, we construct a higher estimate of outer colour for each galaxy by binning together the light from radii larger than . We select the subset of galaxies with errors on both their and outer colours of less than 0.04 and plot these in Figure 7 on top of our grid of models. The left panels show results for early-type galaxies, while the right panels show results for late-type galaxies. We have added a yellow track, indicating the location of single stellar population (SSP) models of 0.01 solar metallicity. The yellow track may be regarded as a theoretical lower limit to the allowed range of colours at a given value of . 333We have compared the low metallicity SSPs from the Bruzual & Charlot (2003), Maraston (2005) and Conroy, Gunn & White (2009) models and find that they all yield comparable results. As can be seen, even though the 0.01 solar SSP models are very blue in , there is almost no difference in at fixed colour compared to the 0.1 solar models. This means that stellar populations with metallicities below 0.1 solar can no longer be clearly distinguished in this diagram.
The red dashed lines in the top panels of Figure 7 show our chosen demarcation line for galaxies that are “unusually blue” in outer colour. Our demarcation line is chosen to pass through the 0.1 solar model track. Galaxies lying below this line are plotted as cyan coloured points, while those lying above the line are plotted as black points. Around 10% of both early-type and late-type galaxies are included in the “unusually blue” sub-sample. In the bottom panels, we plot the same galaxies in the plane of 4000 Å break strength (Dn(4000)) versus stellar surface mass density. The 4000 Å break strength is a relatively clean measure of the age of the central stellar population of the galaxy within the 3 arcsecond diameter fibre aperture. Because the index is defined over a very narrow range in wavelength, it is insensitive to dust extinction. The stellar surface mass density is defined as , where is the half-light radius of the galaxy. As can be seen, early-type galaxies with unusually blue outer colours have central stellar population ages and densities that are indistinguishable from the underlying population. Late-type galaxies with unusually blue outer colours have similar central ages to the underlying population, but are shifted to lower mass densities by a factor of 3 (implying that at fixed stellar mass, their half-light radii are a factor of 1.7 larger). These differences are quantified in more detail in Figure 8, in which we show histograms of Dn(4000) and log for the two samples.
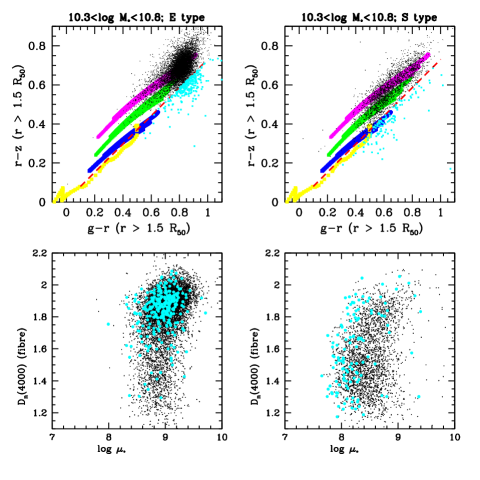
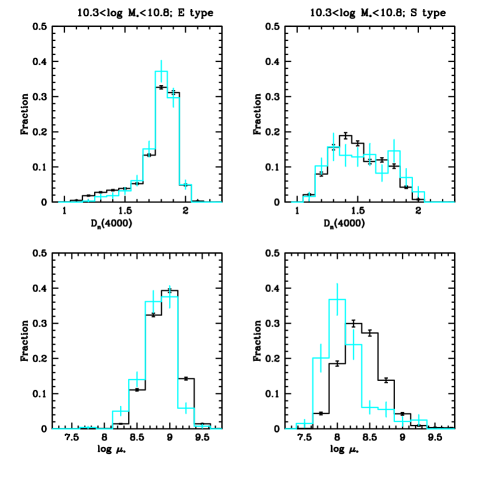
If we interpret galaxies lying below the red dashed lines in Figure 7 as having metal-poor outer-stellar populations, then the results in Figure 8 show that early-type galaxies with metal-poor outer stellar populations have central stellar mass densities and ages that are indistinguishable from the early-type galaxy population as a whole. Late-type galaxies with metal-poor outer stellar population also have central stellar population ages that are indistinguishable from other late-type galaxies, but they have significantly lower stellar densities than the parent population.
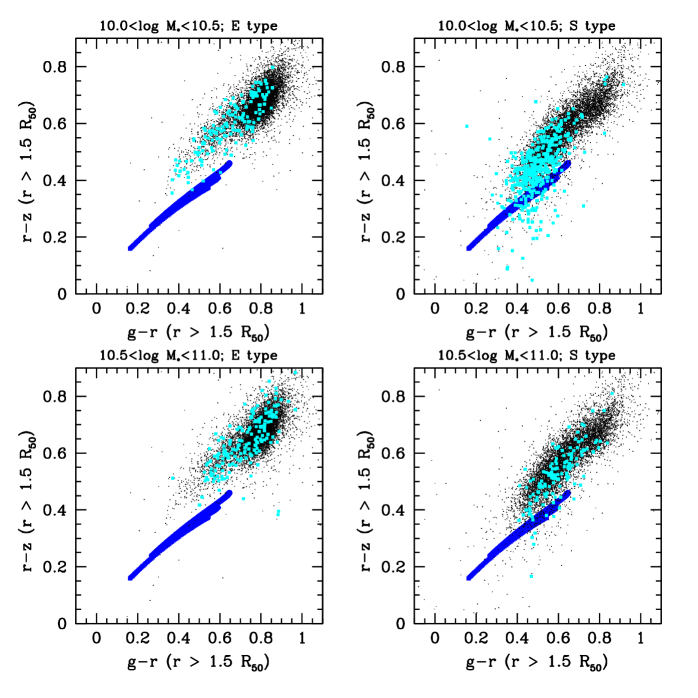
Catinella et al (2010) show that the HI mass fraction in galaxies is strongly correlated with stellar density in addition to UV/optical colour. In Figure 9, we plot the outer () versus colours of HI-rich galaxies on top of the parent population. To increase our HI-rich sample statistics, we include all galaxies in the upper 25th percentile of HI gas mass fraction and with colour errors less than 0.08. The blue points indicate the locus of continuous models with 0.1 solar metallicity for reference. Results are shown for two stellar mass ranges: and .
As can be seen, the outer stellar populations of HI-rich early-type galaxies in the lower mass bin lie along a track in the versus colour/colour diagram consistent with younger ages but metallicities that are the same as the outer stellar populations of the parent population. We infer that if the extra HI gas in these systems is of external origin, it must have been accreted at high metallicity. We also note that there are only a few HI-rich early-type systems that overlap the unusually blue population plotted in cyan in the left panels of Figures 7 and 8. The early-type galaxies with the bluest outer colours in Figures 1 and 3 have have errors on their colour measurements that are too large to allow them to be included in this sample. In contrast, the outer stellar populations of low-mass HI-rich late-type galaxies are shifted to both younger ages and lower metallicities. The shift in metallicity is largest for the HI-rich galaxies with the youngest outer disks. The most extreme amongst these systems have estimated stellar metallicities at of a tenth solar or less. 444We note that the scatter below the tenth solar track is consistent with the typical error on the outer colour The shifts in colour for the high mass HI-rich galaxies are very much weaker. In particular, the high-mass HI-rich early-types display no colour offsets at all.
3 Dark matter halo-scale environments of unusually HI-rich galaxies
In this section we compare the environments of HI-rich galaxies to the underlying population. We focus on scales less than 500 kpc, roughly corresponding to the predicted virial radii of the dark matter halos that host galaxies.
The influence of environment on atomic gas in galaxies has been studied in the past using two main methods: 1) In wide-field surveys such as HIPASS (Barnes et al 2001) or ALFALFA (Giovanelli et al 2005), it is possible to compute the auto-correlation function of HI-selected galaxies and compare this to the auto-correlation function of optically-selected galaxies (Passmoor et al 2011; Martin et al 2012; Papastergis et al 2013). These studies find that HI-selected galaxies cluster very weakly, with a clustering length = 3.3 h-1 Mpc, and are more strongly anti-biased with respect to the dark matter distribution on small scales compared to large scales. 2) There have also been studies focusing on the HI properties of galaxies in clusters (Giovanelli & Haynes 1985; Kenney & Young 1989; Solanes et al 2001; Chung et al 2009), showing that HI has been removed from the disks of spirals in the central regions of clusters by processes such as ram-pressure stripping or tidal interactions. In recent work, Catinella et al (2013) cross-correlated GASS galaxies with the updated SDSS galaxy group catalogue of Yang et al (2007) and showed that galaxies in halos with estimated virial masses greater than are gas-deficient compared to galaxies in lower mass halos.
We note that these past studies have almost exclusively probed physical processes leading to the removal of atomic gas from galaxies in dense environments such as clusters and groups. This is true also for the correlation function studies, because the amplitude on small scales scales ( Mpc) is simply proportional to the square of the galaxy density within individual dark matter halos. In this paper, we take a different approach and study environment in a way that is designed to probe possible gas accretion processes in HI-rich galaxies. Our analysis focuses on whether HI-rich galaxies of different stellar masses and morphological types are more likely to be central or satellite systems within their dark matter halo. We also analyze not only the number of satellites around HI-rich galaxies, but also properties such as their stellar masses and the ages of their stellar populations. Finally, we look at whether the satellites of HI-rich galaxies display any preferred orientation with respect to the major axis of the primary (the so-called Holmberg effect).
3.1 Central and satellite properties
In a redshift survey, there is no completely accurate way of separating galaxies into those that reside at the centers of their dark matter halos (so-called central galaxies) and those that are satellite systems gravitationally bound to a more massive central object. We adopt a simple definition used in previous analyses (e.g Kauffmann et al 2012) whereby a galaxy is classified as central if it has stellar mass larger than all its neighbours within a projected radius of 500 kpc with velocity difference 500 km/s. It is also classified as a central if no neighbours are found within this volume. A galaxy is classified as a satellite if it has a more massive neighbour within kpc and 500 km/s. In this paper, we add an addition class of “binary” galaxies, defined that those with a neighbour within a factor of two of their own stellar mass.
Our HI-rich sample is constructed as described in the previous section, except that for the environmental analysis we include all galaxies regardless of their inclination. For every HI-rich galaxy, we select a sample of 10 “control” galaxies, randomly drawn from the DR7 spectroscopic catalogue. The control galaxies are chosen to match the HI-rich galaxy to within 0.2 dex in log , 0.2 dex in log , 0.01 in redshift, and 0.2 in axial ratio. The environmental properties of the HI-rich sample are then analyzed relative to the control sample, which is selected without regard to atomic gas fraction.
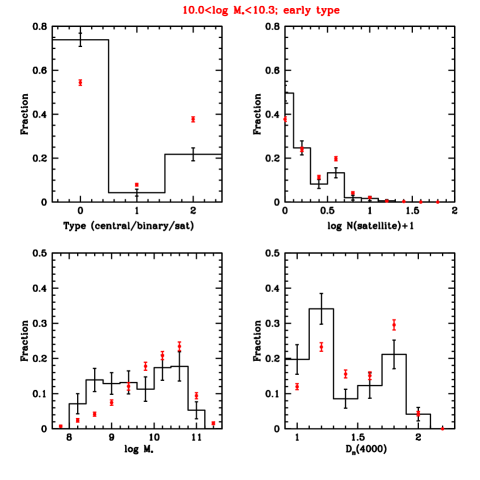
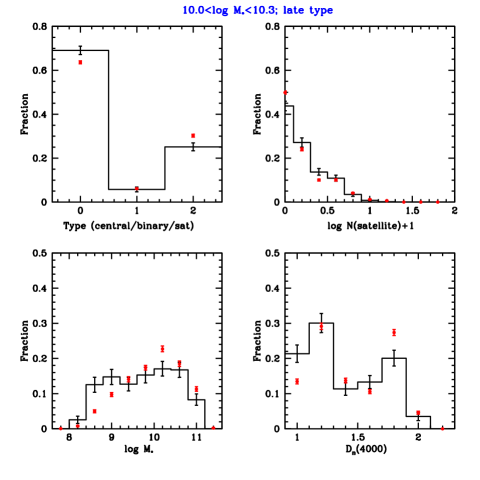
In Figures 10 and 11, we show results for early and late-type HI-rich and control galaxies with stellar masses in the range . In the top panels, we plot the fraction of galaxies classified as central/satellite/binary and the distribution of the number of neighbours with kpc and km/s. In the bottom panels we plot the stellar mass and 4000 Å break strength distributions of the satellites. Black histograms show results for the HI-rich galaxies, while red points show results for the control sample, which is 10 times larger in size. Error bars are computed by boot-strap resampling both samples.
Interestingly, environmental differences between HI-rich galaxies and the control sample are much more apparent for early-type galaxies than for late-type galaxies. The fraction of HI-rich early-type galaxies that are centrals is 0.75, compared to 0.55 for the control sample. Their satellite populations consists of lower mass galaxies with younger stellar populations. Similar differences are found for HI-rich spirals, but the effect is somewhat weaker.
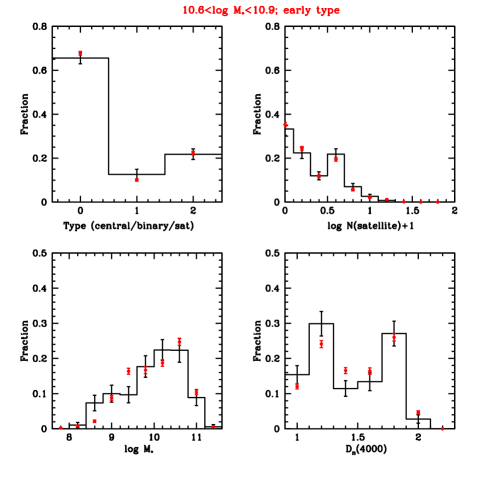
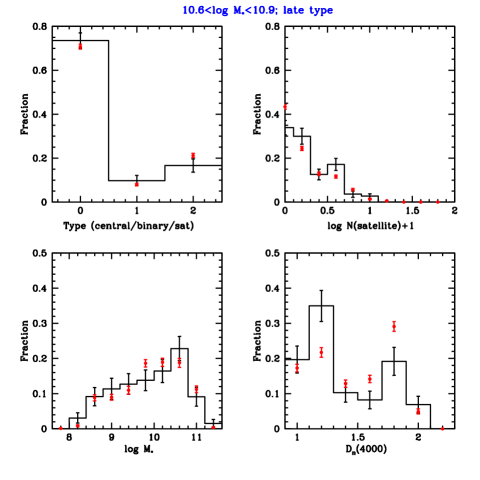
Figure 12 and 13 are the same as figures 10 and 11, except for HI-rich and control galaxies with stellar masses in the range . Here we see no difference between the environments of HI-rich early-type galaxies and the control sample. There is a weak tendency for the satellites of massive HI-rich spirals to have younger stellar populations compared to the control sample, but otherwise the two samples are identical in terms of central/satellite fractions and the number and stellar mass distributions of neighbours.
3.2 Holmberg effect
In 1969, Holmberg wrote a paper claiming that satellite galaxies were preferentially located along the minor axis of disk galaxies. Zaritsky et al (1997) found a similar result for a sample of isolated spirals , but more recent studies have led to different conclusions. The most recent studies using large samples drawn from redshift surveys such as 2dF and SDSS find that satellite alignments occur along the major axis of the primary (Brainerd 2005; Yang et al 2006). In addition, alignments are are strongest for massive red galaxies (Yang et al 2006; Faltenbacher et al 2007, 2009). The standard explanation for satellite alignment effects is that they occur as a result of the large-scale tidal field and the preferred accretion of matter along filaments in the large-scale distribution of galaxies. Theoretical support for this scenario comes from studying the origin of alignment effects between dark matter halos in N-body simulations (Li et al 2013). The most massive red galaxies are predicted to be located at the centers of the most massive dark matter halos, where accretion of stellar material from infalling satellites occurs frequently, even at the present day (e.g. Oser et al 2010). Alignment effects are thus expected to be strong for these systems.
It is thus interesting to consider whether alignments can be used as a probe of gas accretion processes. Accretion of new gas onto galaxies is thought to occur in two main “modes”: a) a so-called cold mode, where new gas is accreted along filaments that trace the large-scale galaxy distribution, b) a so-called hot mode, where new gas is accreted from a spherically symmetric halo of gas in hydro-static equilibrium with the surrounding halo (White & Frenk 1991; Keres et al 2005). The theoretical expectation is that low mass galaxies in low mass dark matter halos accrete gas in the cold mode, while high mass galaxies in high mass halos accrete gas in the hot mode.
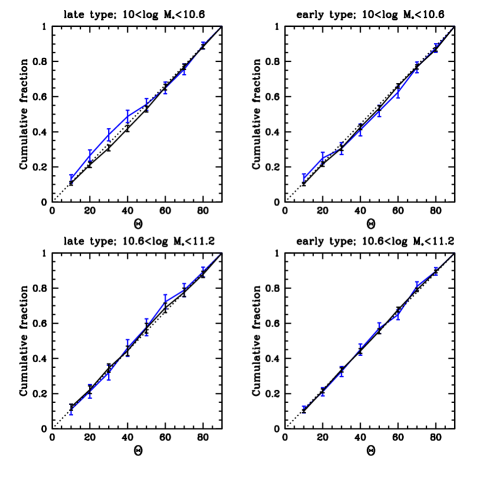
In this section, we study whether the satellite galaxies of HI-rich galaxies exhibit preferred alignments with respect to the primary. We construct the distribution of the angle between the major axis of the primary and the line connecting the primary to the satellite. thus ranges from 0 to 90 degrees, with corresponding to alignment along the major axis. In Figure 13, we plot the cumulative distribution of for early and late-type HI-rich primaries in two different mass ranges and compare this to the distribution obtained for the control samples. We find that only the satellites of HI-rich galaxies in the low stellar mass bin() exhibit a significant major axis alignment effects. All the other HI-rich samples and all four control samples yield a null result 555The fact that we get a null result for the massive early-type galaxy samples is not surprising, given that we have imposed a stringent isoluation criterion on these systems, thereby elimating the majority of galaxies in the most massive dark matter halos. . We note that we have experimented with changing the radius and the velocity difference within which a galaxy must fall to be included as a satellite, and we find that alignment effects get stronger for smaller values of and . The results in Figure 13 show results for 250 kpc and 500 km/s, which represents a compromise between the strength of the signal and the number of satellites included in the sample.
4 Summary and Conclusions
In this paper, we have investigated the nature of HI-rich galaxies in more detail than in previous published work by analyzing their outer stellar populations using optical versus colour/colour diagrams, and by studying spectroscopically identified neighbours within a radius of 500 kpc. All our results are compared with those from control galaxy samples that are defined without regard to atomic gas content, but are matched in stellar mass, redshift, and structural parameters such as concentration and size. We restrict the analysis of outer colours to galaxies with axial ratios and and we study HI-rich early-type () and late-type () galaxies separately.
The outer stellar populations of HI-rich early-type galaxies are shifted with respect to control samples along a locus in the colour/colour plane consistent with younger stellar ages, but similar metallicities. The outer stellar populations of HI-rich late-types are shifted much more to the blue in the direction, and we infer that they have outer disks which are both younger and more metal-poor. The most extreme of these systems have outer disks with inferred metallicities below one tenth solar. The outer colour shifts are stronger for HI-rich galaxies with lower masses. No outer colour shifts are seen for HI-rich early-type galaxies with stellar masses greater than . This may indicate that the HI disks of these systems form stars less efficiently (so-called “morphological quenching”; Martig et al 2009).
We also analyze the galaxy environments of HI-rich galaxies on scales comparable to the expected virial radii of their dark matter halos ( kpc , km/s). Low mass () HI-rich early-type galaxies have galaxy environments that differ very significantly from the control sample. HI-rich early types are more likely to be central rather than satellite systems. Their satellites are also less massive and have younger stellar populations. Similar, but weaker effects are found for HI-rich late-type galaxies of the same mass. In addition, we find that the satellites of HI-rich late-types exhibit a greater tendency to be aligned along the major axis of the primary. No environmental differences are found for massive () HI-rich galaxies, regardless of type.
Our main motivation for studying HI-rich galaxies is that they might serve as laboratories for studying ongoing galaxy growth at the present day. The most important new insight from the current study is that the way in which the build-up of stellar mass in the outer regions of the galaxy is manifested, depends on both galaxy morphology and mass. In addition, the association of HI-richness with differing galaxy environments for low mass systems, but not for high mass systems, hints that different accretion mechanisms may be at work in galaxies of different mass, as predicted by currently popular models of galaxy formation.
We caution once again that broad-band photometry is a rather blunt tool in the analysis of stellar populations. Much more can be learned if spectroscopy is available. The effect of bursts on stellar age determinations can be accounted for using the combination of the 4000 Å break strength and Balmer absorption lines (Kauffmann et al 2003, 2014). Because these stellar age indicators span a very narrow wavelength range, they are relatively insensitive to the effects of dust. Finally, it is also possible to constrain not only metallicity, but also element abundance ratios (Thomas, Maraston & Bender 2003; Conroy, Graves & Van Dokkum 2014) and possibly the stellar initial mass function. Next generation integral field unit (IFU) spectroscopic surveys of tens of thousands of galaxies will enable statistical studies of the spectroscopic properties of the outer stellar populations of galaxies for the first time. Next generation wide-field HI surveys will obtained resolved maps of the atomic gas in galaxies, allowing us to understand the processes governing star formation and chemical enrichment in disks in considerably more detail.
References
- Aaronson, Huchra, & Mould (1979) Aaronson M., Huchra J., Mould J., 1979, ApJ, 229, 1
- Abazajian et al. (2009) Abazajian K. N., et al., 2009, ApJS, 182, 543
- Bell & de Jong (2000) Bell E. F., de Jong R. S., 2000, MNRAS, 312
- Brainerd (2005) Brainerd T. G., 2005, ApJ, 628, L101
- Bruzual & Charlot (2003) Bruzual G., Charlot S., 2003, MNRAS, 344, 1000
- Cardelli, Clayton, & Mathis (1989) Cardelli J. A., Clayton G. C., Mathis J. S., 1989, ApJ, 345, 245
- Catinella et al. (2010) Catinella B., et al., 2010, MNRAS, 403, 683
- Catinella et al. (2013) Catinella B., et al., 2013, MNRAS, 436, 34
- Chung et al. (2009) Chung A., van Gorkom J. H., Kenney J. D. P., Crowl H., Vollmer B., 2009, AJ, 138, 1741
- Conroy, Gunn, & White (2009) Conroy C., Gunn J. E., White M., 2009, ApJ, 699, 486
- Conroy, Graves, & van Dokkum (2014) Conroy C., Graves G. J., van Dokkum P. G., 2014, ApJ, 780, 33
- Dekel & Birnboim (2006) Dekel A., Birnboim Y., 2006, MNRAS, 368, 2
- Faltenbacher et al. (2007) Faltenbacher A., Li C., Mao S., van den Bosch F. C., Yang X., Jing Y. P., Pasquali A., Mo H. J., 2007, ApJ, 662, L71
- Faltenbacher et al. (2009) Faltenbacher A., Li C., White S. D. M., Jing Y.-P., Shu-DeMao, Wang J., 2009, RAA, 9, 41
- Giovanelli & Haynes (1985) Giovanelli R., Haynes M. P., 1985, ApJ, 292, 404
- Giovanelli et al. (2005) Giovanelli R., et al., 2005, AJ, 130, 2598
- Gonzalez-Perez, Castander, & Kauffmann (2011) Gonzalez-Perez V., Castander F. J., Kauffmann G., 2011, MNRAS, 411, 1151
- Haynes et al. (2011) Haynes M. P., et al., 2011, AJ, 142, 170
- Hirschmann et al. (2014) Hirschmann M., Naab T., Ostriker J. P., Forbes D. A., Duc P.-A., Davé R., Oser L., Karabal E., 2014, arXiv, arXiv:1410.2244
- Huang et al. (2014) Huang S., et al., 2014, ApJ, 793, 40
- Holmberg (1969) Holmberg E., 1969, ArA, 5, 305
- Kauffmann et al. (2003) Kauffmann G., et al., 2003, MNRAS, 341, 33
- Kauffmann (2014) Kauffmann G., 2014, MNRAS, 441, 2717
- Kauffmann et al. (2012) Kauffmann G., et al., 2012, MNRAS, 422,997
- Kenney & Young (1989) Kenney J. D. P., Young J. S., 1989, ApJ, 344, 171
- Kereš et al. (2005) Kereš D., Katz N., Weinberg D. H., Davé R., 2005, MNRAS, 363, 2
- Larson & Tinsley (1974) Larson R. B., Tinsley B. M., 1974, ApJ, 192, 293
- Lemonias et al. (2013) Lemonias J. J., Schiminovich D., Catinella B., Heckman T. M., Moran S. M., 2013, ApJ, 776, 74
- Li et al. (2013) Li C., Jing Y. P., Faltenbacher A., Wang J., 2013, ApJ, 770, LL12
- MacArthur et al. (2004) MacArthur L. A., Courteau S., Bell E., Holtzman J. A., 2004, ApJS, 152, 175
- Maraston (2005) Maraston C., 2005, MNRAS, 362, 799
- Martig et al. (2009) Martig M., Bournaud F., Teyssier R., Dekel A., 2009, ApJ, 707, 250
- Martin et al. (2012) Martin A. M., Giovanelli R., Haynes M. P., Guzzo L., 2012, ApJ, 750, 38
- Moran et al. (2012) Moran S. M., et al., 2012, ApJ, 745, 66
- Moran et al. (2010) Moran S. M., et al., 2010, ApJ, 720, 1126
- Oser et al. (2010) Oser L., Ostriker J. P., Naab T., Johansson P. H., Burkert A., 2010, ApJ, 725, 2312
- Papastergis et al. (2013) Papastergis E., Giovanelli R., Haynes M. P., Rodríguez-Puebla A., Jones M. G., 2013, ApJ, 776, 43
- Passmoor, Cress, & Faltenbacher (2011) Passmoor S. S., Cress C. M., Faltenbacher A., 2011, MNRAS, 412, L50
- Roche, Bernardi, & Hyde (2010) Roche N., Bernardi M., Hyde J., 2010, MNRAS, 407, 1231
- Shimasaku et al. (2001) Shimasaku K., et al., 2001, AJ, 122, 1238
- Solanes et al. (2001) Solanes J. M., Manrique A., García-Gómez C., González-Casado G., Giovanelli R., Haynes M. P., 2001, ApJ, 548, 97
- Strom et al. (1976) Strom S. E., Strom K. M., Goad J. W., Vrba F. J., Rice W., 1976, ApJ, 204, 684
- Suh et al. (2010) Suh H., Jeong H., Oh K., Yi S. K., Ferreras I., Schawinski K., 2010, ApJS, 187, 374
- Terndrup et al. (1994) Terndrup D. M., Davies R. L., Frogel J. A., Depoy D. L., Wells L. A., 1994, ApJ, 432, 518
- Thomas, Maraston, & Bender (2003) Thomas D., Maraston C., Bender R., 2003, MNRAS, 339, 897
- Tifft (1963) Tifft W. G., 1963, AJ, 68, 302
- Tortora et al. (2010) Tortora C., Napolitano N. R., Cardone V. F., Capaccioli M., Jetzer P., Molinaro R., 2010, MNRAS, 407, 144
- Wang et al. (2011) Wang J., et al., 2011, MNRAS, 412, 1081
- Wang et al. (2013) Wang J., et al., 2013, MNRAS, 433, 270
- Wang et al. (2014) Wang J., et al., 2014, MNRAS, 441, 2159
- White & Frenk (1991) White S. D. M., Frenk C. S., 1991, ApJ, 379, 52
- Yang et al. (2006) Yang X., van den Bosch F. C., Mo H. J., Mao S., Kang X., Weinmann S. M., Guo Y., Jing Y. P., 2006, MNRAS, 369, 1293
- Yang et al. (2007) Yang X., Mo H. J., van den Bosch F. C., Pasquali A., Li C., Barden M., 2007, ApJ, 671, 153
- York et al. (2000) York D. G., et al., 2000, AJ, 120, 1579
- Zaritsky et al. (1997) Zaritsky D., Smith R., Frenk C., White S. D. M., 1997, ApJ, 478, 39