Results from MINOS and NOA
Abstract
The MINOS experiment, operating in the NuMI beam since 2005, has provided the most precise measurement of the atmospheric mass splitting , and the recent combination of the , , and atmospheric neutrino samples has provided some evidence of non-maximal mixing, and hints about the neutrino mass hierarchy and the octant. Construction of the NOA experiment, situated off-axis in the upgraded NuMI beam, is almost complete. Over the coming years it will have significant power to probe the questions of the mass hierarchy, octant, and the possibility of violation in the lepton sector. This paper gives an overview of the results from MINOS, and of the sensitivity of the NOA experiment.
1 Introduction
The MINOS and NOA experiments are both situated on the NuMI neutrino beam-line. 120GeV protons from the Fermilab Main Injector strike a graphite target, the resulting pions are focussed by two magnetic horns, and decay to produce a beam of primarily muon neutrinos. Observing the energy-dependent disappearance of these muon neutrinos, and subdominant appearance of electron neutrinos provides information about the neutrino oscillation parameters. Both experiments make use of a two-detector design, in which observations by a Near Detector allow measurements of the beam flux, cross-sections and detector effects, while a larger, but otherwise similarly constructed, Far Detector observes the change in the beam composition over a much longer baseline.
2 MINOS
The MINOS detectors are magnetized steel-scintillator tracking sampling calorimeters. They consist of alternating planes of 2.54cm thick steel and cmcm solid scintillator strips. Each scintillator strip contains an embedded wavelength-shifting fibre, read out at both ends by Hamamatsu multi-pixel PMTs. Adjacent scintillator planes are oriented at to each other, allowing for 3D event reconstruction. The detectors are magnetized by a coil to a field of around 1T, allowing for charge identification of muons from curvature.
The MINOS Far Detector is located underground in the Soudan mine, Minnesota, 735km from the NuMI target. It has a total mass of 5.4kton, and has been operating since 2003. The Near Detector is located underground at Fermilab, about 1km downstream from the target. It has a mass of about 1kton, and was completed in 2005. Since 2005, the NuMI beam-line has delivered protons-on-target (POT) to MINOS in the “low energy” neutrino configuration, and POT in antineutrino configuration, plus smaller samples in special configurations. In addition, MINOS has collected an exposure of 37.8 kton years of atmospheric neutrinos. In 2013, following a shutdown, the NuMI beam returned, delivering neutrinos to NOA (and MINOS+ and MINERA) in the new “medium energy” configuration, optimized to give the greatest flux around oscillation maximum (GeV) given NOA’s off-axis location.
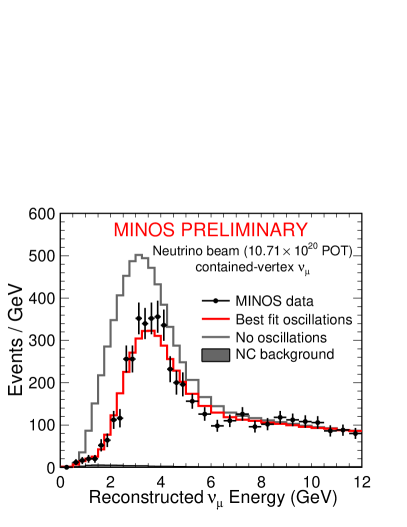
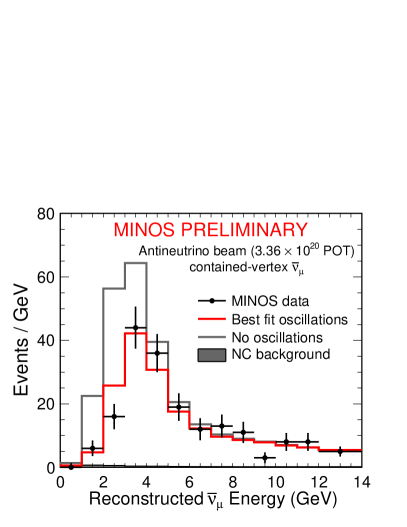
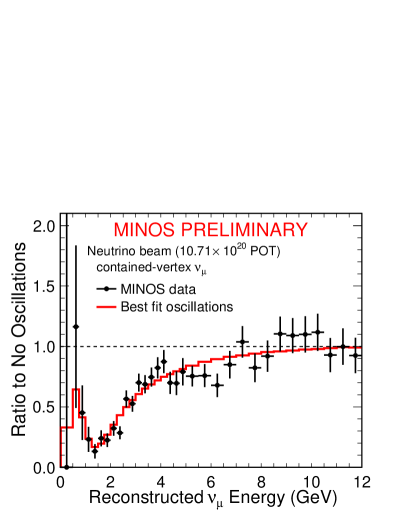
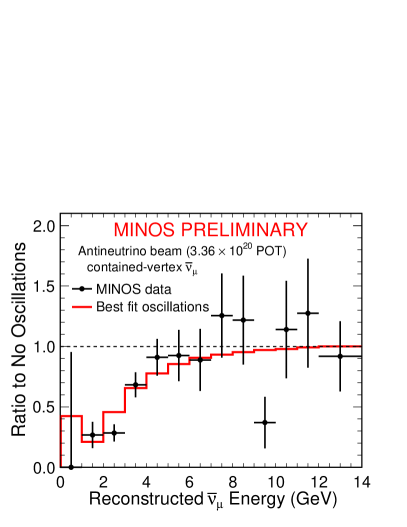
Extrapolating from the observed neutrino spectrum in the Near Detector, in the absence of oscillations, MINOS would expect to select 3201 interactions in the Far Detector, and 363 interactions in the antineutrino running. The observed counts are 2579 and 312 respectively. Figure 1 shows the spectral shapes of these deficits, compared to the best fit from the neutrino oscillation hypothesis. The three-flavour oscillation paradigm fits the data well: 18% of Monte Carlo pseudo-experiments have a worse fit [1].
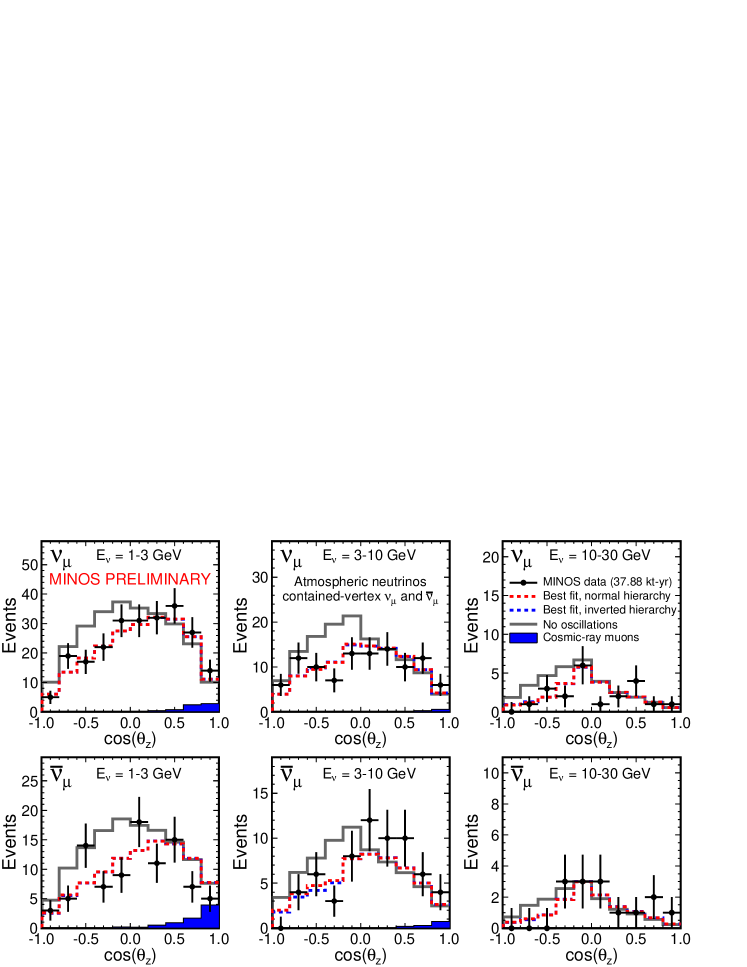
The inclusion of atmospheric neutrino samples into the analysis provides additional sensitivity, particularly to the mass hierarchy. The unoscillated expectation is for 1100 events, 905 are observed. Figure 2 shows the spectra of the contained muon-selected events as a function of zenith angle. Partially-contained and showering events are also included in the analysis as additional samples.
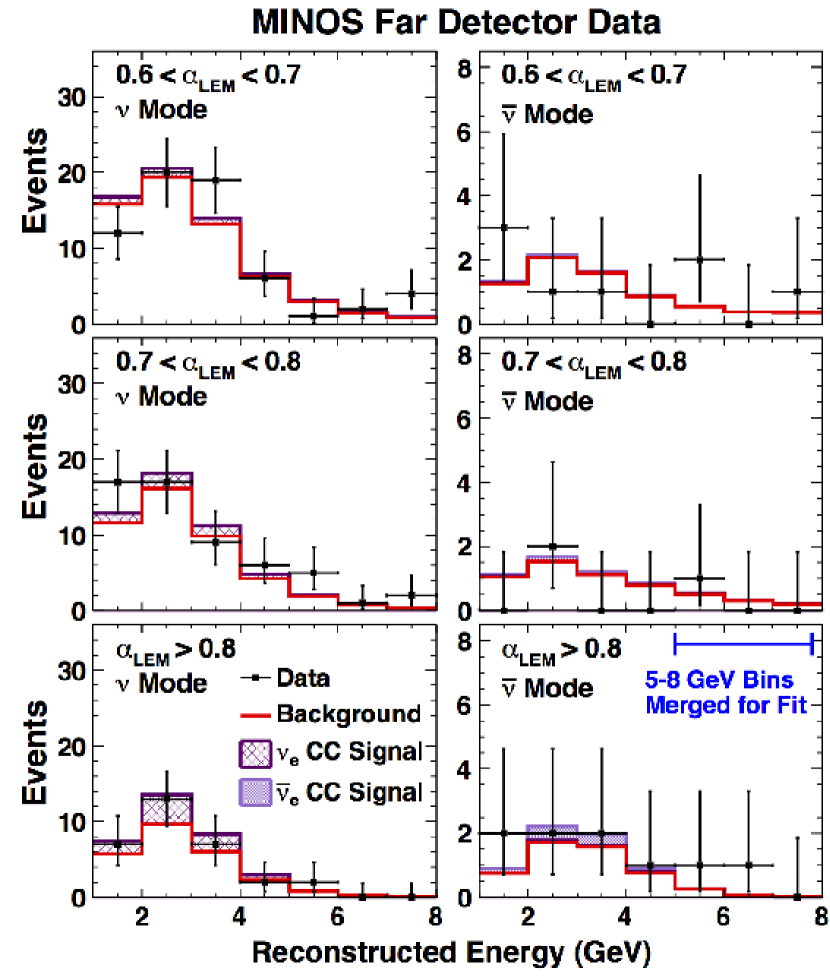
Selecting electron neutrino candidates, the expectation for is 69.1 events of background in neutrino mode, and 10.5 in antineutrinos. The counts observed in data are 88 and 12. Figure 3 shows these excesses in bins of energy and PID value. The hypothesis that is rejected at the 96% confidence level [2].
![[Uncaptioned image]](/html/1501.01016/assets/x8.png)
![[Uncaptioned image]](/html/1501.01016/assets/x9.png)
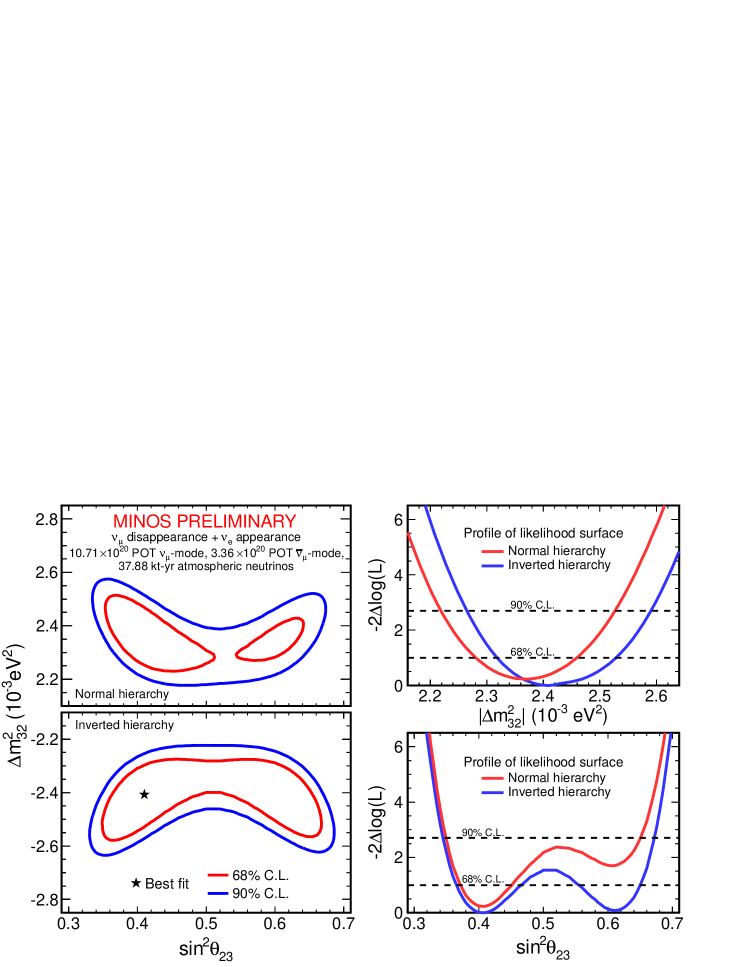
Combining the information provided by the , atmospheric, and samples, plus additional constraints on from reactor experiments provides some sensitivity to the neutrino hierarchy and octant. The solar parameters (, ) are held fixed in this analysis. is treated as a nuisance parameter, constrained by external reactor results. , , and are unconstrained and determined by the joint best fit to all the spectra. Major sources of systematic error are included as nuisance parameters.
Figure 4 shows the confidence contours obtained in (, ) space. The best fit value of is 0.41, and maximal mixing is disfavoured at 79% confidence. The data also weakly favour the inverted hierarchy and the lower octant. Figure 6 shows a different projection of this information, with information included. The most disfavoured scenario is the combination of normal hierarchy and upper octant which is rejected at the confidence level for all values of . This measurement is also the most precise determination of . The results are summarized numerically in Table 1 [3].
| \brParameter | Best fit | Confidence limits (NH) | Best fit | Confidence limits (IH) |
|---|---|---|---|---|
| \mr | 2.37 | 2.28 - 2.46 (68% C.L.) | 2.41 | 2.32 - 2.53 (68% C.L.) |
| 0.41 | 0.35 - 0.65 (90% C.L.) | 0.41 | 0.34 - 0.67 (90% C.L.) | |
| \br |
| Preference for inverted hierarchy: | =0.23 |
|---|---|
| Preference for lower octant: | =0.09 |
| Exclusion of maximal mixing: | =1.54 ( C.L.) |
If some component of the disappearing MINOS flux were oscillating to sterile neutrinos, one would expect to also see a deficit of neutral current events, in addition to the deficit seen in charged currents. In fact, a search for this effect found a small excess of neutral current interactions at the Far Detector as compared to predictions. Interpreting in terms of oscillations around leads to a limit at the 90% confidence level.
The MINOS detectors continue to operate in the NOA-era beam. The higher energy peak of the neutrino flux reduces the statistics acquired in the oscillation region , but the statistics at higher energies are greatly increased. MINOS+ expects to collect around 4,000 charged current events per year. This high-statistics sample will allow tests of the standard three-flavour oscillation paradigm, including searches for sterile neutrinos, and sensitivity to signatures of exotic physics such as large extra dimensions.
3 NOA
The NOA detectors are fine-grained, low-Z, highly active tracking calorimeters. Cells of extruded PVC, approximately 6cm4cm are formed into planes, with the orientation of successive planes alternating as in MINOS. They are filled with a mineral oil/liquid scintillator mix, which comprises 64% of the detector by mass. Each cell contains a looped wavelength-shifting fibre, read out at one end by one of the 32 pixels of a Hamamatsu avalanche photodiode (APD), cooled to [4].
The Far Detector is located on the surface at Ash River, Minnesota, 810km from the NuMI target. The detector consists of 344,000 channels, approximately m, for a total mass of 14kton. Assembly and placement of the plastic blocks, scintillator filling, and electronics installation proceed in parallel. All blocks are now in place, and oil filling is almost complete. Over 2/3 of the detector is instrumented with APDs and being read out. The Near Detector is located underground at Fermilab, approximately 1km from the target. It comprises 18,000 channels, with a mass of 0.3kton. All blocks are in place, and oil filling and electronics outfitting are in progress. The NuMI beam is being upgraded from a maximum capacity of 350kW up to 700kW. This will be achieved by converting the Recycler from running antiprotons to protons, and shortening the cycle in the Main Injector from 2.2s to 1.33s. The beam has been running stably since returning from shutdown in September 2013, and power is gradually being increased. The maximum power achievable will be limited to 500kW until upgrading of the Booster RF cavities is complete. Thus far, in excess of protons have been delivered.
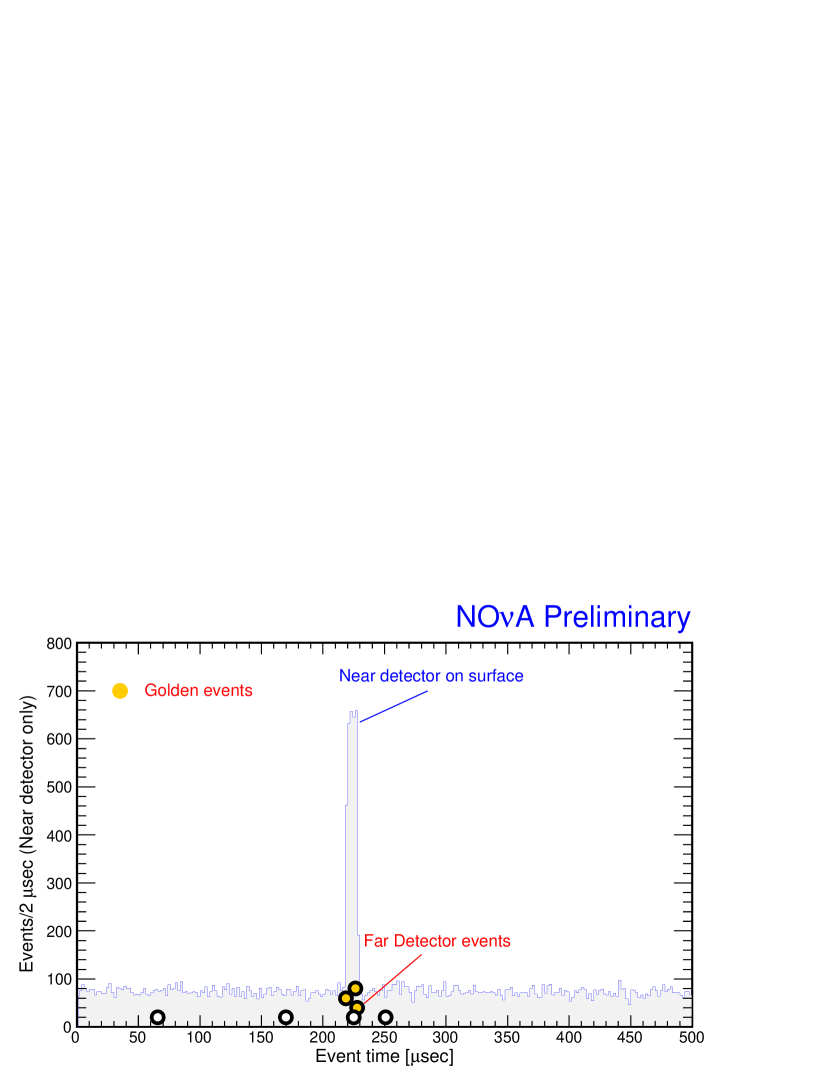
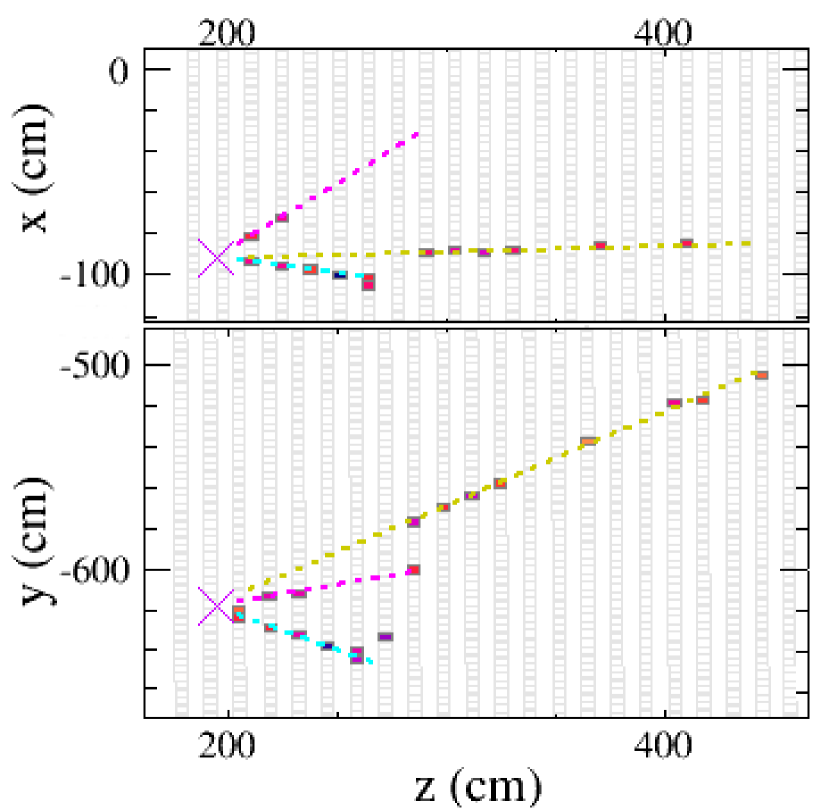
It is important to validate the detectors’ ability to pick neutrino interactions out of the cosmic-ray background, and to verify the synchronization of the Far Detector to the NuMI spill times. Analysis of the Near Detector prototype on the surface at Fermilab (NDOS) shows a clear peak in the neutrino candidate timing spectrum over the cosmic-ray background. Propagating this timing information to the Far Detector gives a 10s window in which neutrinos are expected to be found. A combination of automated analysis and hand-scanning of events in a 500s window around this point (plus out-of-time spills for background estimation) found four candidate events within the timing window, on a background of 0.05. The times of the events relative to the beam window were kept secret until after the choice of these events had been finalized. Figure 7 shows the NDOS timing peak compared to the times of the selected neutrino candidates, and Figure 8 shows one of the Far Detector events in the timing window, a multi-pronged interaction, with reconstructed neutrino direction coming from Fermilab.
The sensitivity projections presented below assume POT of data taken in neutrino mode plus POT taken with antineutrinos. This corresponds to a nominal POT per year and a run plan with three years in each mode. The choice of what exposure to take in each beam configuration is flexible, and may be adjusted in response to changing circumstances. The oscillation parameters assumed are or depending on context. We take , and the other parameters from the latest Particle Data Group averages [5].
| \br selected | ||
| \mrNC | 19 | 10 |
| CC | 5 | |
| Beam | 8 | 5 |
| \mrTot bkg | 32 | 15 |
| Signal | 68 | 32 |
| \br |
| \br selected | CC | NC | CC | NC |
|---|---|---|---|---|
| \mrQuasielastic | 82 | 49 | ||
| non-QE | 168 | 14 | 78 | 6 |
| Uncontained | 233 | 6 | 134 | 3 |
| \br |
(0-5GeV visible energy)
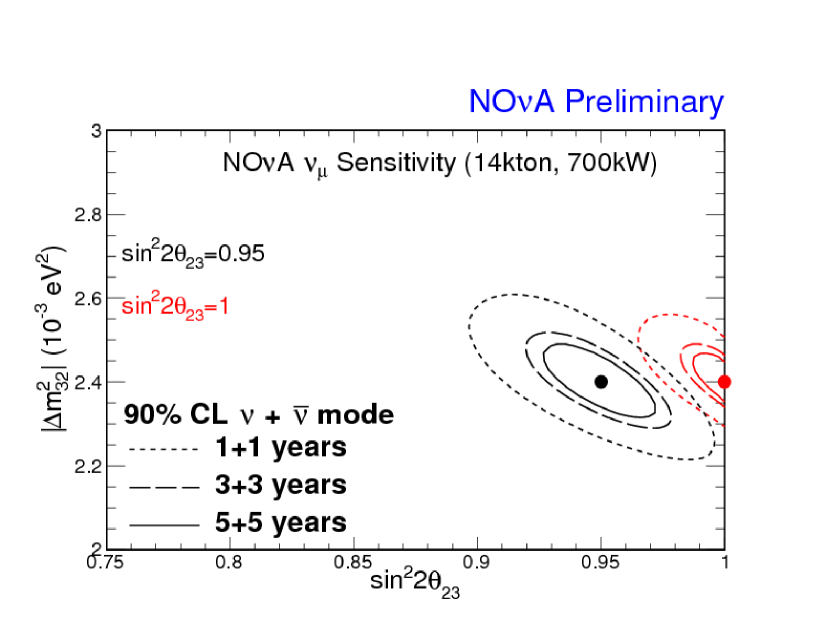
Current global constraints on the atmospheric mixing angle are around , with hints of non-maximal mixing from MINOS. The NOA experiment will have significantly enhanced power to distinguish between maximal and non-maximal mixing. The charged current analysis being developed separates the data into three samples: quasi-elastic candidates, which are very pure with good energy reconstruction; the remainder of contained candidates; and uncontained events, where the muon exits through the back or side of the detector, a sample with substantial statistics, but poor energy resolution. Predicted event counts are given in Table 2. The contours that would be obtained with increasing exposure are shown in Figure 9, for two possible values of . With three years of neutrino running, and three years of antineutrinos, this analysis should obtain percent-level uncertainty on the atmospheric mixing parameters. If , maximal mixing could be excluded at 90% confidence with one year of running.
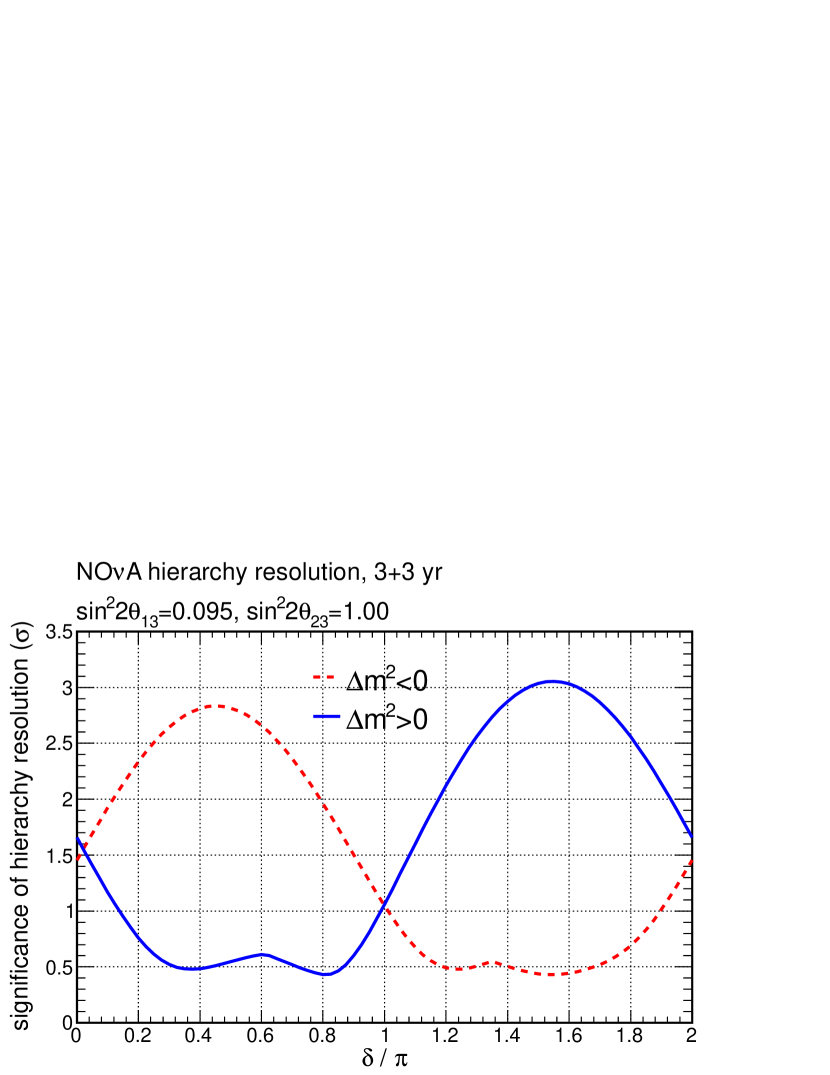
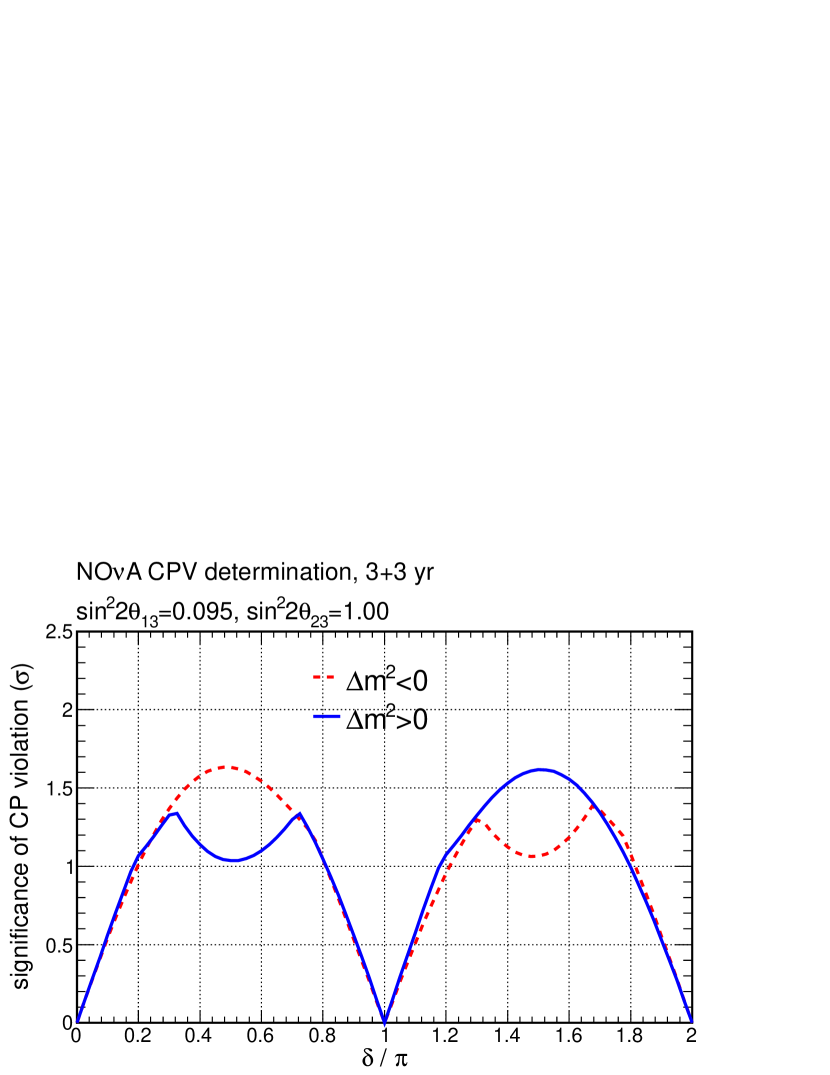
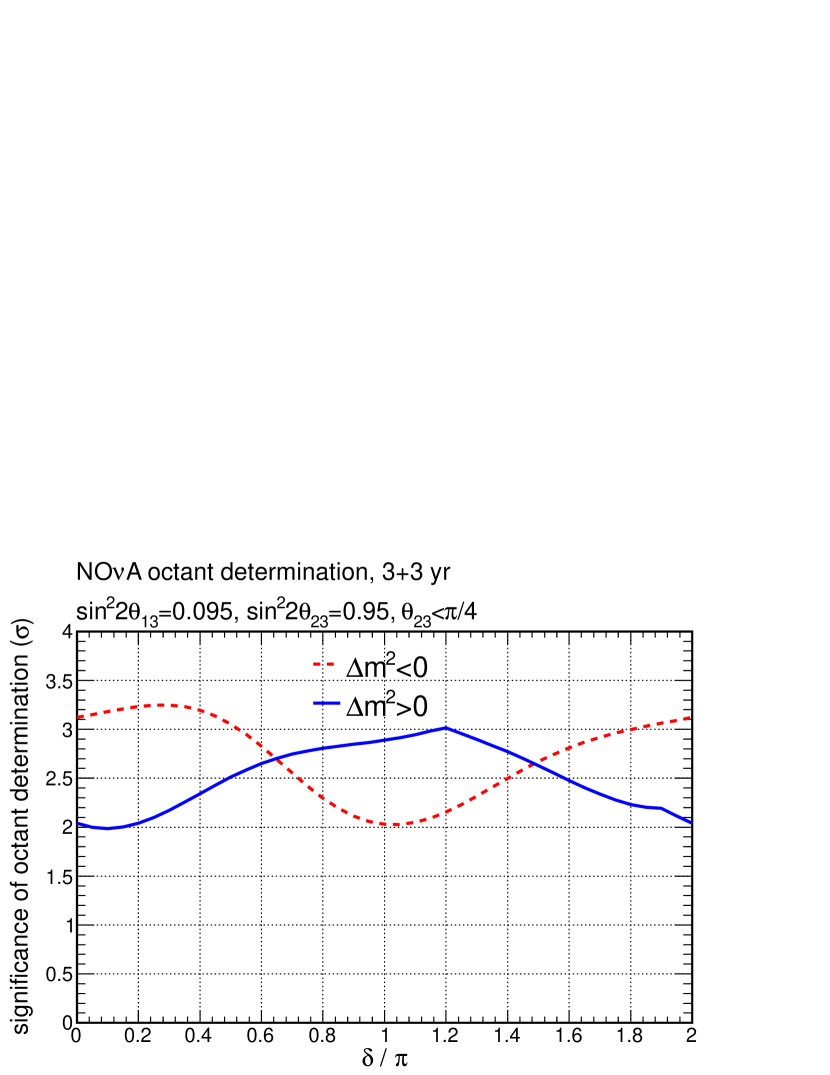
Table 2 also shows the representative event counts for the sample of electron neutrino candidates. As with MINOS, sensitivity to the mass hierarchy, octant, and comes from combining the disappearance and appearance analyses, plus constraints on from reactor experiments. Figure 10 shows the sensitivity of this analysis to these three parameters, as a function of the true values of and the mass hierarchy. For the mass hierarchy, there are degenerate regions where it is not possible to disentangle the matter effects, which give information about the mass hierarchy, from true -violation driven by . But for favourable combinations evidence for the mass hierarchy can be obtained. Determination of the octant is much less sensitive to and can be achieved at better than for all values of if . The lower octant is assumed in order to match the best fit from MINOS, performance for the upper octant is slightly better. Figure 6 shows predicted slices as a function of , to be compared with the analogous Figure 6 from MINOS data. The true parameters are chosen to match the MINOS best fit (inverted hierarchy, lower octant, ). If the true parameters are indeed in this region, NOA would reject parts of phase space (in particular the combination of normal hierarchy and upper octant) at very high significance.
4 Conclusion
The MINOS experiment has collected a large sample of neutrino interactions in over six years of running, in both neutrino and antineutrino mode. A combined fit to this data gives the world’s most precise measurement of , and hints for the neutrino mass hierarchy and octant. These detectors will continue taking data in the NOA-era beam as MINOS+.
Construction of the NOA experiment is progressing well. First neutrinos have been found in the Far Detector, and projections show good sensitivity to the mass hierarchy and octant, in addition to improved measurements of the atmospheric mixing parameters. Results from the next few years, in combination with other experiments, should provide significant information on these questions for the first time.
References
References
- [1] Adamson P et al. 2013 Phys. Rev. Lett. 110, 251801
- [2] Adamson P et al. 2013 Phys. Rev. Lett. 110, 171801
- [3] Adamson P et al. 2014 Preprint hep-ex/1403.0867, submitted to Phys. Rev. Lett.
- [4] Ayres D S et al. 2007 FERMILAB-DESIGN-2007-01
- [5] Beringer J et al. 2012 Phys. Rev. D 86, 010001