A first look at the X-ray population of the young massive cluster VVV CL077
Abstract
Multi-wavelength analysis of the young massive cluster VVV CL077 is presented for the first time. Our Chandra survey of this region enabled the detection of three X-ray emitting stellar members of the cluster, as well as a possible diffuse X-ray component that extends a few arcseconds from the cluster core with an intrinsic flux of (93) erg cm-2 s-1 in the 0.5–10 keV band. Infrared spectra we obtained for two of these X-ray point sources show absorption lines typical of the atmospheres of massive O stars. The X-ray spectrum from the visible extent of VVV CL077 i.e., a 15′′-radius around the cluster, can be modeled with an absorbed power law with cm-2 and 21. In addition, the X-ray core of VVV CL077 coincides with diffuse emission seen in the infrared band and with a local maximum in the radio continuum map. A possible association with a neighboring H II region would place VVV CL077 at a distance of around 11 kpc; on the far side of the Norma Arm. At this distance, the cluster is 0.8 pc wide with a mass density of (1–4) pc-3.
Subject headings:
X-rays: stars; infrared: stars; stars: early-type; open clusters and associations: individual (VVV CL077)1. Introduction
Young Massive Clusters (YMCs) are loose collections of tens to thousands of stars more massive than the Sun (see Portegies Zwart et al., 2010, for a recent review). While they are a common feature of starburst galaxies, the Milky Way contains relatively few YMCs, only a small fraction of which are known X-ray emitters or have been (or can be) resolved into individual objects over several wavebands (e.g., Townsley et al., 2011b, and references therein). The most massive Galactic YMC is Westerlund 1 which is located 4 kpc away in the direction of the Norma Arm (e.g., Clark et al., 2005). Members of its stellar population have been resolved in several wavebands, including in the X-rays (by Chandra) where evidence was found for X-ray emission from massive, evolved (i.e., post-main-sequence) stars such as OB supergiants and Wolf-Rayet (WR) stars, from colliding wind binaries, and from an anomalous X-ray pulsar (Skinner et al., 2006; Muno et al., 2006b; Clark et al., 2008).
X-ray emitting YMCs with resolvable populations represent rare opportunities for observational tests of stellar evolution models including those involving the initial mass function and stellar and cluster dynamics, as well as for understanding the energetic feedback processes between massive stars and their environment. As the more massive stars tend to sink to the center of the cluster, they can pair up into massive binaries. Dynamical interactions between this core population can lead to the tightening of the binary (some of which can evolve into an X-ray binary) or even to its ejection from the cluster (e.g., Portegies Zwart et al., 2007, 2010, and references therein). The distribution of the X-ray emitting point sources compared with the normal stellar content can be used to glean clues to the evolutionary history of the cluster.
We used Chandra to construct a high-resolution X-ray map of a section of the Norma Arm. Among the new objects discovered in the survey were multiple X-ray sources consistent with a YMC named VVV CL077 (Borissova et al., 2011) from the Vista Variables in the Via Lactae Survey (VVV: Minniti et al., 2010). In this paper, we describe the multi-wavelength properties of VVV CL077 by complementing the soft X-ray data with dedicated and archival observations gathered in the radio and infrared bands. The data and analytical methods are described in § 2, results are presented in § 3, and we discuss their implications in § 4. A summary of our key findings is given in § 5.
2. Observations & Data Analysis
2.1. X-ray Data
In 2011 June, the field of VVV CL077 was observed with Chandra during a survey of the Norma Arm (PI: Tomsick; observation IDs 12529 (catalog ADS/Sa.CXO#obs/12529) and 12530 (catalog ADS/Sa.CXO#obs/12530)). An additional observation (ObsID 15625 (catalog ADS/Sa.CXO#obs/15625)) was performed in early 2013 as part of Chandra Director’s Discretionary Time in which VVV CL077 was serendipitously in the field. Table 1 contains the journal of these observations.
| observation ID | start date | end date | exposure time (s) | off-axis angle of VVV CL077 |
|---|---|---|---|---|
| 12529 (catalog ADS/Sa.CXO#obs/12529) | 2011-06-16 06:58:05 | 2011-06-16 12:31:35 | 19014 | 36 |
| 12530 (catalog ADS/Sa.CXO#obs/12530) | 2011-06-16 12:31:35 | 2011-06-16 18:09:14 | 19260 | 85 |
| 15625 (catalog ADS/Sa.CXO#obs/15625) | 2013-03-23 08:17:49 | 2013-03-23 11:54:43 | 9839 | 63 |
Reprocessing and reduction of the Chandra data relied on CIAO v.4.5 and HEASoft 6.13. Detailed descriptions of the imaging analysis including background, exposure, and astrometric corrections, as well as the source-detection procedure are presented in Fornasini et al. (2014). These cleaned event files and their associated lists of detected sources were used as the inputs for this study. Source coordinates are given in the J2000.0 epoch with uncertainties quoted at 90% confidence.
Spectra were extracted from each event file in the 0.5–10 keV band for source regions (of variable sizes, see § 3) and from a source-free background region (a rectangle with dimensions: 400 px200 px) on the same detector chip. Parameters from absorbed power laws fit to the individual spectra were statistically consistent with each other (i.e., there was no significant X-ray variability between 2011 and 2013). Therefore, the X-ray spectra described in the following sections are based on summing these individual spectra with combine_spectra.
2.2. Infrared Data
The infrared data consist of observations we gathered (PI: Rahoui) at the Cerro Tololo Inter-American Observatory (CTIO). Photometry was performed on 2011 July 19 with the NOAO/NEWFIRM instrument on the 4-m Blanco telescope. Simultaneous , , and -band spectra (R) were collected on 2012 June 1–4 for five stars near the core of the VVV CL077 using the Ohio State Infrared Imager/Spectrometer (OSIRIS) mounted on the 4.1-m Southern Astrophysical Research (SOAR) Telescope.
A set of standard stars was observed in similar conditions in order to remove telluric absorption lines. The ABBA nodding technique was employed for background subtraction. Data reduction relied on the IRAF echelle package which included bad-pixel correction, dark subtraction, linearity correction, flat-fielding, sky subtraction, and spectral extraction along the dispersion axis. The spectra were then wavelength-calibrated by comparing them to an argon lamp. Additional details regarding the observation and analysis procedures will be described in Rahoui et al. (2014).
Unfortunately, weather and atmospheric conditions were poor with thin clouds and a seeing higher than 13. Useful spectra were obtained for only 2 of the 5 targets, and only in the -band. These data are supplemented by archival imaging observations from the VIRCAM instrument of the Vista Variables in the Via Lactae Survey (VVV: Minniti et al., 2010).
3. Results
3.1. X-ray Data
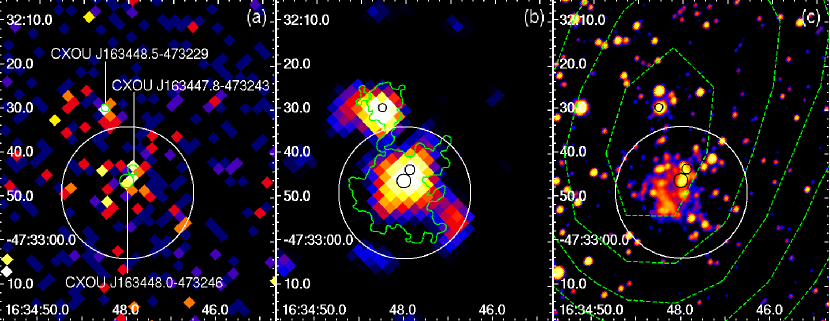
In Fig. 1, we present images of the field of VVV CL077 in the X-rays (panels a and b: 0.5–10 keV from Chandra) and in the near infrared (-band image from the VVV Survey (Minniti et al., 2010)). Detected X-ray sources are indicated by circles with radii equal to the position uncertainty at 90% confidence (see Table 2). The large circle (radius ) denotes the visual extent of the YMC in the infrared according to Borissova et al. (2011); it is centered at R.A. and Decl. .
This figure illustrates the complex morphology of the multi-wavelength emission from VVV CL077. In the infrared, the cluster contains 21 visually-identified members (Borissova et al., 2011), plus an extended component from unresolved stars and diffuse emission. In the X-rays, there are 3 detected sources not including extended emission. The size and shape of the extended emission in X-rays and infrared are similar and both have positions that are consistent with a local maximum in the radio continuum map from the Molonglo Galactic Plane Survey 2nd Epoch (MGPS-2: Murphy et al., 2007).
Two candidate X-ray sources are detected near the core of VVV CL077 (Table 2). The first source (in R.A.) is CXOU J163447.8473243 (catalog ), is detected at a significance of at R.A. and Decl. with an error radius of 11. The other, CXOU J163448.0473246 (catalog ), is detected at at R.A. and Decl. with an error radius of 16.
An angular distance of 29 separates the two X-ray objects, which is somewhat larger than the 90% encircled energy radius (i.e., 24 at 2.3 keV) of the Chandra point-spread function (PSF). Their X-ray positions are statistically incompatible at 90% confidence, and they are consistent with two bright nodes (stars belonging to VVV CL077) at opposite ends of a clump of unresolved emission in the infrared images. Given the positional coincidence with stars seen in the infrared, we conclude that these are likely to be two distinct X-ray sources rather than a single extended source.
| name | R.A. (deg) | decl. (deg) | 90% conf. radius | det. sig. () |
|---|---|---|---|---|
| CXOU J163447.8473243 (catalog ) | 248.69950 | 47.54550 | 11 | 5.8 |
| CXOU J163448.0473246 (catalog ) | 248.70008 | 47.54619 | 16 | 6.9 |
| CXOU J163448.5473229 (catalog ) | 248.70221 | 47.54161 | 09 | 6.2 |
To confirm whether any of the X-ray emission emanating from the VVV CL077 is extended or simply arises from two point sources, we used ray-tracing simulation data from ChaRT (part of the CIAO package) to generate reprojected PSFs for the observation in which the source had the smallest off-axis angle (ObsID 12529 (catalog ADS/Sa.CXO#obs/12529)). For this simulation, we adopted an exposure time of 19 ks, and an absorbed power law spectrum with and fixed at cm-2 (see below, and in Table 3). The CIAO tool srcextent returns an intrinsic source size of (70 25) for this emission, assuming the object is placed on-axis. Using an observation with a larger off-axis angle (ObsID 12530 (catalog ADS/Sa.CXO#obs/12530)) leads to a larger intrinsic source size (), as expected.
After subtracting off 95% of the photons from the two X-ray point sources in the core via aperture restriction (see below), we find that there is still some residual emission with as many net counts outside the core (44) as from the two point sources combined (40). Along with the large intrinsic size of the X-ray emitting region, this indicates the presence of an extended and diffuse X-ray component, in addition to the emission from the two point sources.
Just outside the YMC is CXOU J163448.5473229 (catalog ) which coincides spatially with a star that is likely associated with the YMC given the similar infrared colors to those of other cluster members. The best-fitting X-ray position ( detection significance) is R.A. and Decl. with an error radius of 09. correcIts intrinsic size, estimated via ChaRT, is consistent with 0′′ in ObsID 12529 (catalog ADS/Sa.CXO#obs/12529).
Note that in ObsID 12530 (catalog ADS/Sa.CXO#obs/12530), a second candidate X-ray source is detected outside the YMC, CXOU J163448.6473234 (catalog ), located at R.A. and Decl. with an error radius of 25 (significance ). The large estimate of the source extent from wavdetect (), the fact that it was only detected in this ObsID when the YMC was 85 off axis, and the lack of a clear infrared counterpart suggest that this is the same source as CXOU J163448.5473229 (catalog ) (44 away), and so it will not be discussed further.
Spectral data were fit with power law, apec, and bremsstrahlung models. However, the observed photon counts within the source extraction regions are low (i.e., counts), and so we caution that any derived spectral parameters are merely estimates, and may not be indicative of the true values. Given the low source counts and very low background counts, spectral fitting relied on Cash (1979) statistics and Pearson (1900) test statistics. All fits assumed Wilms et al. (2000) abundances and photoionization cross sections from Balucinska-Church & McCammon (1992). The hardness ratio is defined as where is the count rate in 3–10 keV and is the count rate in 0.5–3 keV.
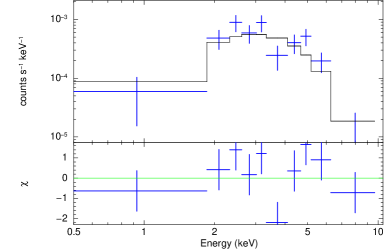
The X-ray spectrum extracted from a radius (30 pixels) around the infrared position of VVV CL077 is presented in Fig. 2. This spectrum includes the two X-ray point sources in the core of the YMC, plus diffuse X-ray emission. There are 107 net counts in this region for a hardness ratio of 0.100.11. A power law fit to the data yields cm-2 and , while an apec model yields cm-2 and keV.
To compare the properties of the X-ray emission in the core of the YMC with that of the diffuse emission, we extracted a spectrum from a circle of radius (12 pixels) that encompasses the 95% encircled energy radius (EER) of both point sources in the core (CXOU J163447.8473243 (catalog ) and CXOU J163448.0473246 (catalog )) giving 40 net source counts, as well as a spectrum from an annulus (centered at the same position) with inner and outer radii of and 125, respectively, that represents the diffuse emission (44 net counts). The results of models fit to these spectra are tabulated in Table 3. There are hints that the diffuse component has a slightly higher plasma temperature (with apec models) and a harder photon index (with power law models) than the stellar sources in the core region, but the low photon counts results in large uncertainties, which leads to some overlap in the range of possible temperatures and photon indices at the 90% confidence level. We attempted to extract spectra for each X-ray point source in the core by using non-overlapping regions but the sources ended up with too few counts (9 net counts each) to permit reliable fitting.
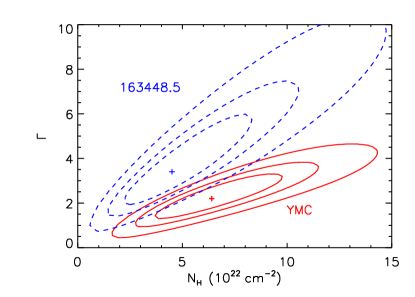
A source spectrum was made for CXOU J163448.5473229 (catalog ) by using an extraction radius of (12 pixels) centered on its X-ray position. While the spectral parameters of CXOU J163448.5473229 (catalog ) are compatible with those of the other source regions (within the statistical uncertainties), it is clearly softer than the others given its hardness ratio of 0.430.25. This is illustrated in Fig. 3 which compares the 68%, 90%, and 99% confidence contours of spectral parameters from the power law model fit to the data of CXOU J163448.5473229 (catalog ) (dashed lines), and for the YMC (solid lines). There is some overlap between the parameter spaces at the 99% confidence level, but the X-ray emission from the cluster tends to be harder and more absorbed than that of a point source situated in the cluster’s outskirts.
3.2. Infrared Data
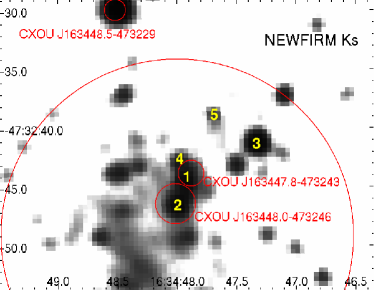
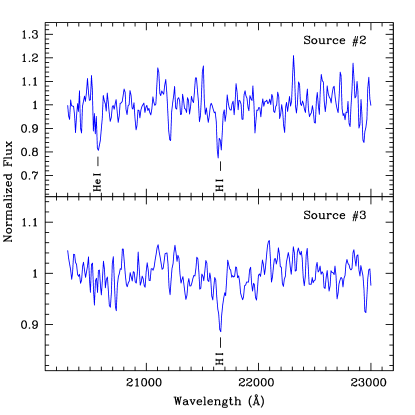
Figure 4 shows the -band image of the region gathered with NOAO/NEWFIRM. Infrared spectra for Source #2 and Source #3 are presented in Fig. 5. In the -band spectra of Source #2 , we detect a Br- line in absorption at 21660 . The equivalent width is with a typical error of 1–1.5 . There is a marginal detection of the He I line in absorption at 20600 . Source #3 also presents a Br- line in absorption with an equivalent width of . With standard deviations being less than 0.06, this leads to in both sources. Comparing these spectra to those of a sample of high-mass stars provided by Hanson et al. (1996) indicates that Sources #2 and #3 are probably late-O giants.
In addition to these spectra, we searched the ViZier archives for multi-wavelength counterparts consistent with the X-ray error circles of the sources detected by Chandra. Table 4 lists the reported magnitudes of these counterpart candidates. The derived and colors are compatible with the colors observed in O stars (e.g., Ramírez Alegría et al., 2012). Comparing CXOU J163448.0473246 (catalog ) and CXOU J163448.5473229 (catalog ), we find consistent values (within the uncertainties) for their (1.80.2 vs. ) and ( vs. ) colors, but the color is 50% higher for CXOU J163448.0473246 (catalog ) (1.50.2 vs. ) which suggests it has a slight near-to-mid-infrared excess, although the source is blended in the 2MASS -band image. We point out the presence of a mid-infrared source located 29 away from CXOU J163448.0473246 (catalog ) (i.e., 14 from the IR position of the cluster): WISE J163448.13473248.9 (catalog ) has reported magnitudes of 5.5630.110 (at 3.35 m), 4.7560.055 (4.6 m), -0.8960.121 (11.6 m), and -3.1900.020 (22.1 m).
4. Discussion
At least 21 stars belonging to VVV CL077 were visually identified in the infrared (Borissova et al., 2011), and this young massive cluster is now detected for the first time in the X-rays with Chandra. A complete census of the X-ray emitting sources in VVV CL077 can not be achieved with the current data. Nevertheless, recent X-ray observations of this region reveal a number of intriguing results.
Imaging data from Chandra suggest that there are three X-ray point sources associated with infrared stellar counterparts that belong to the cluster. Two of these sources are located near the cluster core, and the third is located in the cluster’s outskirts. In addition to these point sources, there is extended and diffuse X-ray emission: the estimated intrinsic (on-axis) size of the X-ray emitting core of the YMC is larger than expected for the combined 95% energy-containment circles of the two closely-spaced point sources in the core; and this component, which contains as many net counts as the core X-ray point sources combined, can not be directly associated with any resolved sources.
The presence of diffuse emission, with X-ray spectral properties statistically consistent with that of the resolved stellar X-ray sources, would suggest a population of unresolved X-ray sources in the YMC whose emission lies below the sensitivity limit of the survey ( erg cm-2 s-1 Fornasini et al., 2014).
Diffuse X-ray emission has been observed in other YMCs including in Wd 1 and in active star-forming regions like the Carina Nebula (Muno et al., 2006a; Townsley et al., 2011a, c). In addition to the combined emission from unresolved stars, the diffuse component could originate from putative collisions between the winds of massive stars, although the temperature and absorption in VVV CL077 are higher than expected for such processes (e.g., Stevens & Hartwell, 2003).
Two of the stars VVV CL077 display infrared spectral signatures typical of late-type O stars (Hanson et al., 1996). There is good overall agreement between the outlines of the emission as seen in the X-rays and infrared, and this multi-wavelength consistency continues into the radio band where the X-ray and infrared emission coincide spatially with a local maximum in the 843 MHz continuum map from MGPS-2 (Murphy et al., 2007). The coincidence of the multi-wavelength emission from VVV CL077 could indicate a common physical origin, however, the observed X-ray flux of the diffuse component is larger than expected from an extrapolation of the infrared flux density (see below).
The nearest catalogued ultra-compact H II region is IRAS 163114726 (catalog ) (Helou & Walker, 1988; Bronfman et al., 1996) which is 6′′ from the infrared position of VVV CL077. It has a velocity of 121 km s-1 with respect to the local standard of rest, which translates to a source distance of approximately 11 kpc (e.g., Brand & Blitz, 1993). There is also a catalogued H II region 7′ away from VVV CL077 with a listed distance of 10.90.2 kpc (Russeil, 2003). If these regions are related, then we can assign a distance of around 11 kpc to VVV CL077. This would make it one of the most distant Galactic YMCs known, comparable to Mercer 81 (catalog ) (Davies et al., 2012), at a location consistent with the far Norma Arm.
Taking the visual extent of the bulk of the stellar population in the infrared as the angular scale (15′′: Borissova et al., 2011) gives a cluster diameter of 0.8 pc for an assumed distance of 11 kpc. This value is consistent with the intrinsic sizes of other Galactic YMCs (Figer, 2008, and references therein).
Corrected for absorption, the diffuse emission from VVV CL077 has an intrinsic flux of erg cm-2 s-1 (0.5–10-keV). This is more than an order of magnitude above the flux expected from the Galactic Ridge diffuse emission (Ebisawa et al., 2001, 2005). If we assume, nevertheless, that the Ridge emission accounts for 20% of the flux from VVV CL077, as it does for Wd 1 (Muno et al., 2006a), then the residual flux of erg cm-2 s-1 can be attributed to the diffuse cluster emission. For a distance of 11 kpc (assumed), this translates to an X-ray luminosity of erg s-1. Flux densities reported for IRAS 163114726 (catalog ) are 20.10.6 Jy at 12 m and 1535 Jy at 25 m (Helou & Walker, 1988). Extrapolating a power law with a photon index of leads to an X-ray flux density of Jy at 1 keV ( erg cm-2 s-1 over 0.5–10 keV). This is an order of magnitude smaller than the lower 90%-confidence boundary of the intrinsic flux density ( Jy at 1 keV). In order to match the X-ray flux, the photon index should be no steeper than 2.5, which is consistent with what we found in Section 3.1.
A simple estimation of the cluster mass density yields (1–4) pc-3. This assumes that all 21 visually-identified members of the cluster are similar to the sources we identified as O type stars with masses in the range of 10–50 . While the mass density is consistent with those of other YMCs, the cluster mass implied by this first-order approximation ( ) is an order of magnitude below the inferred masses of other YMCs (Figer, 2008). This indicates a large population of unresolved stars hiding in and around the cluster which is not surprising given the extinction in this direction.
From the observed infrared excess , we estimate the extinction in the optical band as assuming a near-infrared extinction law with (Stead & Hoare, 2009). Applying the relation of Güver & Özel (2009) yields a column density of cm-2. When the contribution from molecular hydrogen is included, the total column density of the interstellar medium towards the Norma region ranges from cm-2 to cm-2 (Rahoui et al., 2014). This is consistent with our X-ray-derived value of cm-2.
Plasma temperatures of around 1–2 keV are found for the X-ray emitting point sources in the cluster which is higher than average for massive stars (e.g., Rauw et al., 2014). The X-ray source located in the outskirts of the cluster (CXOU J163448.5473229 (catalog )) has a temperature that is statistically compatible (at 90% confidence) with 0.7 keV which is a more typical value. As we move towards the center of the cluster, we find that the X-ray derived temperatures of these stars are higher, possibly due to increasing column density (which preferentially absorbs low-temperature photons). With its proximity to IRAS 163114726 (catalog ), this could indicate that the stars in the core of VVV CL077 are still embedded within their dusty natal cocoons; similar to the hot, young stars of W49A (Conti & Blum, 2002), a cluster that resides within an ultra-compact H II region. However, we can not exclude that the unusual spectral values are the result of poor photon statistics.
Based on the IR spectra, we narrowed the range of spectral types to O5–O9 giants for two of the stars in the cluster. We derived the distance modulus using the observed -band magnitude of CXOU J163448.0473246 (catalog ) in Table 4, the absolute -band magnitude of 4.6 for an O giant (Martins & Plez, 2006), and . This gives a distance to the object of 103 kpc, consistent with the distance assumed based on its possible link with IRAS 163114726 (catalog ).
In massive stars, the ratio between the X-ray and bolometric luminosities is (e.g., Berghoefer et al., 1997; Rauw et al., 2014). Such stars have bolometric luminosities of 5.2–5.7 (Martins et al., 2005). To test whether the objects we classify as massive stars obey this rule, we began with the observed X-ray flux of the “inner core” region and corrected this for the interstellar absorption alone ( cm-2), then halved this value to obtain the absorption-corrected flux of one of the stars of the pair. For an assumed distance of 103 kpc, this yields an X-ray luminosity of erg s-1. A ratio of is obtained for either the high end of the bolometric luminosity range (5.7), or for distances at the lower end of the estimate (7 kpc). Fixing the temperature to a more reasonable value of 0.6 keV raises the column density to unlikely values ( cm-2), which, once corrected for interstellar absorption, results in erg s-1, and so it remains consistent (within the uncertainties) with the expected value for massive stars.
Finally, we consider the question of whether there are supernova remnants and accreting compact objects in VVV CL077. There are no obvious shell-like features in the infrared and X-ray data that would indicate recent supernova activity, although the low level of soft X-ray emission and lack of hard X-ray or gamma-ray detections appear to rule out such scenarios. Luminous ( erg s-1) X-ray point sources are missing from VVV CL077 which excludes high-mass X-ray binaries (HMXBs) where the accretion proceeds through Roche-lobe overflow. Wind-fed HMXBs could be present but they would have to be weakly-accreting or quiescent ( erg s-1), such as is the case for Supergiant Fast X-ray Transients (SFXTs) outside of outbursts. However, the photon indices measured in the core and for the external X-ray sources are too soft to support the weakly-accreting SFXT scenario (e.g., Romano et al., 2011). An additional point to consider is that the supernova that leads to the formation of the compact object in such systems can impart a velocity to the nascent X-ray binary that is several times larger than the cluster escape velocity (van den Heuvel et al., 2000; Clark et al., 2005). The apparent lack of supernova remnants or accreting compact objects would tend to favor a relatively young age for the YMC, i.e., a few Myr at most.
5. Summary & Conclusions
We presented results from recent Chandra observations of VVV CL077, a Young Massive Cluster (YMC) located towards the Norma Arm. Three X-ray point sources were detected that correspond to visually-identified stellar members of the cluster. Infrared spectra we obtained for two members of the cluster show absorption lines typical of the atmospheres of massive stars. Plus, the infrared colors and relation also indicate massive stars. However, X-ray spectral fits of these stars yield temperatures that are higher than average for massive stars.
In addition to these point sources, there are hints that an extended region of diffuse X-ray emission permeates the cluster core. The X-ray column density and optical extinction, as well as an estimate of the cluster mass, suggests a population of unresolved stars that contribute to the diffuse emission. The X-ray spectrum of the 15′′-radius visible extent of the VVV CL077 is best modeled with an absorbed [ cm-2] power law ().
The X-ray core of the cluster coincides with diffuse emission seen in the infrared band and with a local maximum in the radio continuum map. A tentative link with a neighboring H II region would place VVV CL077 at a distance of around 11 kpc; on the far side of the Norma Arm. At this distance, the cluster is 0.8 pc wide with a mass density of (1–4) pc-3, i.e., within the range of values seen for other YMCs.
A complete picture of the X-ray population and diffuse emission from VVV CL077 is not possible at this time, but continued X-ray observations of YMCs are important for the study of massive stars, the formation and evolution of compact objects, and the recent star formation history of the Galaxy.
References
- Balucinska-Church & McCammon (1992) Balucinska-Church, M., & McCammon, D. 1992, ApJ, 400, 699
- Berghoefer et al. (1997) Berghoefer, T. W., Schmitt, J. H. M. M., Danner, R., & Cassinelli, J. P. 1997, A&A, 322, 167
- Borissova et al. (2011) Borissova, J., et al. 2011, A&A, 532, A131
- Brand & Blitz (1993) Brand, J., & Blitz, L. 1993, A&A, 275, 67
- Bronfman et al. (1996) Bronfman, L., Nyman, L.-A., & May, J. 1996, A&AS, 115, 81
- Cash (1979) Cash, W. 1979, ApJ, 228, 939
- Clark et al. (2008) Clark, J. S., Muno, M. P., Negueruela, I., Dougherty, S. M., Crowther, P. A., Goodwin, S. P., & de Grijs, R. 2008, A&A, 477, 147
- Clark et al. (2005) Clark, J. S., Negueruela, I., Crowther, P. A., & Goodwin, S. P. 2005, A&A, 434, 949
- Conti & Blum (2002) Conti, P. S., & Blum, R. D. 2002, ApJ, 564, 827
- Davies et al. (2012) Davies, B., de La Fuente, D., Najarro, F., Hinton, J. A., Trombley, C., Figer, D. F., & Puga, E. 2012, MNRAS, 419, 1860
- DENIS Consortium (2005) DENIS Consortium. 2005, VizieR Online Data Catalog, 2263, 0
- Ebisawa et al. (2001) Ebisawa, K., Maeda, Y., Kaneda, H., & Yamauchi, S. 2001, Science, 293, 1633
- Ebisawa et al. (2005) Ebisawa, K., et al. 2005, ApJ, 635, 214
- Figer (2008) Figer, D. F. 2008, in IAU Symposium, Vol. 250, IAU Symposium, ed. F. Bresolin, P. A. Crowther, & J. Puls, 247–256
- Fornasini et al. (2014) Fornasini, F. M., et al. 2014, ApJ, 796, 105
- Güver & Özel (2009) Güver, T., & Özel, F. 2009, MNRAS, 400, 2050
- Hanson et al. (1996) Hanson, M. M., Conti, P. S., & Rieke, M. J. 1996, ApJS, 107, 281
- Helou & Walker (1988) Helou, G., & Walker, D. W., eds. 1988, Infrared astronomical satellite (IRAS) catalogs and atlases. Volume 7: The small scale structure catalog, Vol. 7
- Martins & Plez (2006) Martins, F., & Plez, B. 2006, A&A, 457, 637
- Martins et al. (2005) Martins, F., Schaerer, D., & Hillier, D. J. 2005, A&A, 436, 1049
- Minniti et al. (2010) Minniti, D., et al. 2010, New Astronomy, 15, 433
- Muno et al. (2006a) Muno, M. P., Law, C., Clark, J. S., Dougherty, S. M., de Grijs, R., Portegies Zwart, S., & Yusef-Zadeh, F. 2006a, ApJ, 650, 203
- Muno et al. (2006b) Muno, M. P., et al. 2006b, ApJ, 636, L41
- Murphy et al. (2007) Murphy, T., Mauch, T., Green, A., Hunstead, R. W., Piestrzynska, B., Kels, A. P., & Sztajer, P. 2007, MNRAS, 382, 382
- Pearson (1900) Pearson, K. 1900, Philosophical Magazine Series 5, 50, 157
- Portegies Zwart et al. (2010) Portegies Zwart, S. F., McMillan, S. L. W., & Gieles, M. 2010, ARA&A, 48, 431
- Portegies Zwart et al. (2007) Portegies Zwart, S. F., McMillan, S. L. W., & Makino, J. 2007, MNRAS, 374, 95
- Rahoui et al. (2014) Rahoui, F., Tomsick, J. A., Fornasini, F. M., Bodaghee, A., & Bauer, F. E. 2014, A&A, 568, A54
- Ramírez Alegría et al. (2012) Ramírez Alegría, S., Marín-Franch, A., & Herrero, A. 2012, A&A, 541, A75
- Rauw et al. (2014) Rauw, G., et al. 2014, ArXiv e-prints: 1401.8098
- Romano et al. (2011) Romano, P., et al. 2011, MNRAS, 410, 1825
- Russeil (2003) Russeil, D. 2003, A&A, 397, 133
- Skinner et al. (2006) Skinner, S. L., Simmons, A. E., Zhekov, S. A., Teodoro, M., Damineli, A., & Palla, F. 2006, ApJ, 639, L35
- Skrutskie et al. (2006) Skrutskie, M. F., et al. 2006, AJ, 131, 1163
- Spitzer Science (2009) Spitzer Science, C. 2009, VizieR Online Data Catalog, 2293, 0
- Stead & Hoare (2009) Stead, J. J., & Hoare, M. G. 2009, MNRAS, 400, 731
- Stevens & Hartwell (2003) Stevens, I. R., & Hartwell, J. M. 2003, MNRAS, 339, 280
- Townsley et al. (2011a) Townsley, L. K., Broos, P. S., Chu, Y.-H., Gruendl, R. A., Oey, M. S., & Pittard, J. M. 2011a, ApJS, 194, 16
- Townsley et al. (2011b) Townsley, L. K., et al. 2011b, ApJS, 194, 1
- Townsley et al. (2011c) —. 2011c, ApJS, 194, 15
- van den Heuvel et al. (2000) van den Heuvel, E. P. J., Portegies Zwart, S. F., Bhattacharya, D., & Kaper, L. 2000, A&A, 364, 563
- Wilms et al. (2000) Wilms, J., Allen, A., & McCray, R. 2000, ApJ, 542, 914
| aaColumn density in units of cm-2. | bbPhoton index of the power law model. | ccPlasma temperature (keV) for the apec model. | norm.ddModel normalization (). | C-stat./goodnesseeGoodness of fit defined as the percentage of simulated spectra (of 10,000 trials) which return a statistic smaller than the observed value. | ffNet source counts in the soft () band: 0.5–3 keV. | ggNet source counts in the hard () band: 3–10 keV. | HRhhHardness ratio defined as . | obs. fluxiiObserved flux (i.e., not corrected for absorption) in units of erg cm-2 s-1 in the 0.5–10 keV band. | unabs. fluxjjAbsorption-corrected flux in units of erg cm-2 s-1 in the 0.5–10 keV band. | |
|---|---|---|---|---|---|---|---|---|---|---|
| VVV CL077: 15′′ extraction radius centered on IR position of Borissova et al. (2011) | ||||||||||
| — | 5.4 | 73% | 486 | 5910 | 0.100.11 | |||||
| — | 9.9 | 78% | — | — | — | |||||
| VVV CL077 diffuse emission: annulus with 6′′–125 radii centered between CXOU J163447.8473243 and CXOU J163448.0473246 | ||||||||||
| — | 1.4 | 73% | 165 | 287 | 0.270.20 | |||||
| — | 5.4 | 82% | — | — | — | |||||
| VVV CL077 inner core: circle with 6′′ radius centered between CXOU J163447.8473243 and CXOU J163448.0473246 | ||||||||||
| — | 9.2 | 61% | 185 | 225 | 0.100.18 | |||||
| — | 16.8 | 70% | — | — | — | |||||
| CXOU J163448.5473229 (catalog ): circle with 6′′ radius | ||||||||||
| — | 4.5 | 3% | 205 | 84 | 0.430.25 | |||||
| — | 8.2 | 2% | — | — | — | |||||
| name | counterpart | offset (′′) | 3.6 m | 4.5 m | 5.8 m | |||
|---|---|---|---|---|---|---|---|---|
| CXOU J163447.8473243 (catalog ) | —$\dagger$$\dagger$The nearest IR source with catalogued magnitudes, 2MASS J163447964732452 (catalog ), is away and is likely associated with CXOU J163448.0473246 (catalog ). | — | — | — | — | — | — | — |
| CXOU J163448.0473246 (catalog ) | 2MASS J163447964732452 (catalog ) | 1.2 | 14.4850.087 | 12.7000.137 | 11.2300.081 | — | — | — |
| DENIS J163447.9473245 (catalog ) | 0.8 | 14.100.11 | — | 11.120.07 | — | — | — | |
| VVV 515726976188 (catalog ) | 0.2 | 14.7310.005 | 13.4660.005 | — | — | — | — | |
| CXOU J163448.5473229 (catalog ) | 2MASS J163448504732297 (catalog ) | 0.3 | 13.7290.075 | 11.7720.075 | 10.7300.043 | — | — | — |
| VVV 515726978416 (catalog ) | 0.6 | 13.6470.002 | 11.8980.001 | — | — | — | — | |
| GLIMPSE G336.891400.0524 (catalog ) | 0.4 | — | — | — | 10.0520.048 | 9.8440.053 | 9.8180.103 |