Evolution of ferromagnetic and non-Fermi liquid state with doping: the case of Ru doped UCoGe
Abstract
We have investigated the impact of Ru substitution for Co on the behavior of the ferromagnetic superconductor UCoGe by performing x-ray diffraction, magnetization, specific heat and electrical resistivity measurements on polycrystalline samples of the series (). The initial Ru substitution up to leads to a simultaneous sharp increase of the Curie temperature and spontaneous magnetization up to maximum values of and per formula unit, respectively, whereas superconductivity vanishes already for . Further increase of the Ru content beyond leads to a precipitous decrease of both, and towards a ferromagnetic quantum critical point (QCP) at . Consequently the magnetic phase diagram consists of a well-developed ferromagnetic dome. We discuss the evolution of ferromagnetism with on the basis of band structure changes due to varying 5-ligand hybridization. This scenario is supported by the results of electronic structure calculations and consideration of the simplified periodic Anderson model. The analysis of the temperature dependencies of the electrical resistivity and heat capacity at low temperatures of the samples in the vicinity of the QCP reveals a non-Fermi liquid behavior and assigns the ferromagnetic quantum phase transition to be most likely of a continuous Hertz-Millis type.
pacs:
71.10.Hf, 74.40.Kb, 71.20.LpI Introduction
The phenomena emerging near a quantum critical point (QCP) belong to the most intensively studied topics of condensed matter physics. Diligent research in this field continuously brings brand new materials carrying completely novel properties. Such progress boosts development of new theoretical approaches describing electron correlations in these systems. A specific group of those intriguing materials comprises the uranium based ferromagnetic superconductors (FM SC) Saxena et al. (2000); Huxley et al. (2001), URhGeAoki et al. (2001) and UCoGeHuy et al. (2007a). In these compounds superconductivity and itinerant ferromagnetism are carried by the same uranium 5 electrons. It is a novelty distinguishing them from previously reported Uhlarz et al. (2004). , the first discovered case, is a model example of superconductivity (SC) induced by external pressure. Here SC appears and reaches a maximum on a boundary between two different FM phases under high pressure. URhGe and UCoGe are ambient pressure FM SC where both phenomena naturally coexist. A lot of effort both in theory and experiment has been done to explore the underlying mechanisms of the coexistence of FM and SC. Ferromagnetic spin fluctuations which appear in the vicinity of the QCP have been considered as the main essence for inducing unconventional spin-triplet SC statede Nijs et al. (2008); Stock et al. (2011); Hattori et al. (2012).
Quantum phase transitions (QPTs) were experimentally studied for a broad spectrum of materials like high- superconductorsMarel et al. (2003), ordinary metalsPfleiderer et al. (1997) or heavy-fermion compoundsSchroder et al. (2000). Most of such investigations have been carried out on antiferromagnets which by rule exhibit second-order QCP. Prominent examples are with an antiferromagnetic quantum critical point (AF QCP) which is induced by chemical dopingLohneysen et al. (1994) or where the AF QCP is achieved by applying external magnetic fieldCusters et al. (2003). Studies of quantum criticality in ferromagnets have been less frequent and manifest that here the situation may be much more complex. The ferromagnetic phase transition at finite Curie temperature () is by rule of a second order type. of itinerant electron ferromagnets is often easily suppressed to by external pressure or chemical composition . However, detailed experimental investigation of archetypal ferromagnetic metals such as MnSiPfleiderer et al. (1997), Uhlarz et al. (2004) or Huxley et al. (2001); Pfleiderer and Huxley (2002) has revealed that the ferromagnetic phase is suppressed to zero temperature at a first-order transition which would mean that no QCP is observed. This can be elucidated theoretically either in terms of additional fermionic modes which may couple to the critical ferromagnetic fluctuations driving the phase transition to a first-order typeBelitz et al. (1999) or that a first-order magnetic phase transition may be induced by strong magneto-elastic couplingMineev (2011). No generic scenario can be drawn for the QPTs of the above mentioned materials because of rather individually different phenomena appearing in the quantum critical region. In particular MnSi becomes long-period helimagnet (showing ferromagnetism only locally) in which the thermal phase transition is weakly first-orderJanoschek et al. (2013), exhibits strong uniaxial anisotropyMenovsky et al. (1983) and exhibits a marginal Fermi liquid ground stateSutherland et al. (2012).
UCoGe, the subject of the present study, is unique in the group of FM SC due to the much lower energy scale on which the magnetism appearsAoki and Flouquet (2012). The low Curie temperature of UCoGe is only Huy et al. (2007a); Gasparini et al. (2010a) together with the tiny spontaneous magnetization of per formula unit (f.u.) indicate that UCoGe is close to a ferromagnetic instabilityAoki et al. (2009). It has been observed, however, that the Ru and Fe substitution for Co rapidly stabilizes the ferromagnetic statePospisil et al. (2009), despite the fact that URuGe and UFeGe behave like Pauli paramagnets down to the lowest temperaturesTroc and Tran (1988). Similar increase of was reported in the case of the initial substitution of Co and Ru for Rh in URhGeHuy and de Visser (2009); Huy et al. (2007b) with the development of a non-Fermi liquid (NFL) state on the higher doping boundary of the FM domeHuy et al. (2007b). These observations motivated us to inspect the development of the magnetic as well as electrical and thermal transport properties in the series over the entire concentration range (). Our study is based on extensive investigation of the crystal structure, magnetization, AC magnetic susceptibility, specific heat and electrical resistance of numerous polycrystalline samples with various Ru content. The results are discussed and compared with theoretical calculations and related models considering the leading role of the 5-ligand hybridization.
II Experimental Details
In order to study the development of the magnetic state in the system we have prepared a series of polycrystalline samples with different Ru concentrations between 0 and 0.9. All samples were prepared by arc-melting of the stoichiometric amounts of the elements (purity of Co 4N5, Ge 6N and Ru 3N5). U was purified by the Solid State Electrotransport technique (SSE)Pospisil et al. (2011) following previous experience with preparation of UCoGePospisil et al. (2011). The arc melting process was realized under protective Ar (6N purity) atmosphere on a water cooled Cu crucible. Each sample was three times turned upside down and subsequently re-melted in order to achieve the best homogeneity. All samples were separately wrapped into a Ta foil (99.99%), sealed in a quartz tube under the vacuum of , subsequently annealed at for 14 days and then slowly cooled down to room temperature to avoid creation of the internal stresses. Each sample was characterized by X-ray powder diffraction (XRPD) at room temperature on a Bruker D8 Advance diffractometer. The obtained data were evaluated by Rietveld techniqueRietveld (1969) using FullProf/WinPlotr softwareRodriguez-Carvajal (1993); Roisnel and Rodriguez-Carvajal with respect to the previously published crystallographic data of the UCoGeCanepa et al. (1996) and URuGeTroc and Tran (1988) compound. The chemical composition of our samples was verified by a scanning electron microscope (SEM) Tescan Mira I LMH equipped with an energy dispersive X-ray detector (EDX) Bruker AXS. Samples were afterward properly shaped for individual measurements with a fine wire saw to prevent induction of additional stresses and lattice defects. The electrical resistivity () was measured by the 4-probe method on bar-shape samples () and heat-capacity () measurements were performed on thin plates () by the relaxation method on PPMS9T and PPMS14T devices using a insert. Magnetization () measurements were done on cubic samples () using a MPMS7T device. The magnetization was evaluated in . For simplicity we omit “” everywhere throughout the paper.
The electronic structure calculations were performed on the basis of the density-functional theory (DFT) within the local-spin-density approximation (LSDA)Perdew and Wang (1992) and the generalized gradient approximation (GGA)Perdew et al. (1996). For this calculations we have used the full-potential augmented-plane-wave together with the local-orbitals method (APW+lo) as a part of the latest version (WIEN2k) of the original WIEN codeSchwarz et al. (2002).
III Results
III.1 X-ray diffraction
Both UCoGe and URuGe crystalize in the orthorhombic TiNiSi-type structure (space group Pnma)Canepa et al. (1996); Troc and Tran (1988) with the room-temperature cell parameters , , and , , , respectivelyCanepa et al. (1996); Troc and Tran (1988). The unit cell volume of UCoGe ()Canepa et al. (1996) is about 5% smaller than that of the URuGe compound ()Troc and Tran (1988). The XRPD patterns confirmed the orthorhombic TiNiSi-type structure of samples over the entire concentration range of the series.
The evaluated lattice parameters are listed in Table 1. The concentration dependence of all three lattice parameters and the unit volume reveals a linear behavior, i.e. obeying Vegard’s lawVegard (1921) (see Fig. 1).
| 0.10 | 6.8344 | 4.2188 | 7.2717 | 209.6671 |
| 0.20 | 6.8216 | 4.2267 | 7.3048 | 210.6173 |
| 0.21 | 6.8204 | 4.2261 | 7.3026 | 210.4879 |
| 0.22 | 6.8189 | 4.2279 | 7.3079 | 210.6840 |
| 0.23 | 6.8178 | 4.2272 | 7.3085 | 210.6325 |
| 0.24 | 6.8131 | 4.2280 | 7.3145 | 210.6999 |
| 0.25 | 6.8150 | 4.2320 | 7.3229 | 211.2003 |
| 0.26 | 6.8269 | 4.2385 | 7.3347 | 212.2355 |
| 0.27 | 6.8203 | 4.2363 | 7.3314 | 211.8247 |
| 0.28 | 6.8205 | 4.2390 | 7.3392 | 212.1890 |
| 0.29 | 6.8133 | 4.2373 | 7.3389 | 211.8711 |
| 0.30 | 6.8077 | 4.2373 | 7.3413 | 211.7662 |
| 0.40 | 6.7880 | 4.2454 | 7.3704 | 212.3984 |
| 0.50 | 6.7709 | 4.2577 | 7.4046 | 213.4669 |
| 0.60 | 6.7522 | 4.2710 | 7.4416 | 214.6050 |
| 0.70 | 6.7336 | 4.2868 | 7.4741 | 215.7451 |
| 0.80 | 6.7137 | 4.3015 | 7.5041 | 216.7105 |
| 0.90 | 6.6909 | 4.3212 | 7.5290 | 217.6849 |
While the lattice parameters and increase with increasing , the lattice parameter simultaneously decreases. The volume expansion seems to reflect the increase of the covalent radii from Co (126 pm) to Ru (146 pm)Cordero et al. (2008). Refinement of the diffraction patterns showed, that the Ru atoms really substitute the Co ones on their sites.
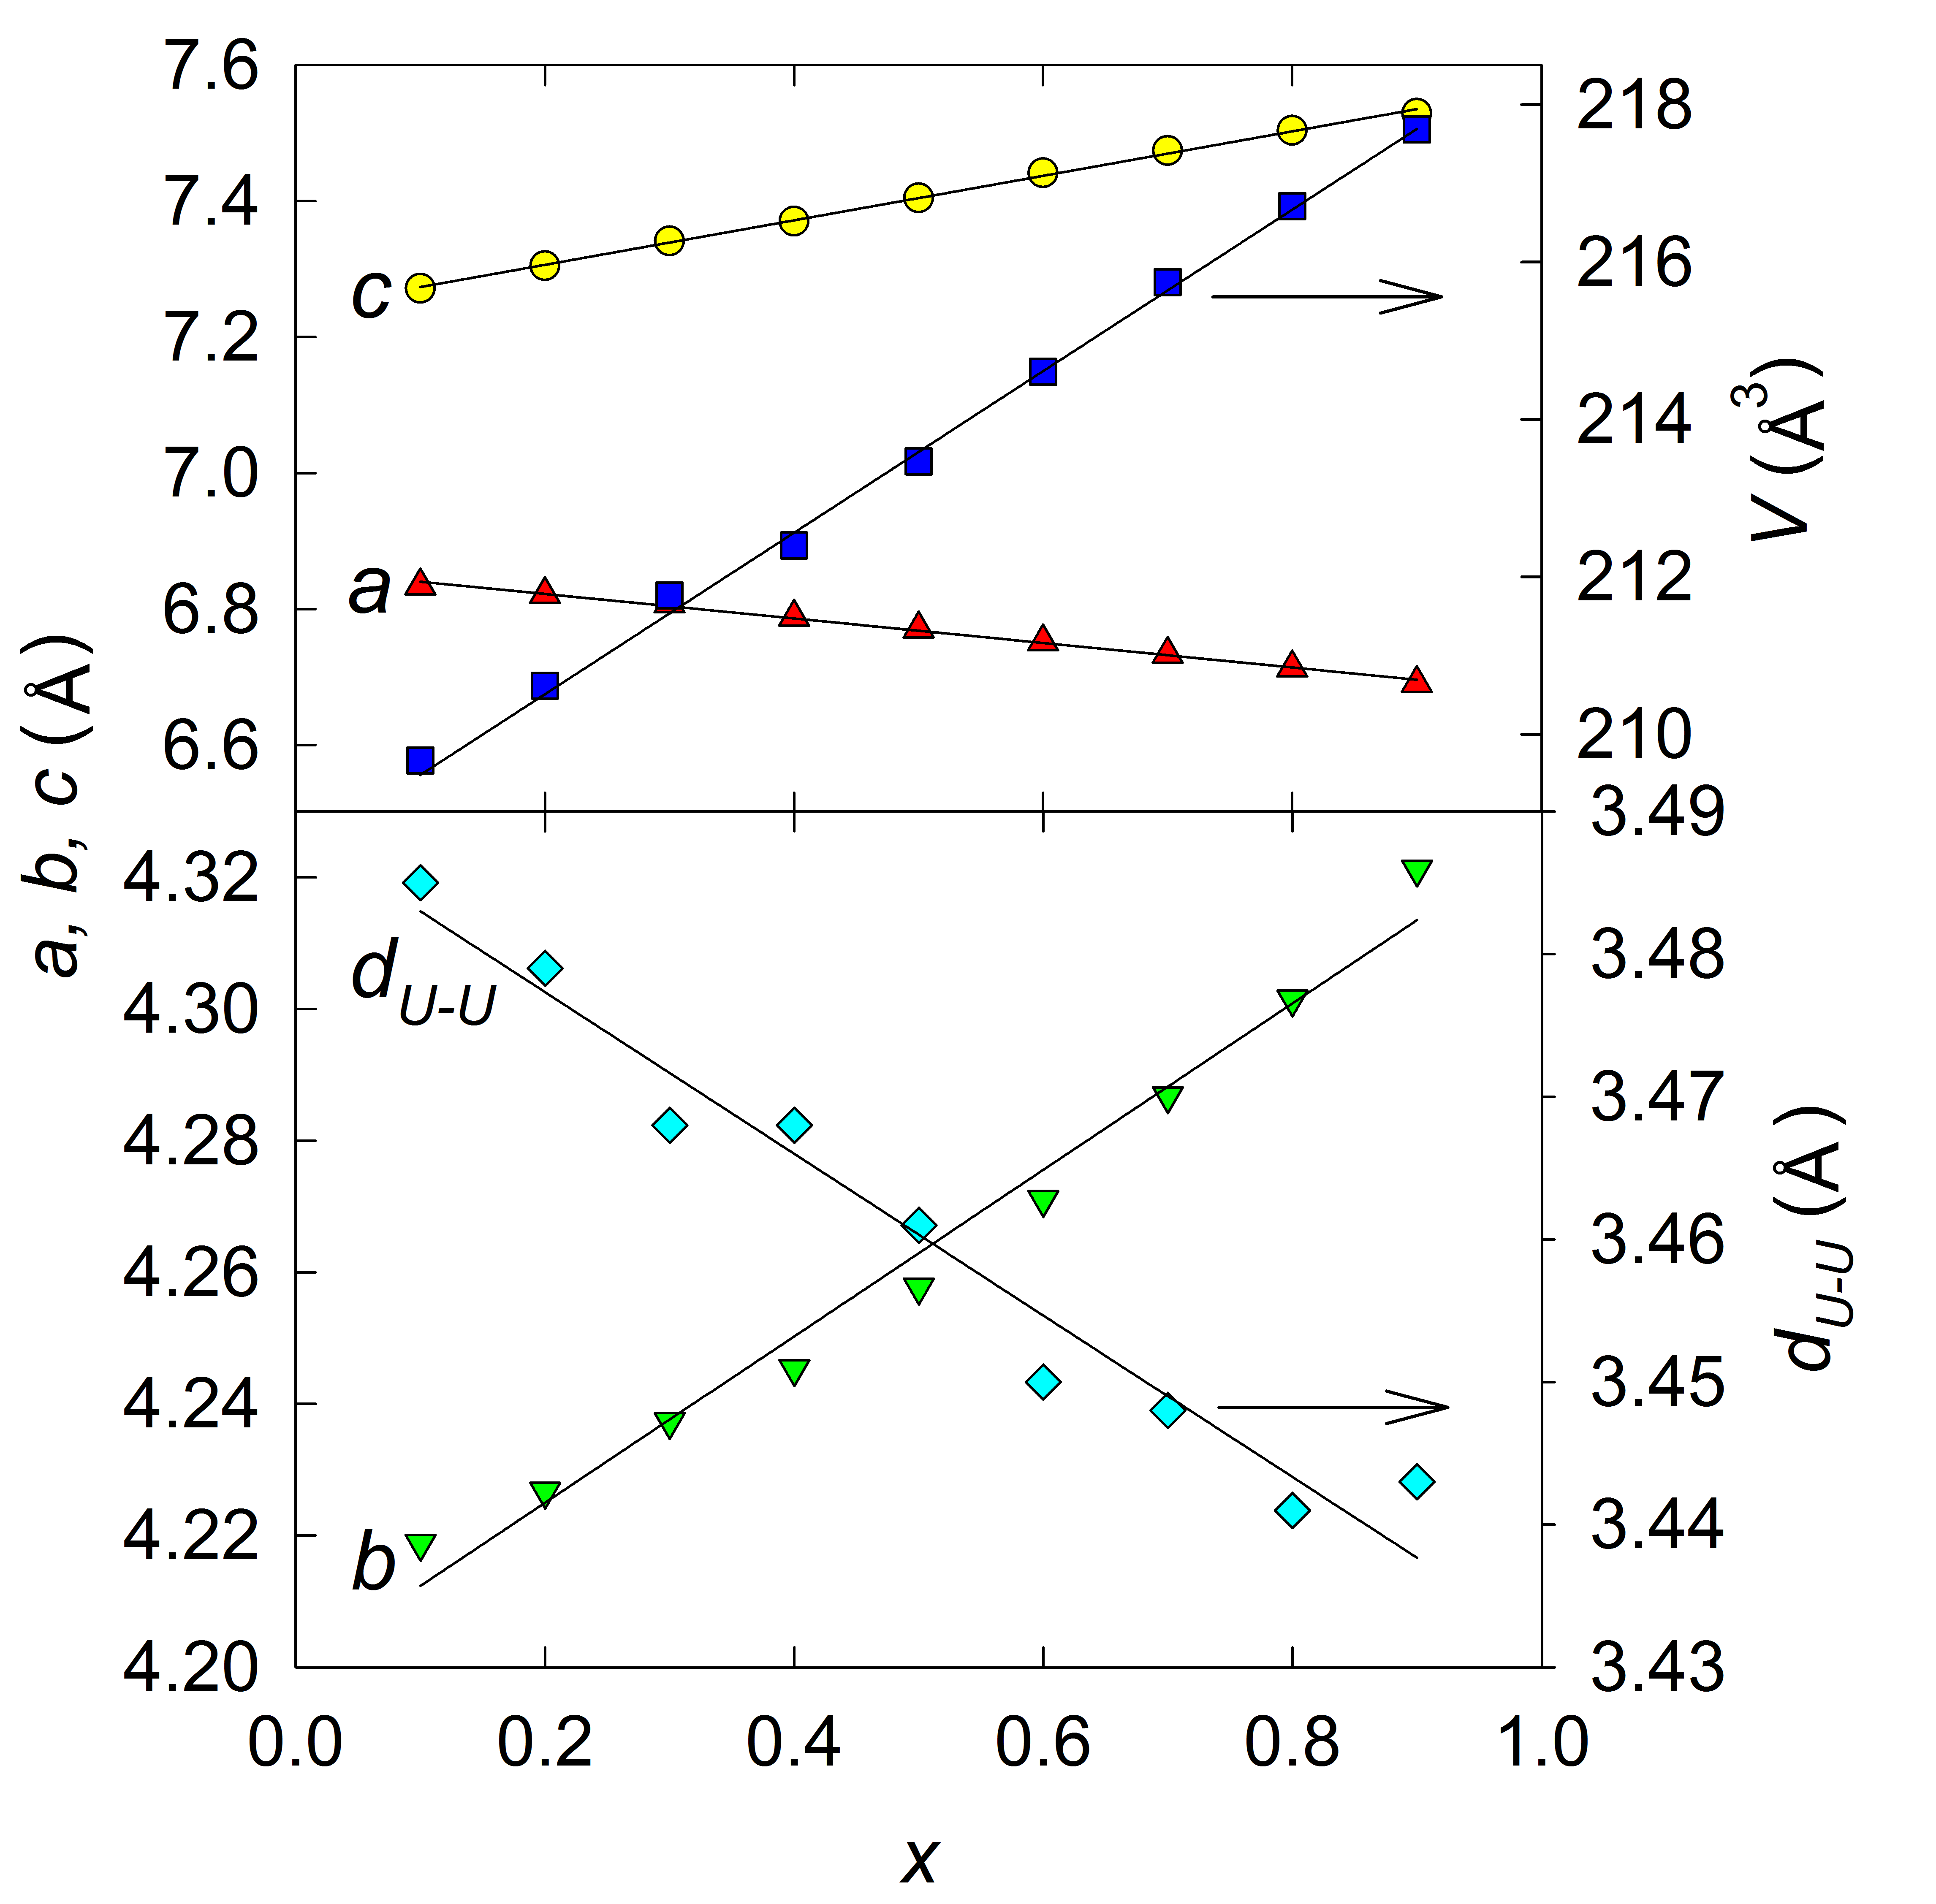
Although the unit cell volume expands with increasing Ru concentration the distance between the nearest-neighbor U ions contracts (see Fig.1). This result is not surprising because the lines form a chain meandering along the -axis.
III.2 Magnetization and AC-Susceptibility
We have measured the magnetization of each sample as a function of temperature and applied magnetic field. The values of have been estimated from the magnetization curves measured at (the lowest available temperature in our MPMS7T) by extrapolating the magnetization from high magnetic fields to .
The values of have been determined by several methods. Arrott plot analysis of magnetization data is widely considered as the most reliable methodArrott (1957). For this purpose the magnetization curves were measured at several temperatures in the vicinity of the expected . The Arrott plots obtained from our magnetization data are strongly nonlinear. These curves can be approximated by a third degree polynomial function (see a model example in Fig. 2). is determined as the temperature of the Arrott plot isotherm that would cross the axis at 0. An example of the relevant construction is shown in the inset of Fig. 2.
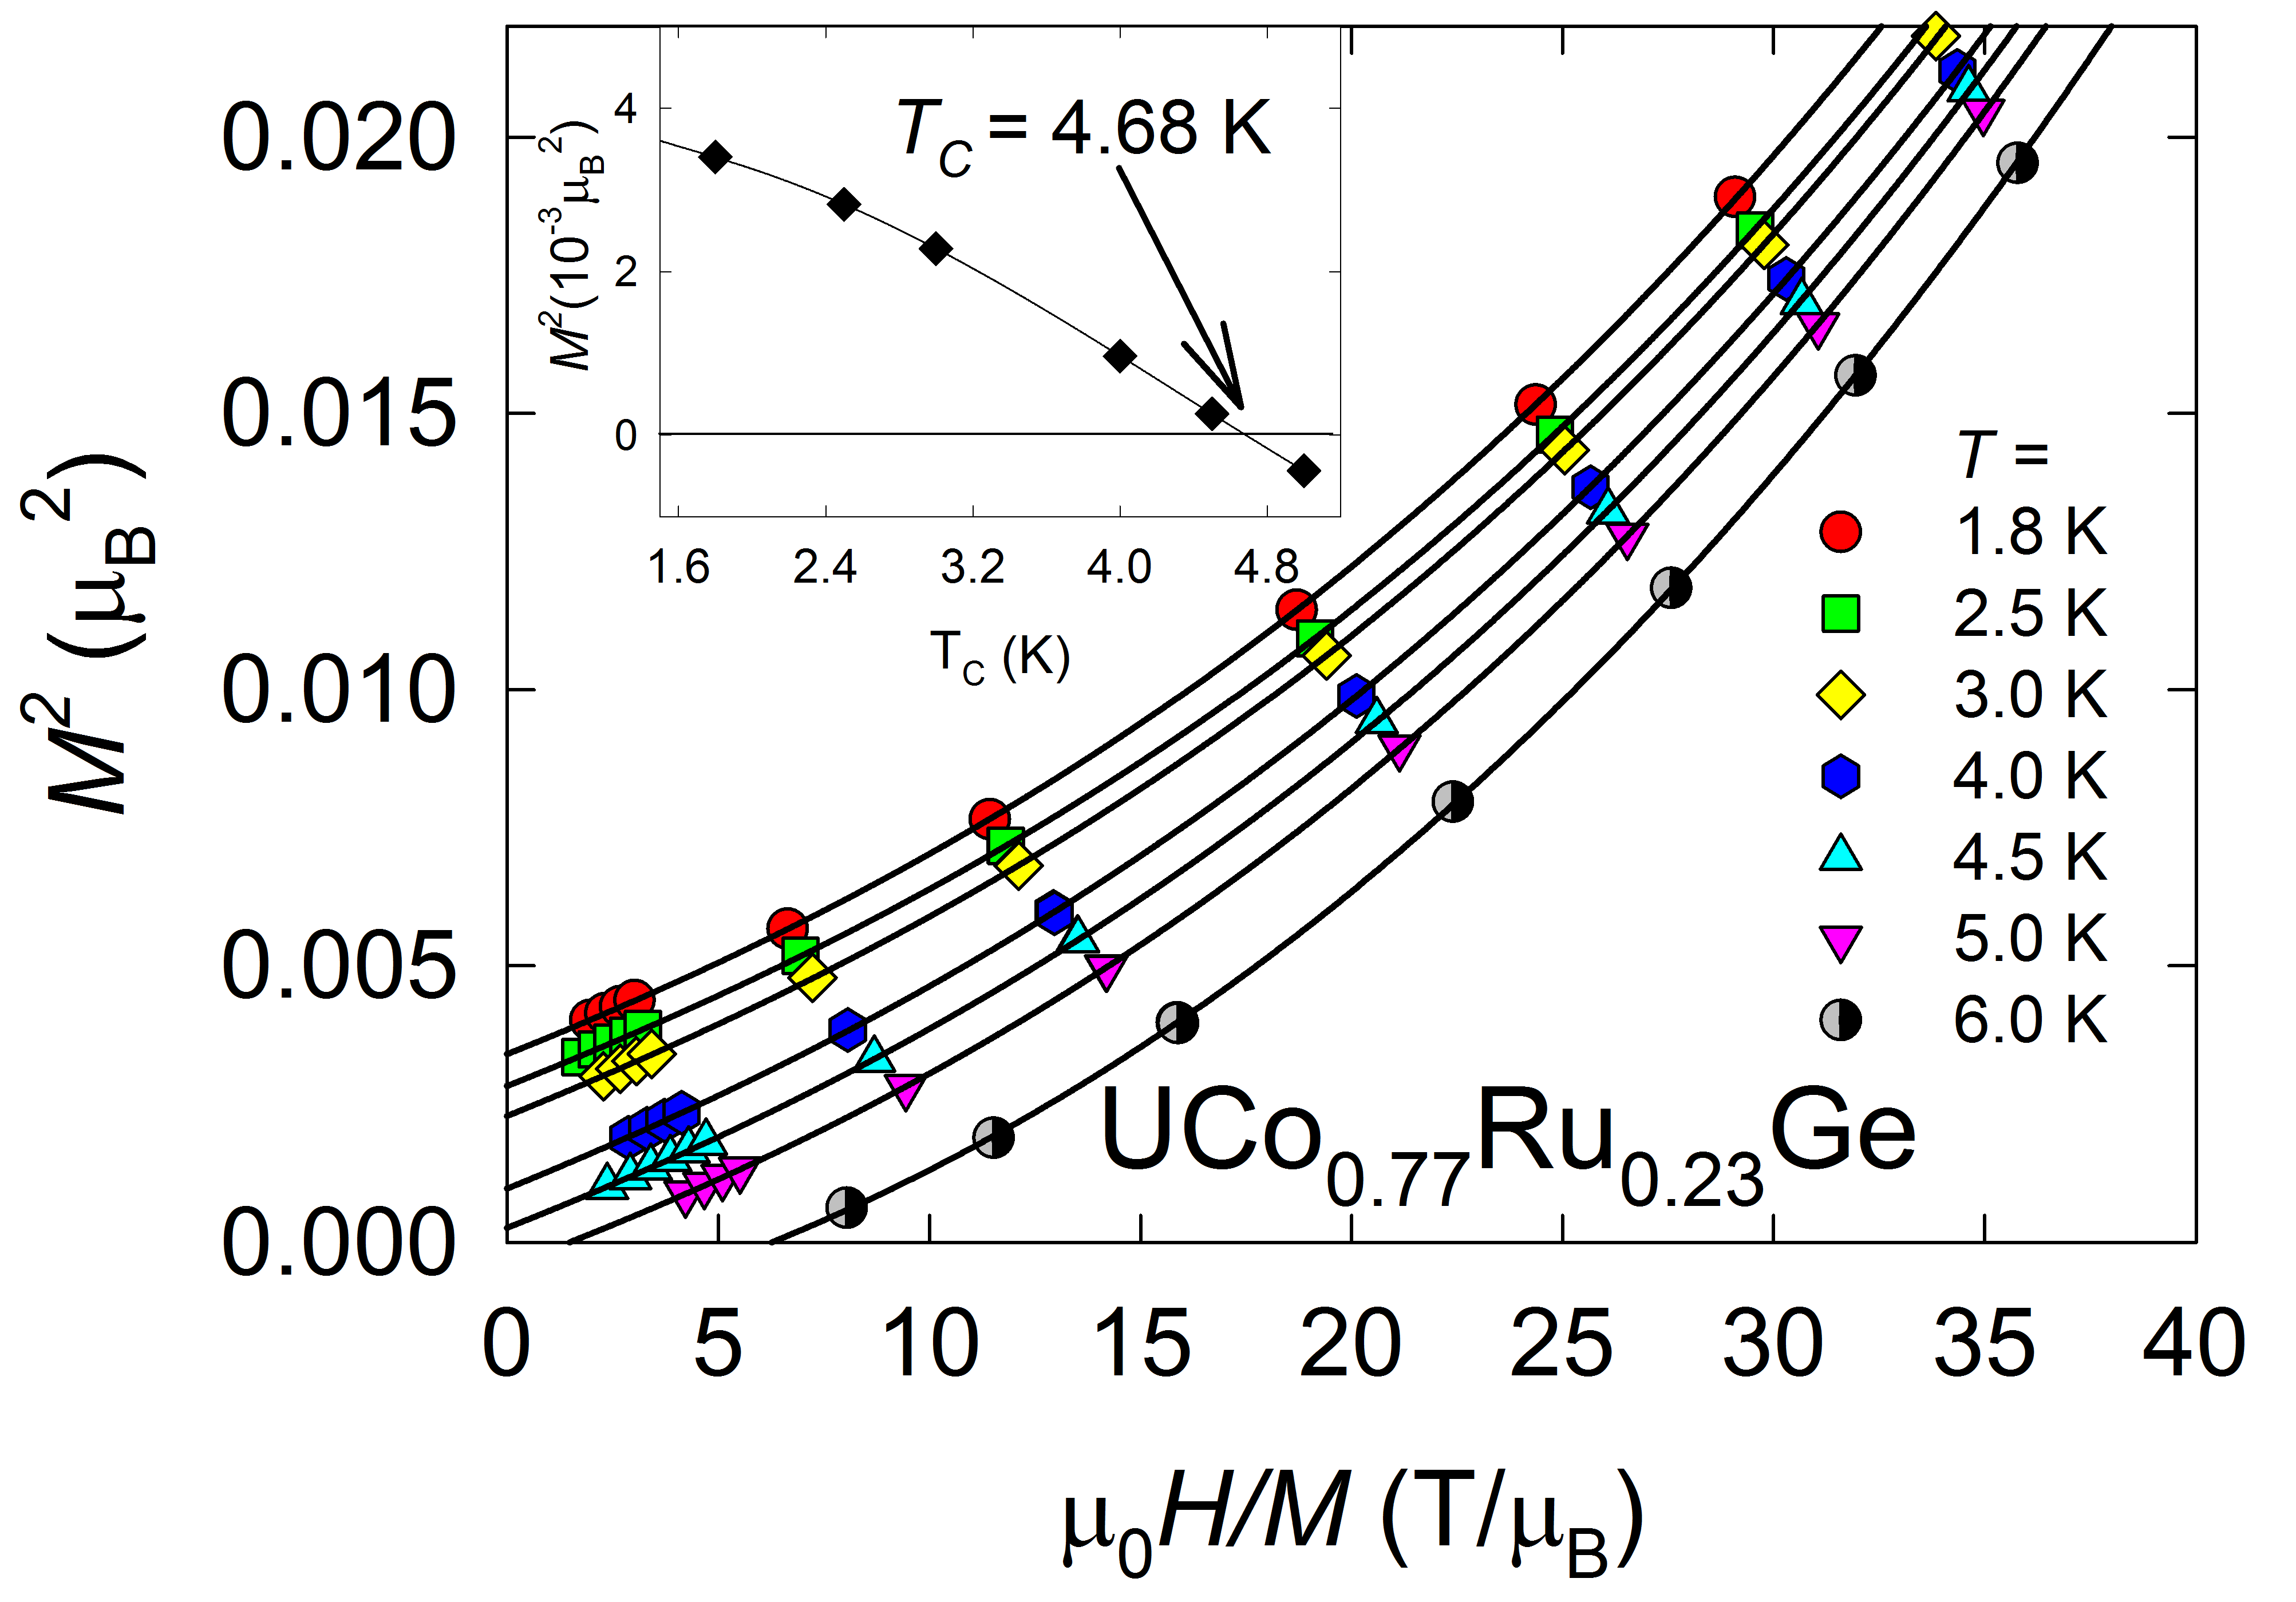
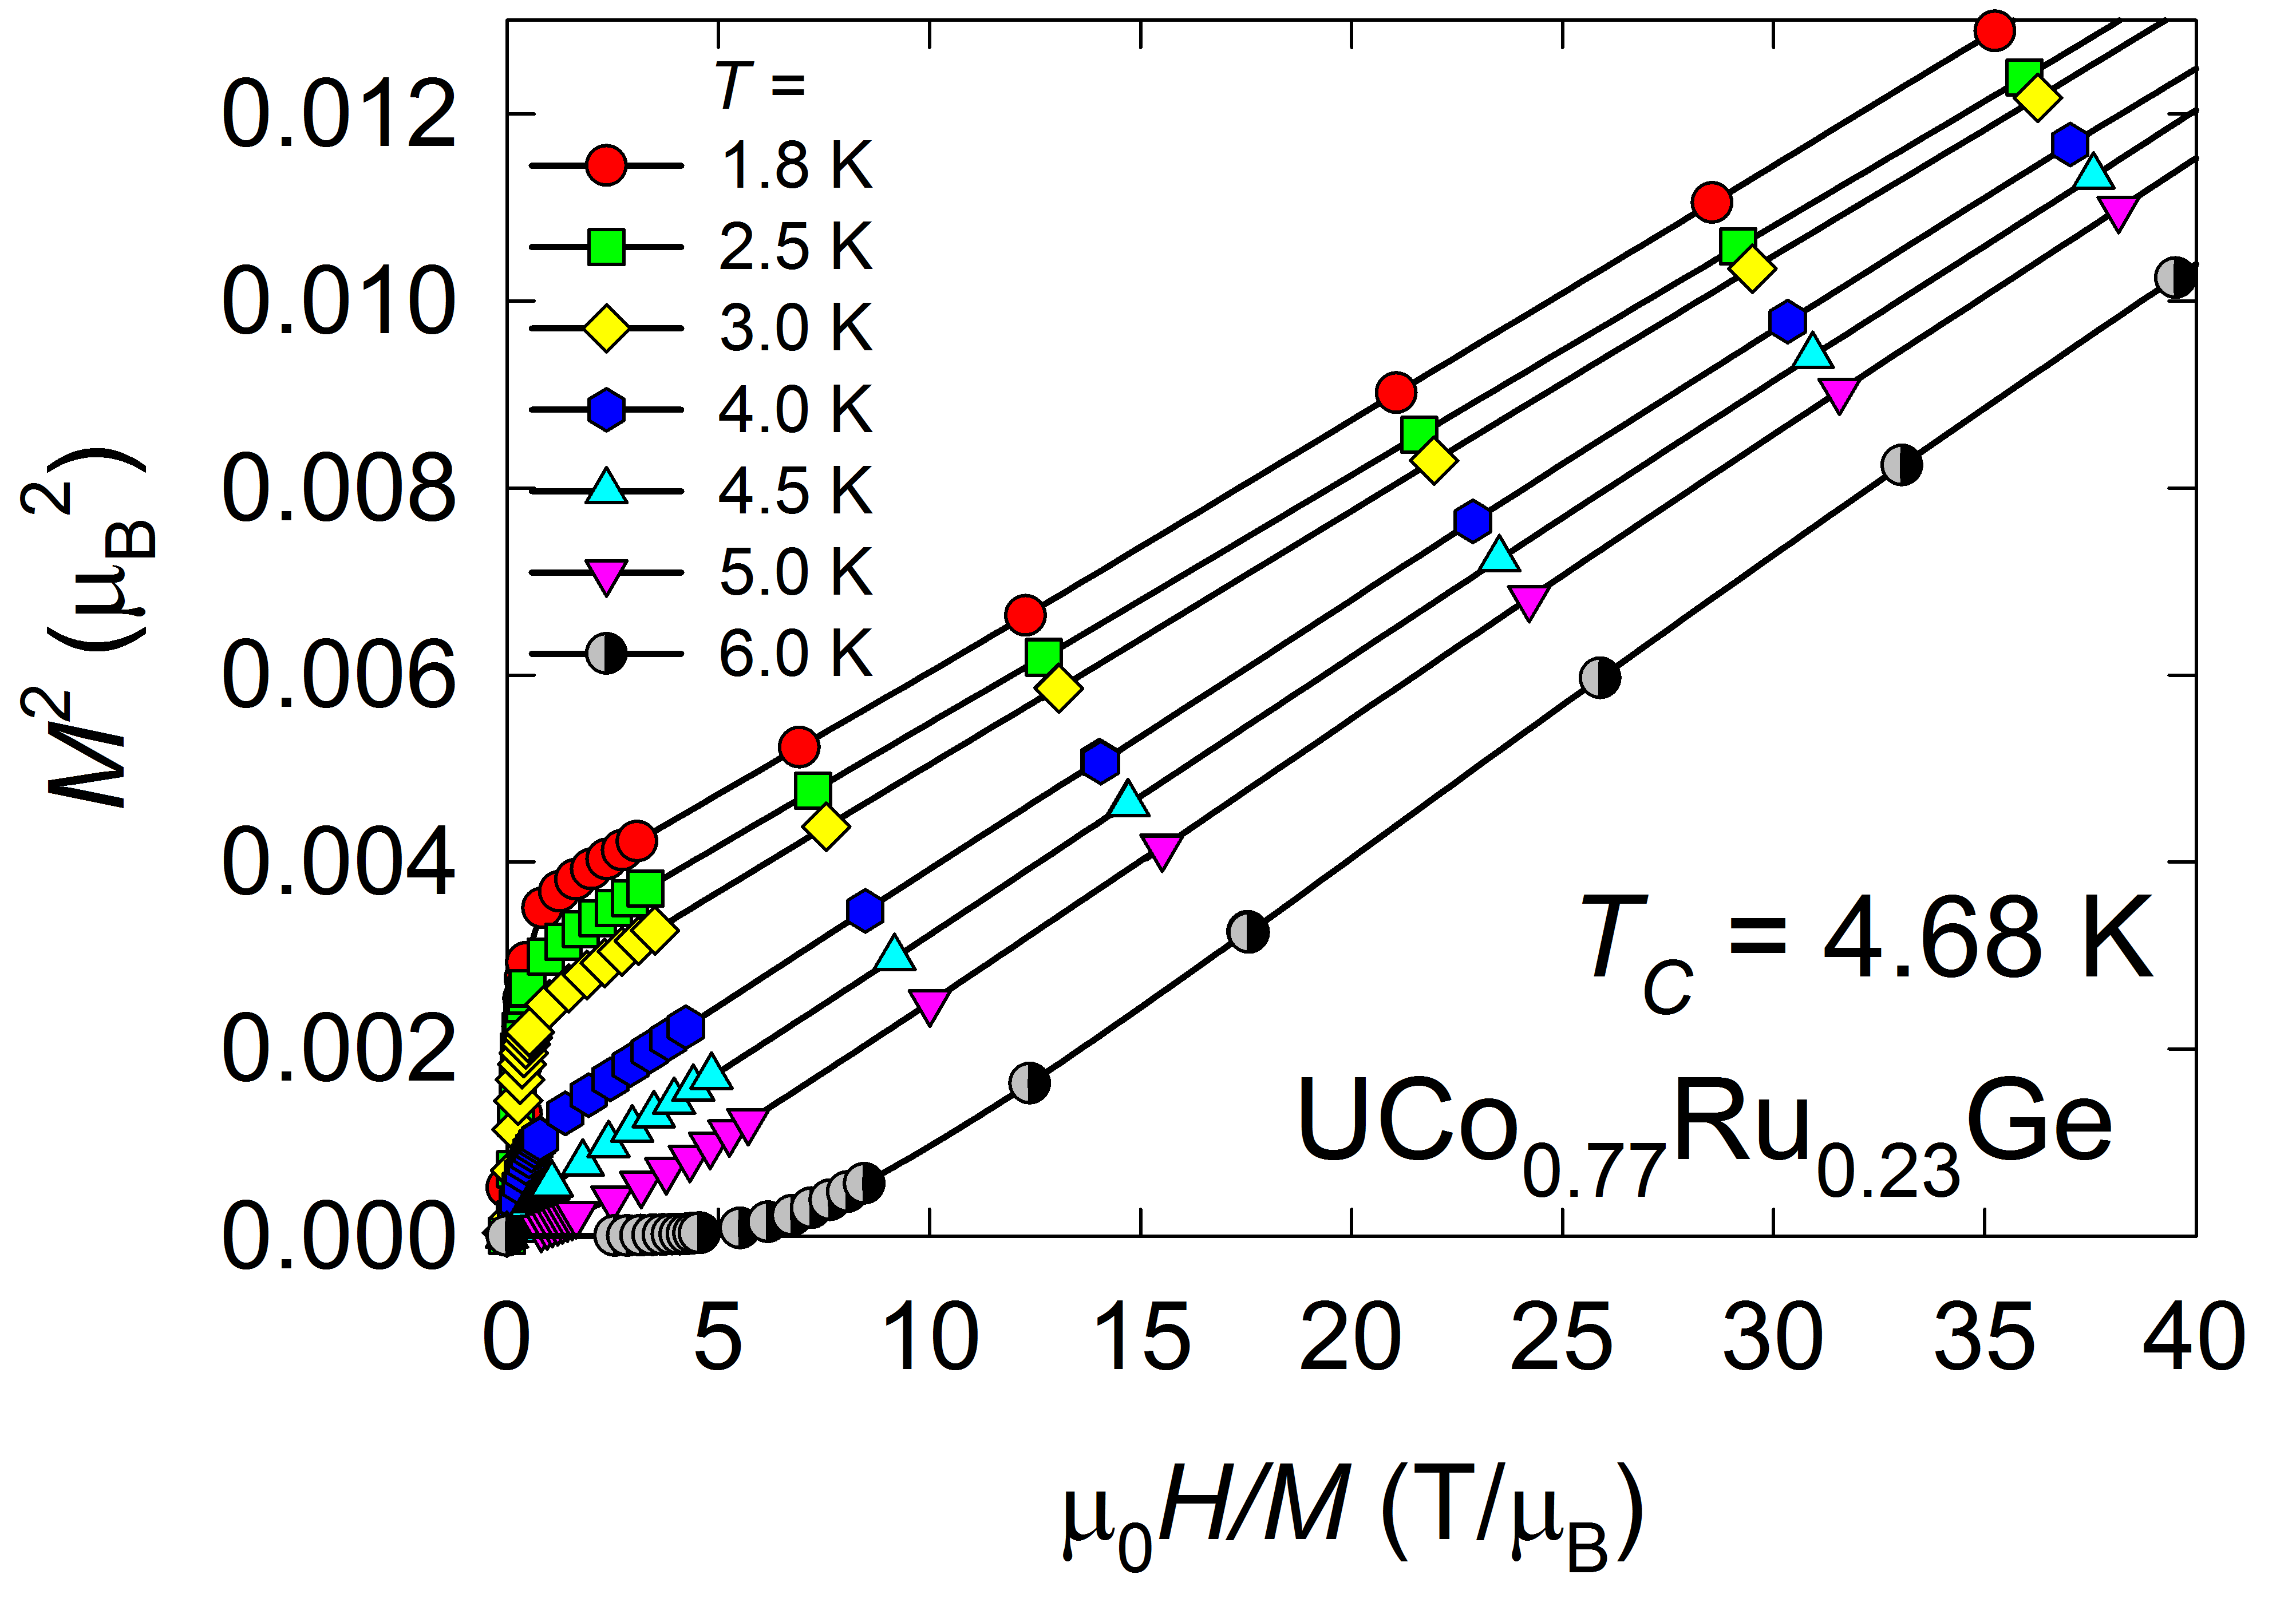
The nonlinearity of the Arrott plots (the cubic vs dependence) suggests presence of a magnetization component linearly dependent on the magnetic field. This is related to the fact that UCoGe and the other U compounds crystallizing in the orthorhombic TiNiSi-type structure exhibit strong uniaxial anisotropy with easy magnetization direction along the -axis. The hard magnetization directions within the plane are characteristic by a weak temperature-independent paramagnetic response with the magnetization proportional to the magnetic field. We have observed the same type of magnetocrystalline anisotropy for the ferromagnetic single crystals which we have grown as a part of another study (see Ref.Valiska et al. (2015)). Consequently the polycrystalline samples should show a corresponding linear component also in the ferromagnetic state. By subtracting a suitable linear term from measured magnetization data we obtain the corrected magnetization values . For the Arrott plots vs are indeed linear except the low-field part due to low-field magnetization processes and influence of a demagnetization field as can be seen for example in the case of the sample in Fig. 3.
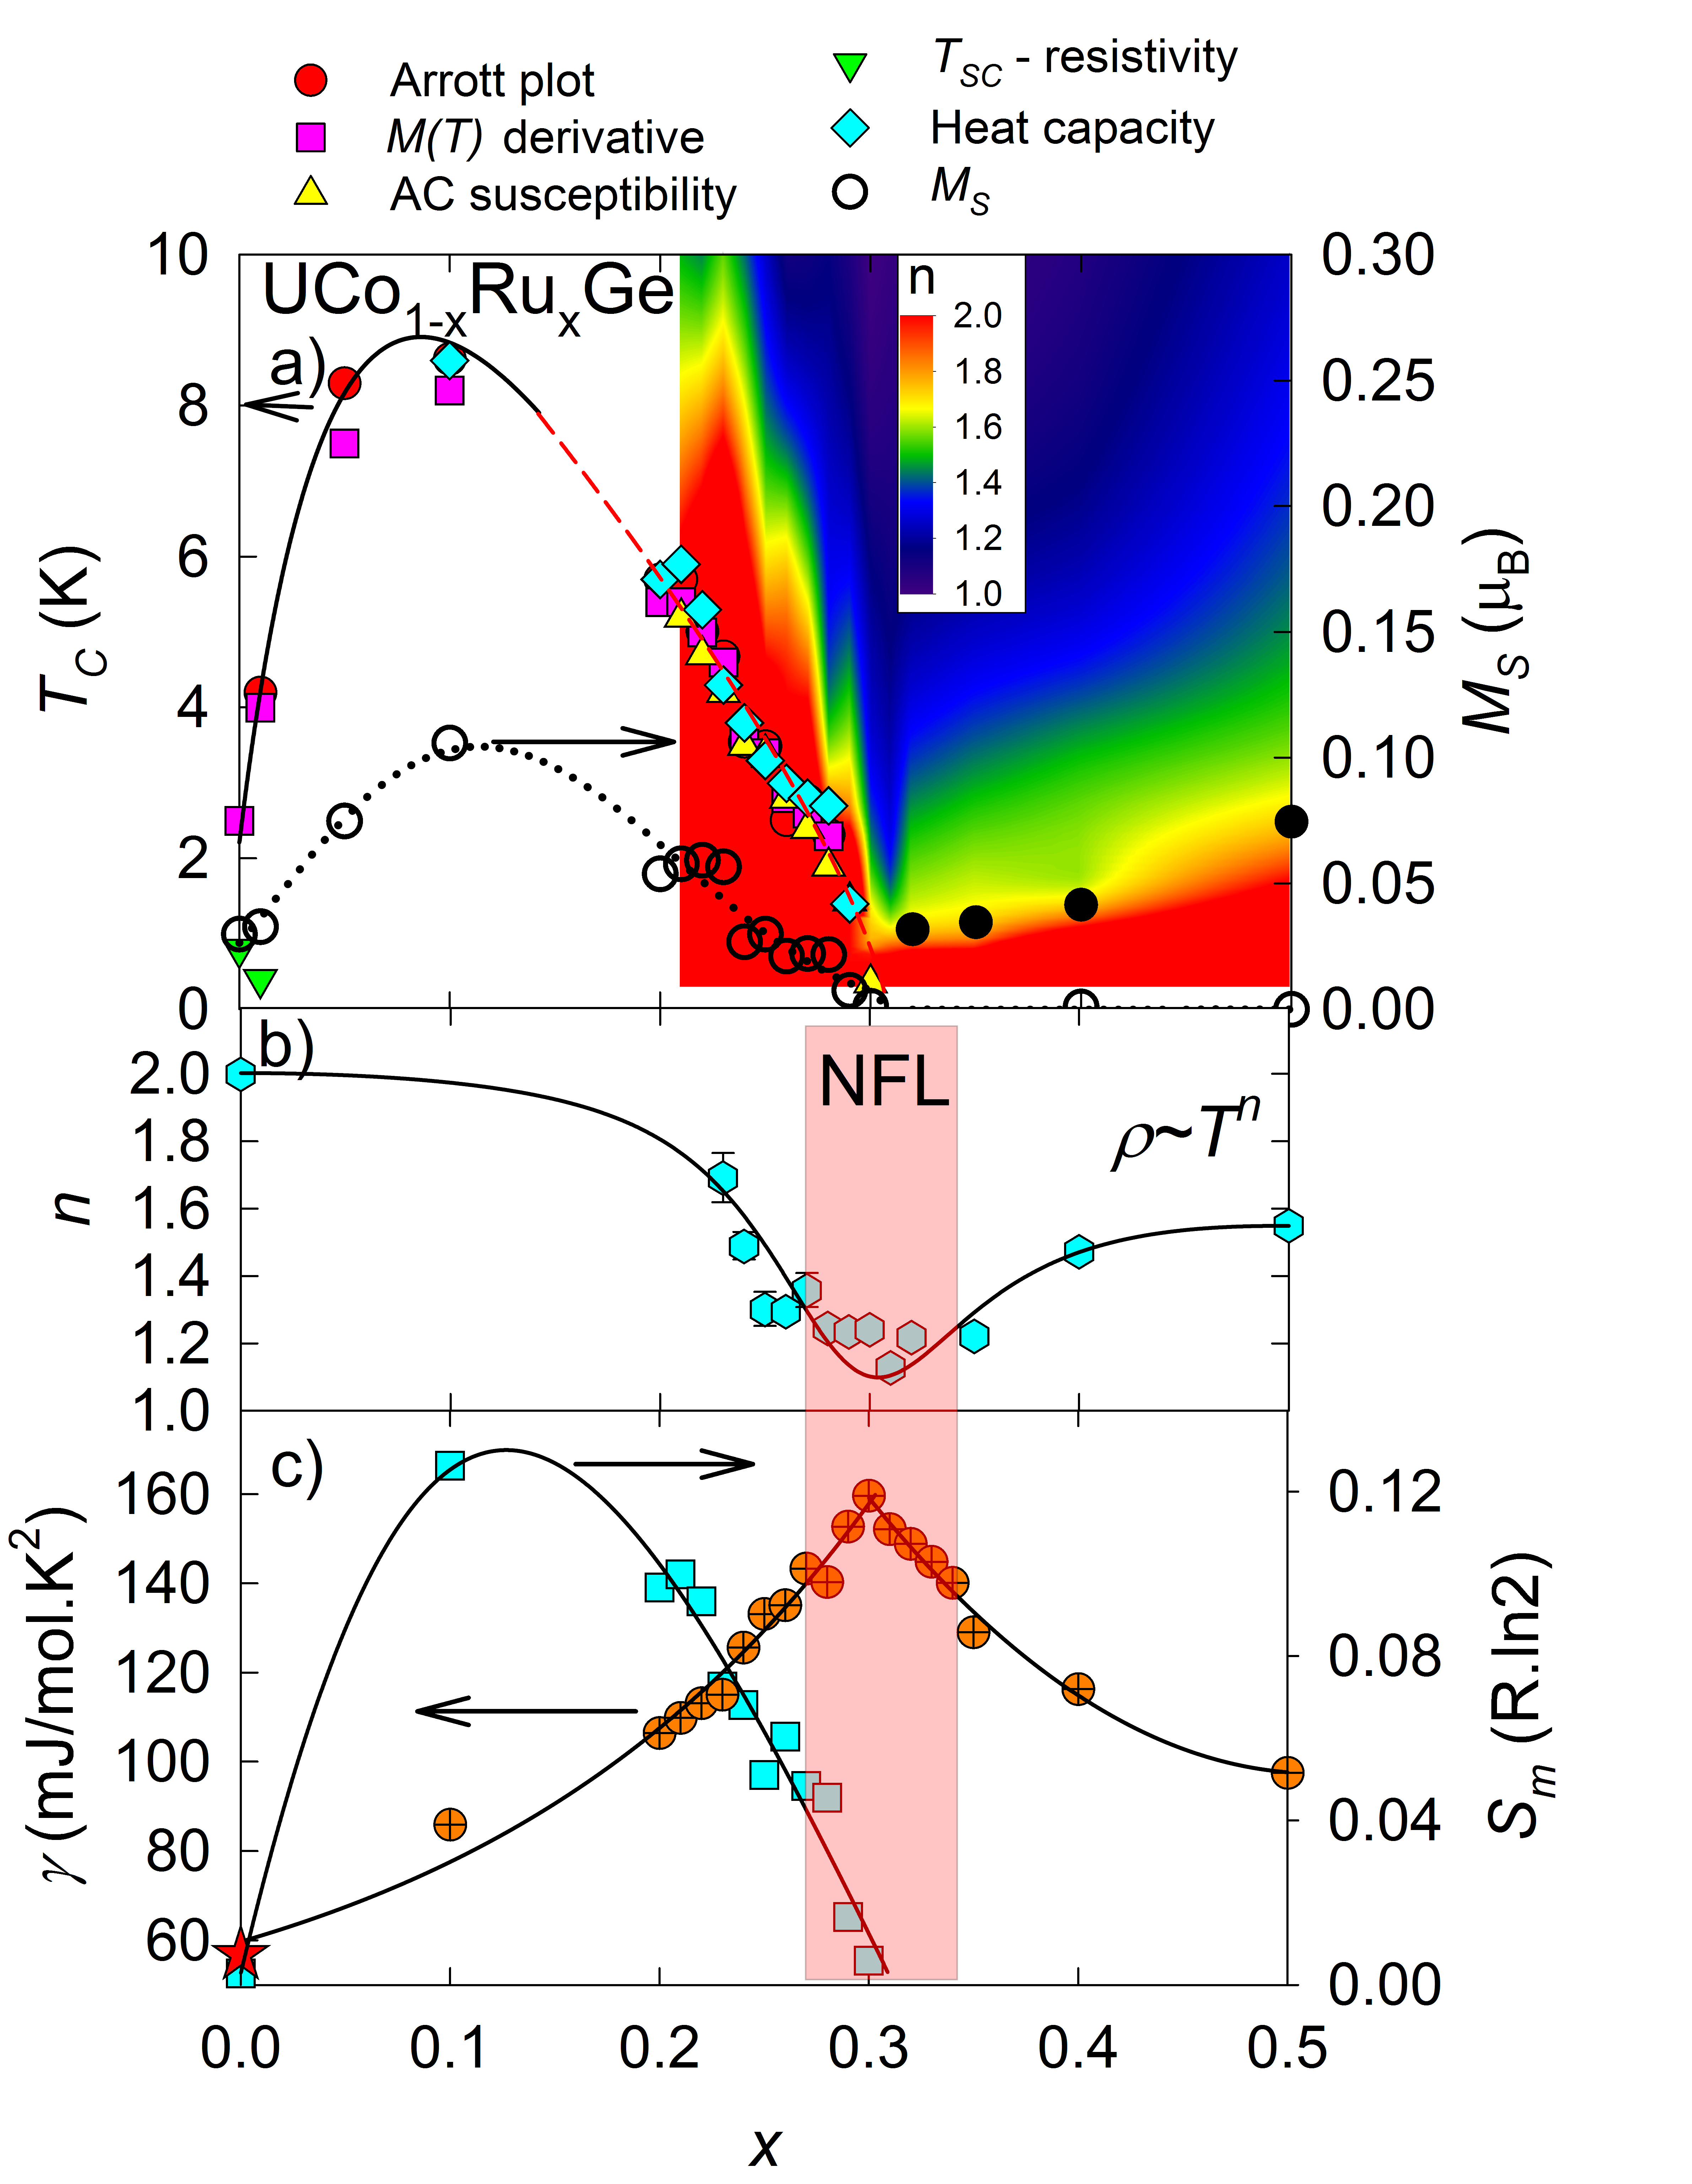
The obtained and values are listed for all samples in Table 2 and plotted in the complex phase diagram in Fig. 9(a). steeply increases with the initial Ru substitutions for Co which is in agreement with the results published in previous workPospisil et al. (2009). This trend terminates at where the ordering temperature reaches a maximum value of . This value is almost three times higher than of the parent compoundHuy et al. (2007a) and is comparable with the value found by Huang et al. in the case of the corresponding substitution of Fe for Co in UCoGeHuang et al. (2013). Increasing Ru concentration beyond is accompanied by a simultaneous decrease of and towards zero at the critical concentration . Thus, the ferromagnetic dome of the concentration dependence of in the magnetic phase diagram is intimately connected with a corresponding change of (see Fig. 9(a)).
| 0 | 0.0300 | - | - | 2.50 | - | - |
|---|---|---|---|---|---|---|
| 0.01 | 0.0330 | 4.20 | - | 4.00 | - | - |
| 0.05 | 0.0750 | 8.30 | - | 7.50 | - | - |
| 0.10 | 0.1060 | 8.62 | - | 8.20 | 8.60 | 0.0861 |
| 0.20 | 0.0540 | 5.70 | - | 5.40 | 5.70 | 0.1066 |
| 0.21 | 0.0580 | 5.70 | 5.20 | 5.40 | 5.90 | 0.1100 |
| 0.22 | 0.0594 | 5.01 | 4.70 | 5.00 | 5.30 | 0.1133 |
| 0.23 | 0.0568 | 4.68 | 4.20 | 4.60 | 4.30 | 0.1152 |
| 0.24 | 0.0270 | 3.55 | 3.50 | 3.60 | 3.80 | 0.1258 |
| 0.25 | 0.0300 | 3.49 | 3.40 | 3.40 | 3.30 | 0.1333 |
| 0.26 | 0.0213 | 2.51 | 2.80 | 2.80 | 3.00 | 0.1353 |
| 0.27 | 0.0223 | 2.77 | 2.40 | 2.60 | 2.80 | 0.1435 |
| 0.28 | 0.0219 | 2.32 | 1.90 | 2.30 | 2.70 | 0.1405 |
| 0.29 | 0.0077 | - | 1.44 | - | 1.40 | 0.1529 |
| 0.30 | 0.0013 | - | - | - | 0.1598 | |
| 0.40 | 0.0011 | - | - | - | - | 0.1523 |
| 0.50 | 0.0001 | - | - | - | - | 0.1490 |
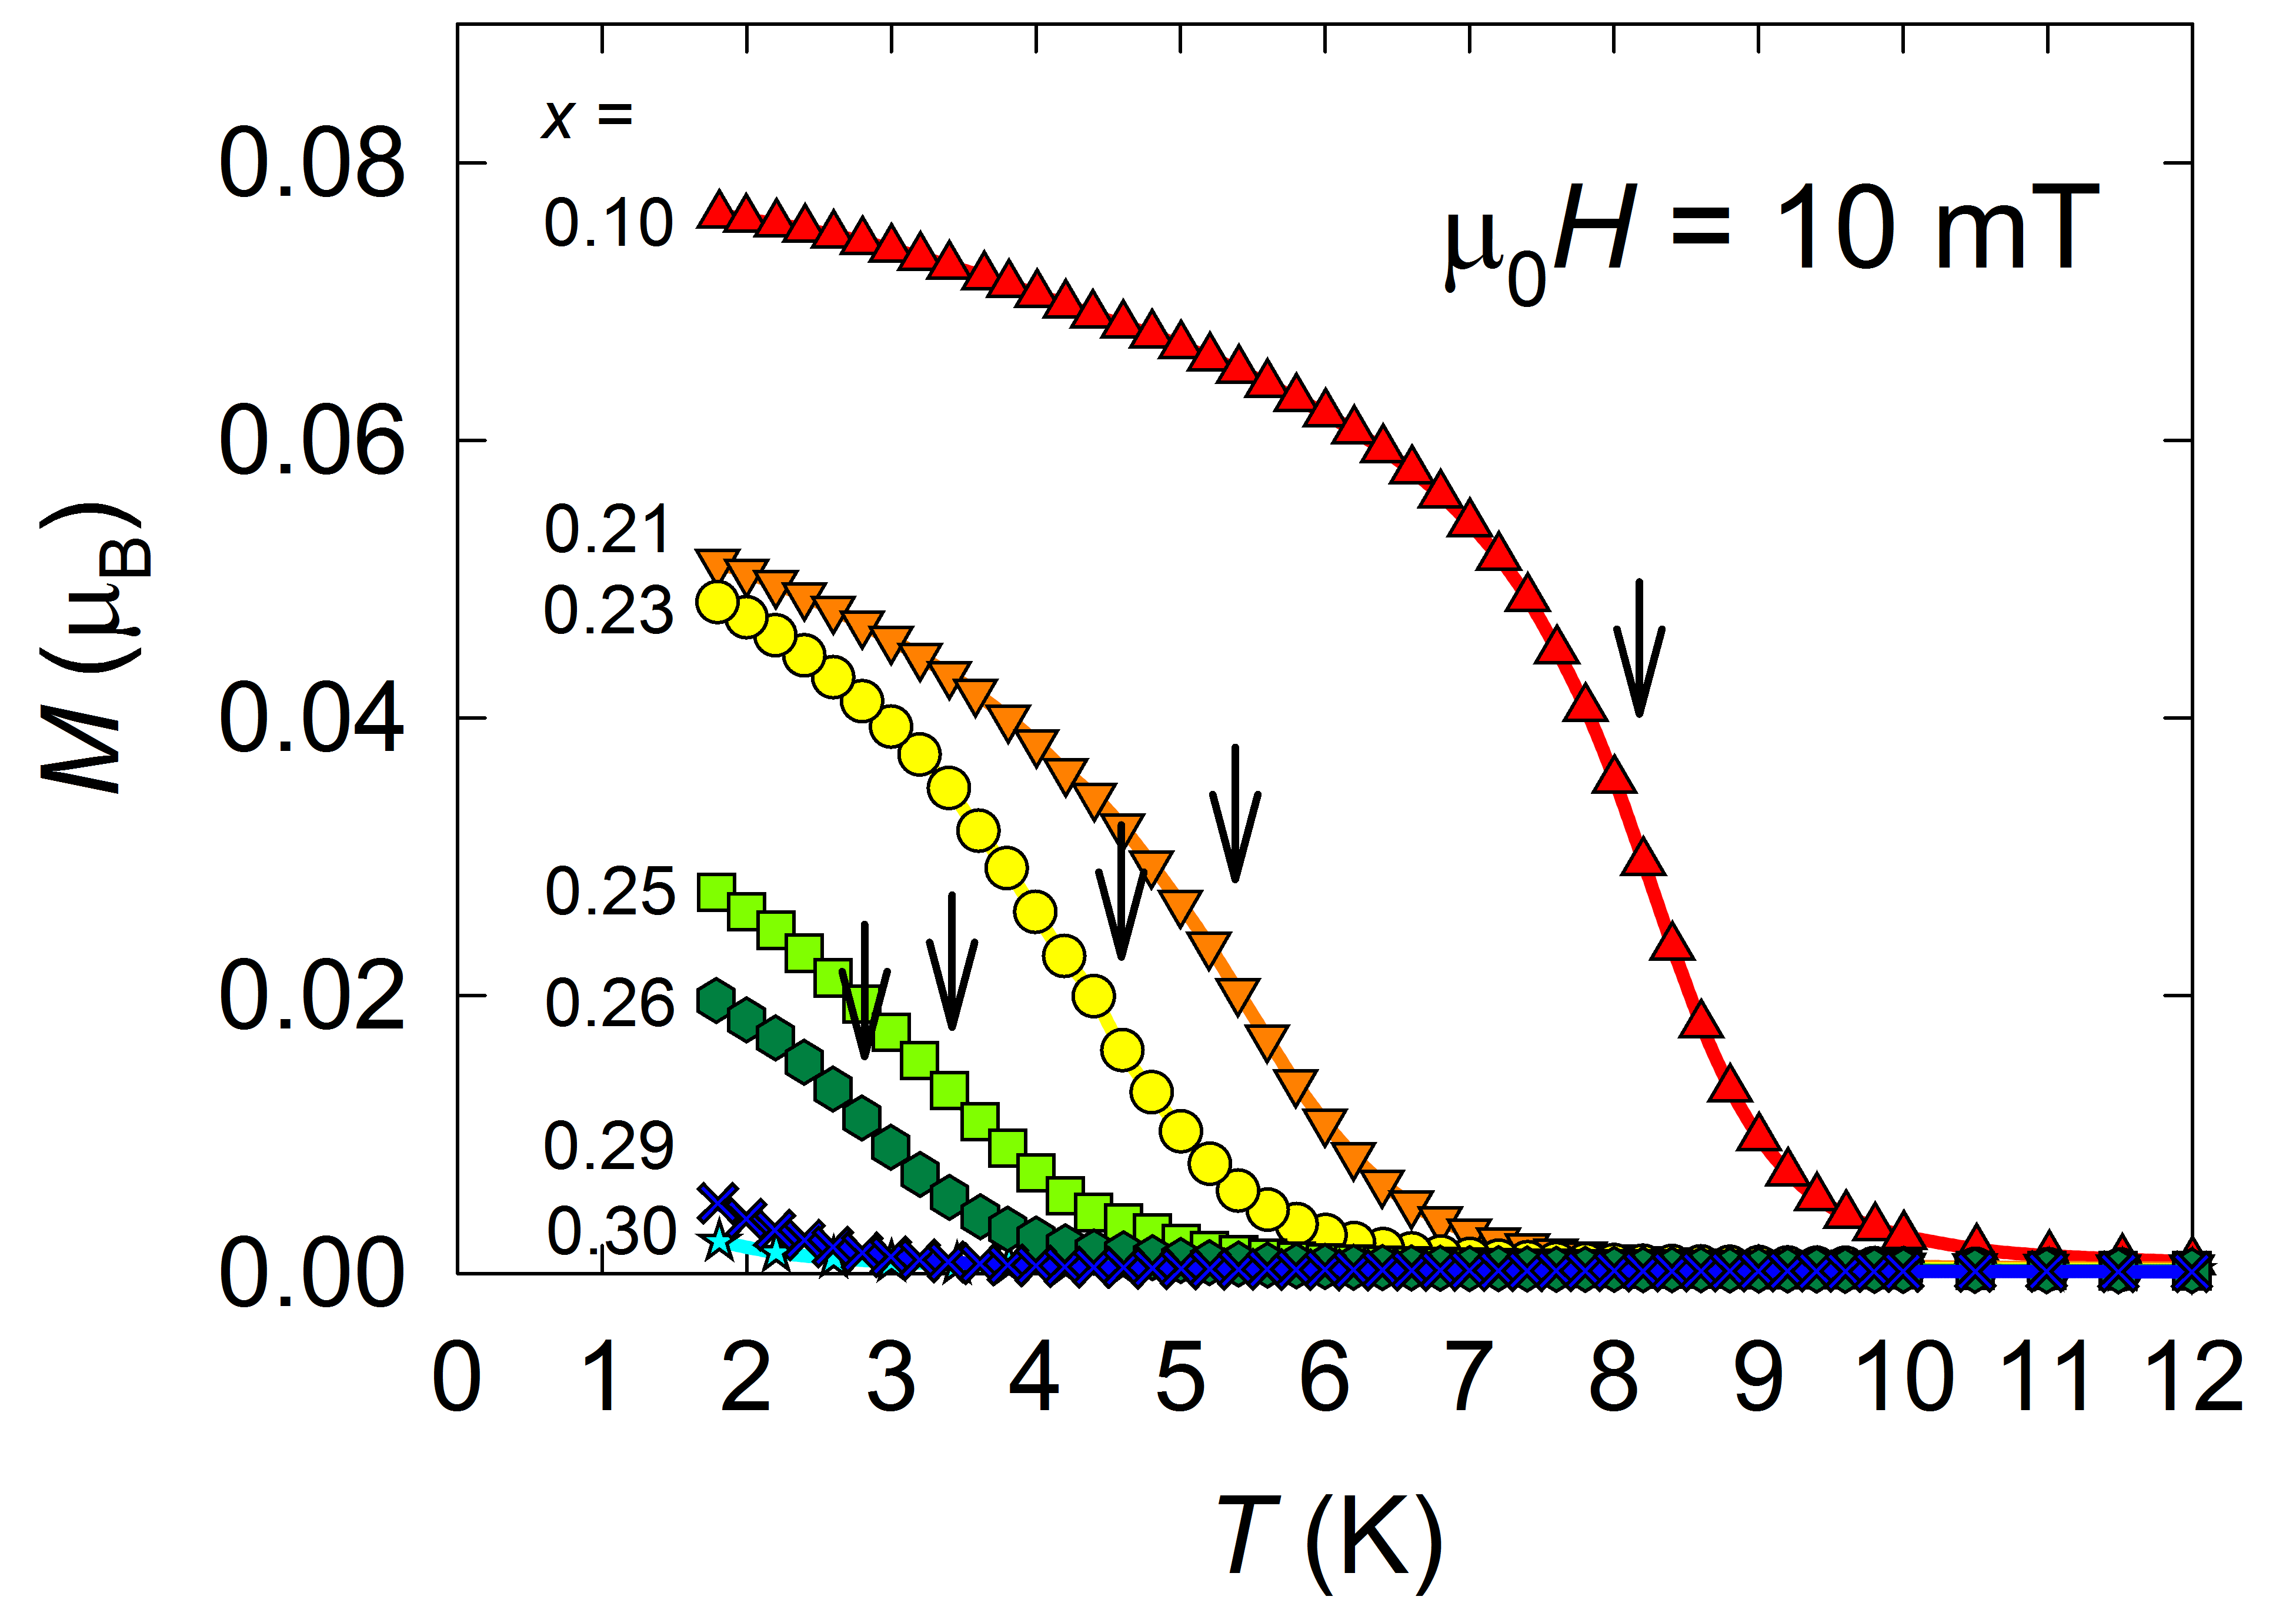
The curves measured on selected samples with concentration above displayed in Fig. 4 also manifest the collapse of ferromagnetism with increasing Ru content. The estimated values as derived from the temperature of the inflection point in the dependence (measured in low external field of ) are in good agreement with ordering temperatures obtained from the Arrott plot analysis (see Table 2 and Fig. 9 (a)).
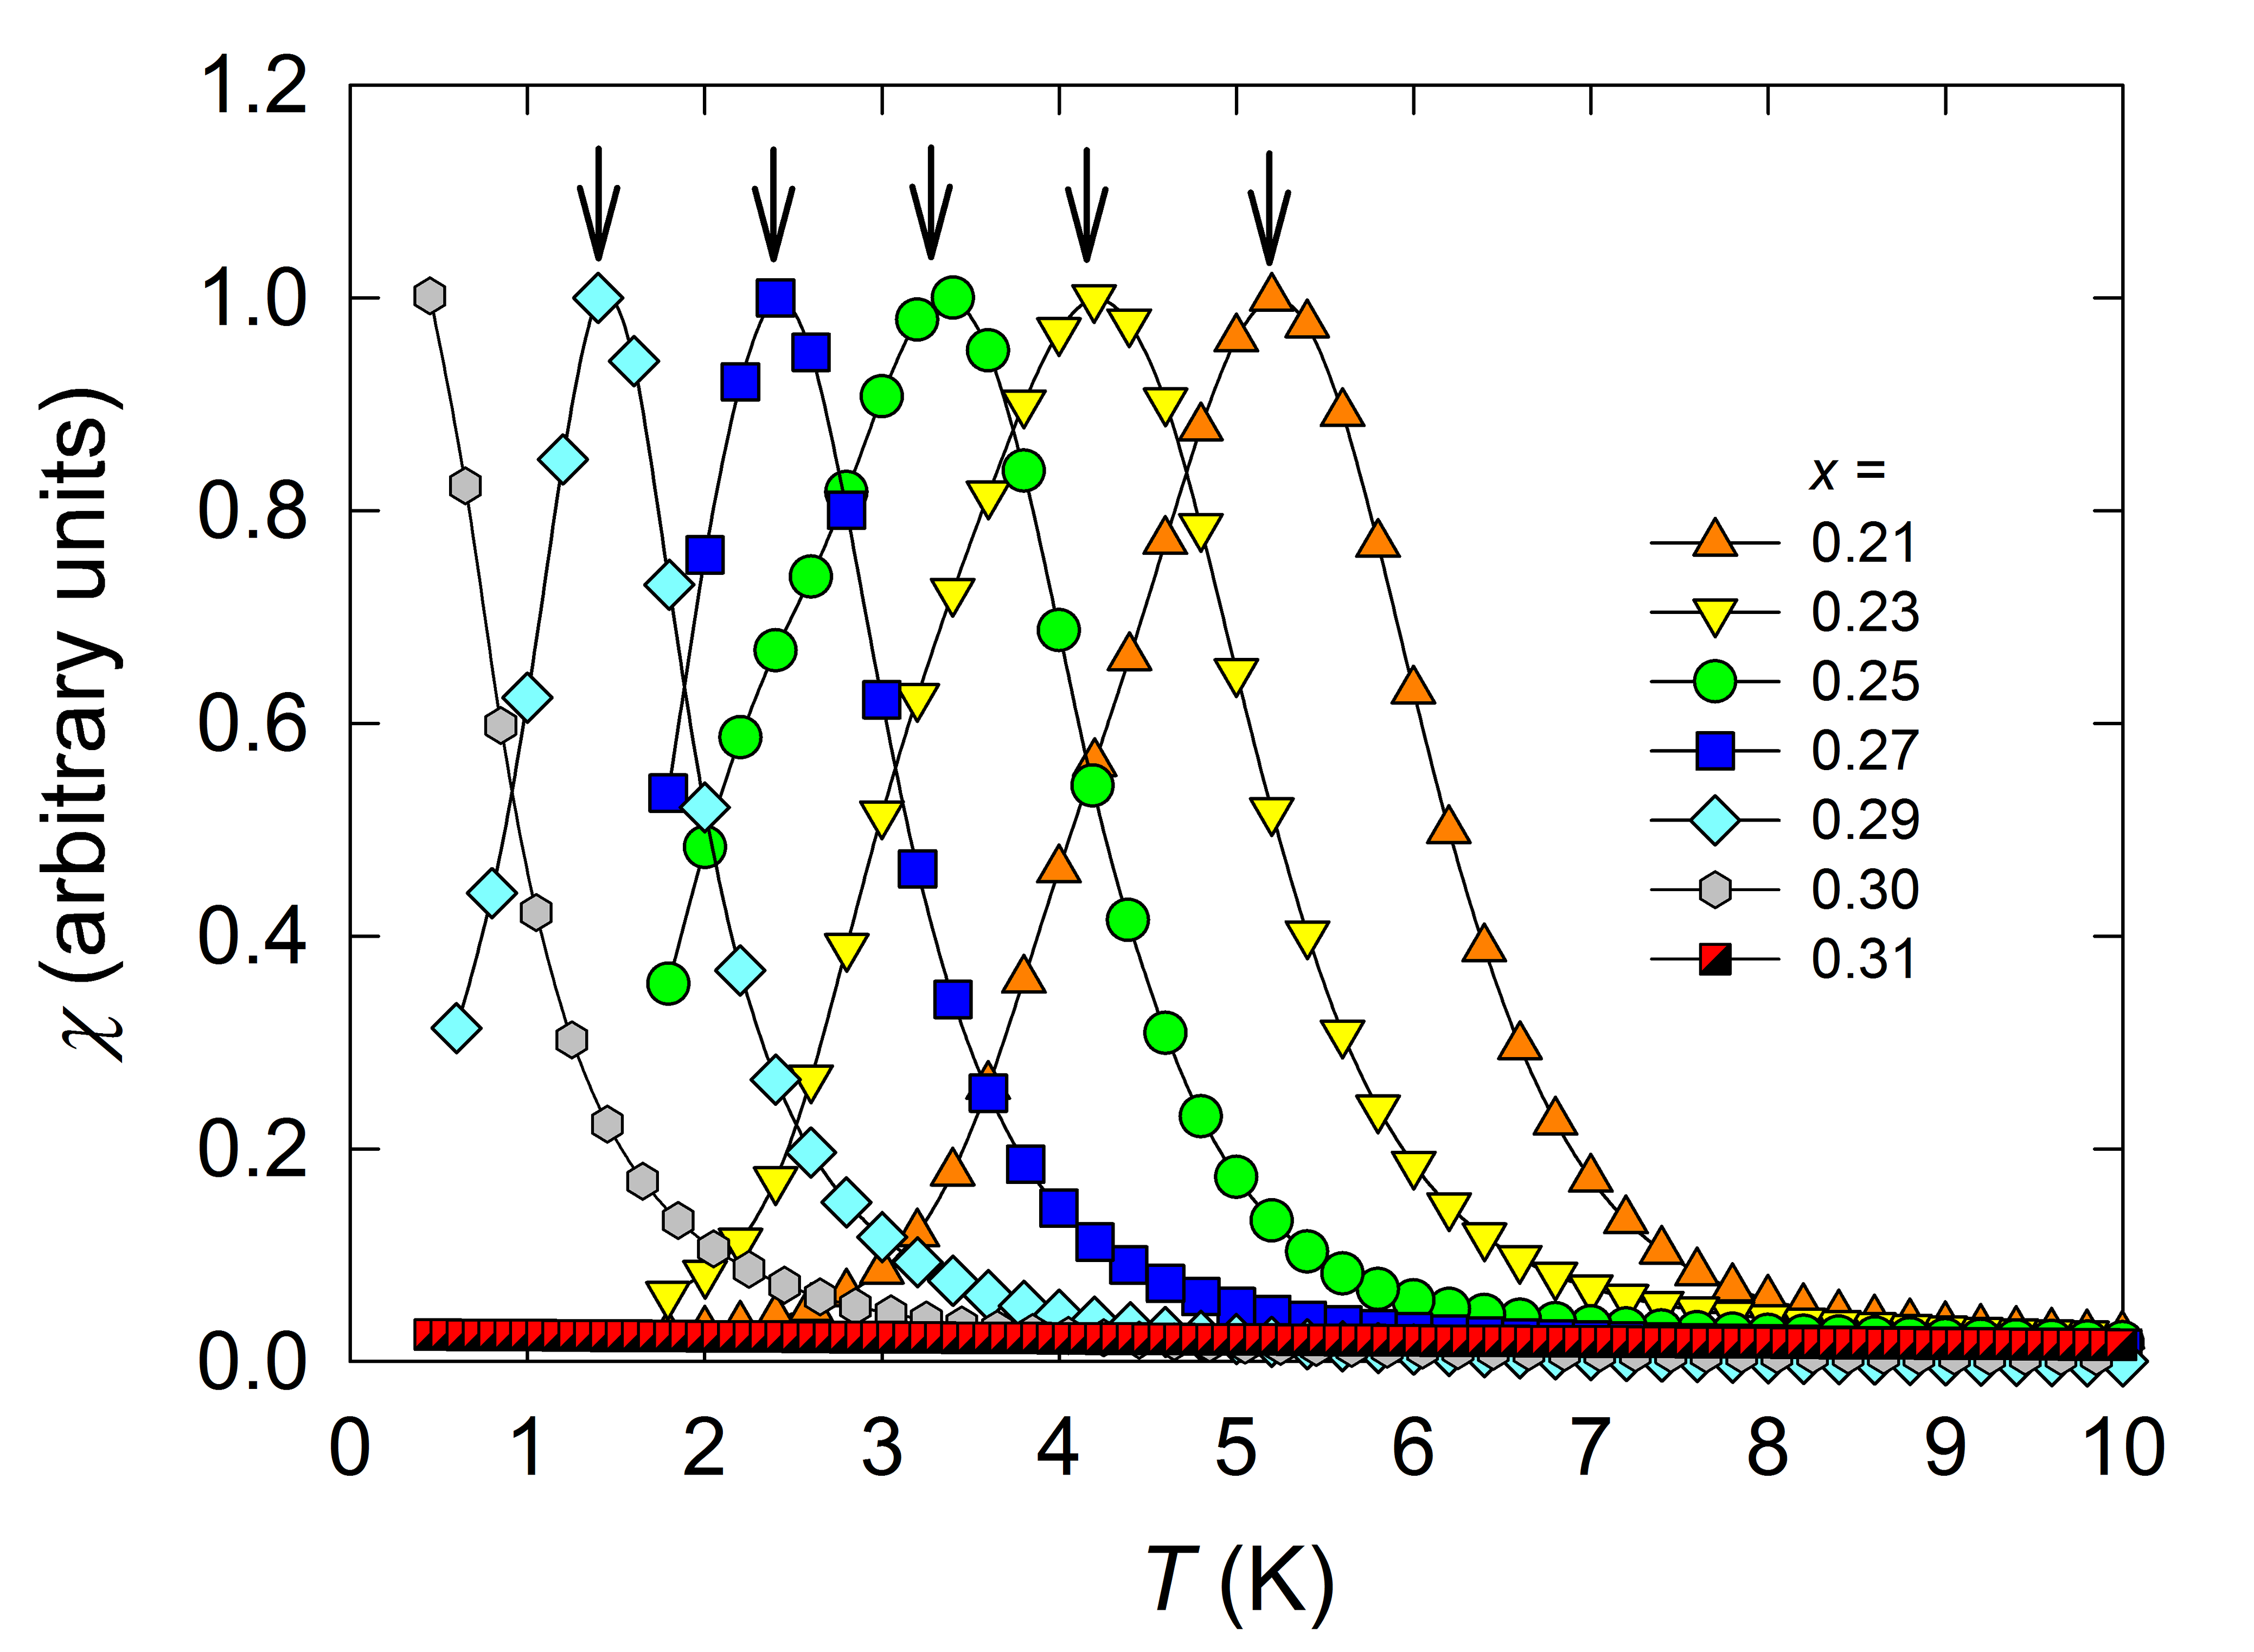
We have also measured the AC magnetic susceptibility () for different Ru concentration above at temperatures down to using a MPMS device. For measurements at lower temperatures (down to ) a custom-made coil system attached to the insert in PPMS and a lock-in amplifier were utilized (the same setup as that used in Ref.Prokleska et al. (2010)). is usually identified as the temperature of the maximum of the real part of (see Fig. 5). While the low temperature AC susceptibility of the sample with reveal a well-developed peak at indicating the onset of ferromagnetism, no clear peak maximum is observed for the sample with , which might be at approximately as the lowest- point was measured at . For the sample with no trace of anomaly has been detected down to which seems to be in the immediate vicinity of the critical Ru concentration for existence of ferromagnetism in the compounds.
III.3 Specific heat
To analyze the different contributions to the specific heat we have subtracted from experimental data the phonon contribution using the fit of the phonon specific heat as a . We typically obtain values of which correspond to Debye-temperature values of . The remaining part of the specific-heat represents the sum of the electronic and magnetic contributions and , respectively.
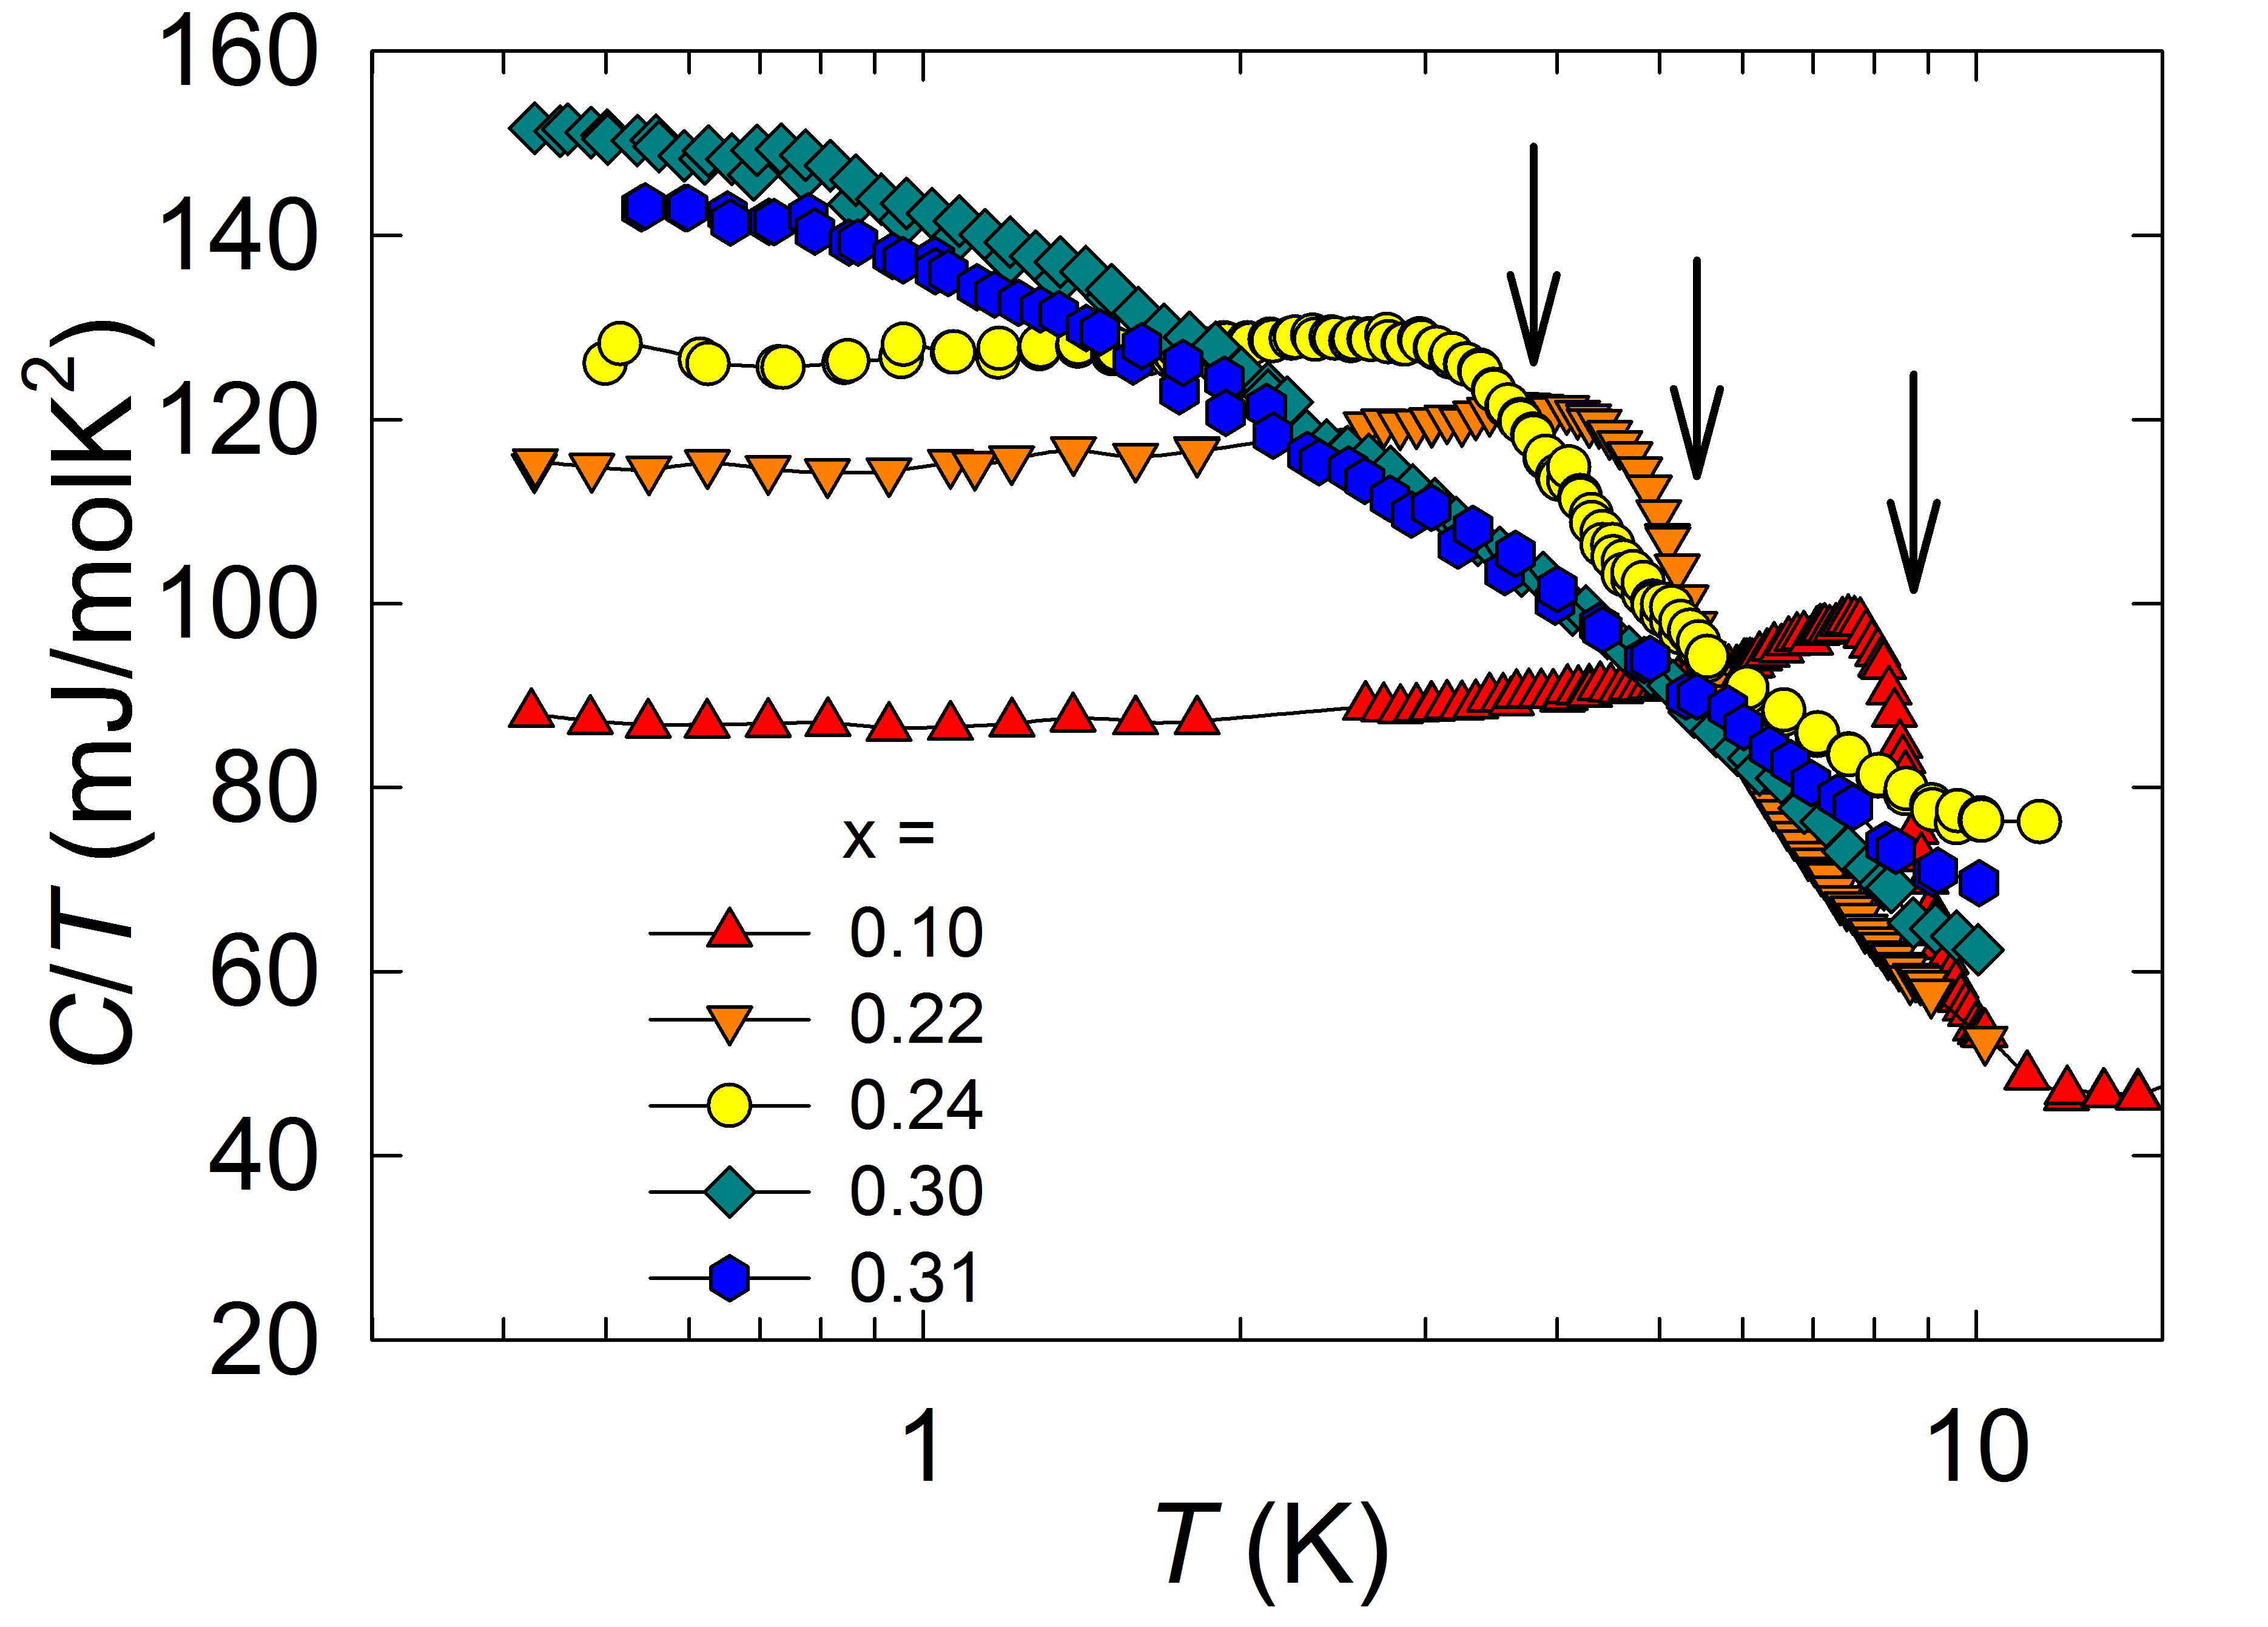
Fig. 6 displays the specific heat divided by temperature versus on a log scale for selected samples between and 0.31. The anomaly at is gradually smeared out and shifted to lower temperatures with increasing Ru concentration. Samples with show clear anomalies that are coincident with the onset of ferromagnetic order and are in reasonable agreement with the values derived from magnetization and AC susceptibility (see Table 2 and Fig. 9 (a)). For samples with and 0.31 versus log exhibits nearly linear dependence between 1 and but gradually levels off at lower temperatures. This indicates a non-Fermi-liquid (NFL) behavior Millis (1993); Hertz (1976) that is expected for concentrations in the vicinity of the ferromagnetic QCP. We note that our data do not follow this dependence in the whole temperature range similar to that recently reported on systemHuang et al. (2013).
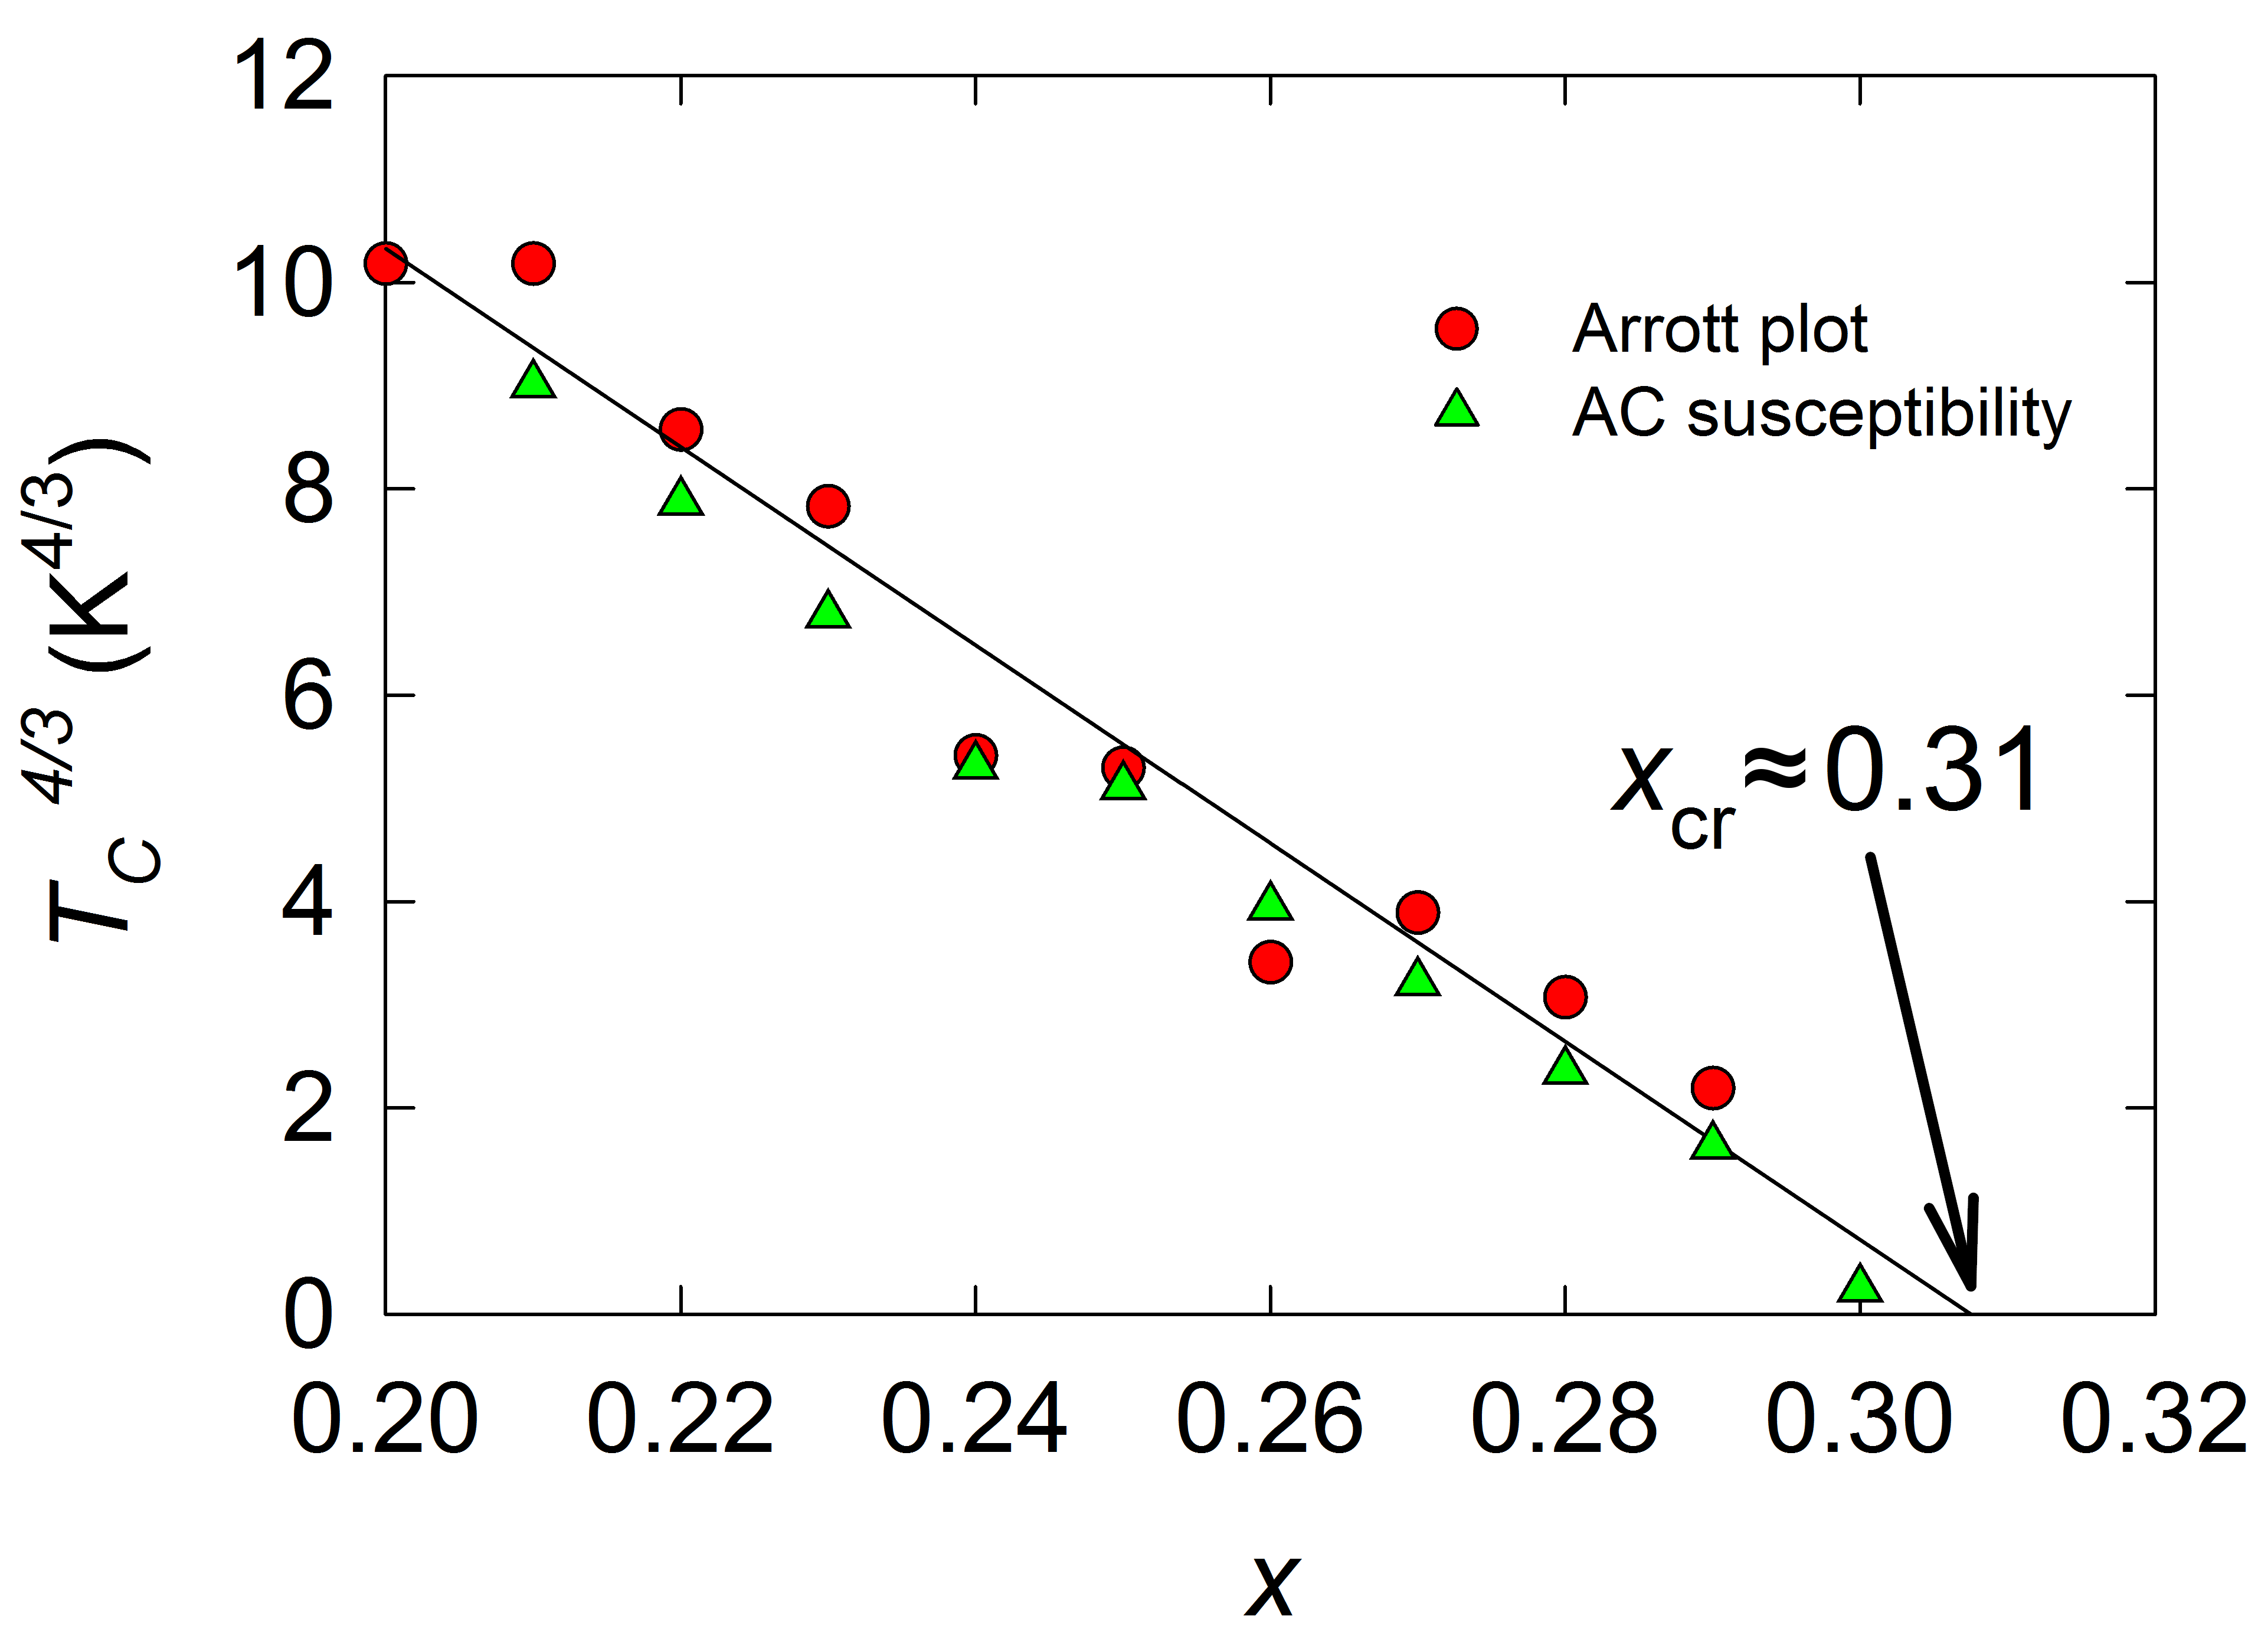
We further calculate the magnetic entropy integrated over the temperature range from up to the for each sample and find a steady decrease of with increasing from for down to at (see Fig. 9(c)). This is consistent with the observation of a gradual disappearance of the itinerant magnetic moment by approaching the QCP (). As the system approaches the critical concentration we observe a large increase of the value of Sommerfeld coefficient with a maximum near which reflects an enhancement of the effective mass of the quasiparticles in the region where ferromagnetism is suppressed. This finding is consistent with the presence of a strong spin fluctuation near the ferromagnetic QCP. According to the prediction for the dependence of on a control parameter () for itinerant ferromagnets QCP by Millis and HertzMillis (1993); Hertz (1976) the ordering temperature should obey the relation Stewart (2001) i.e. a linear vs plot. As we show in Fig. 7 a linear fit of values for the samples with from 0.2 to 0.3 reveals that vanishes at the critical concentration consistent with this model.
III.4 Electrical resistivity
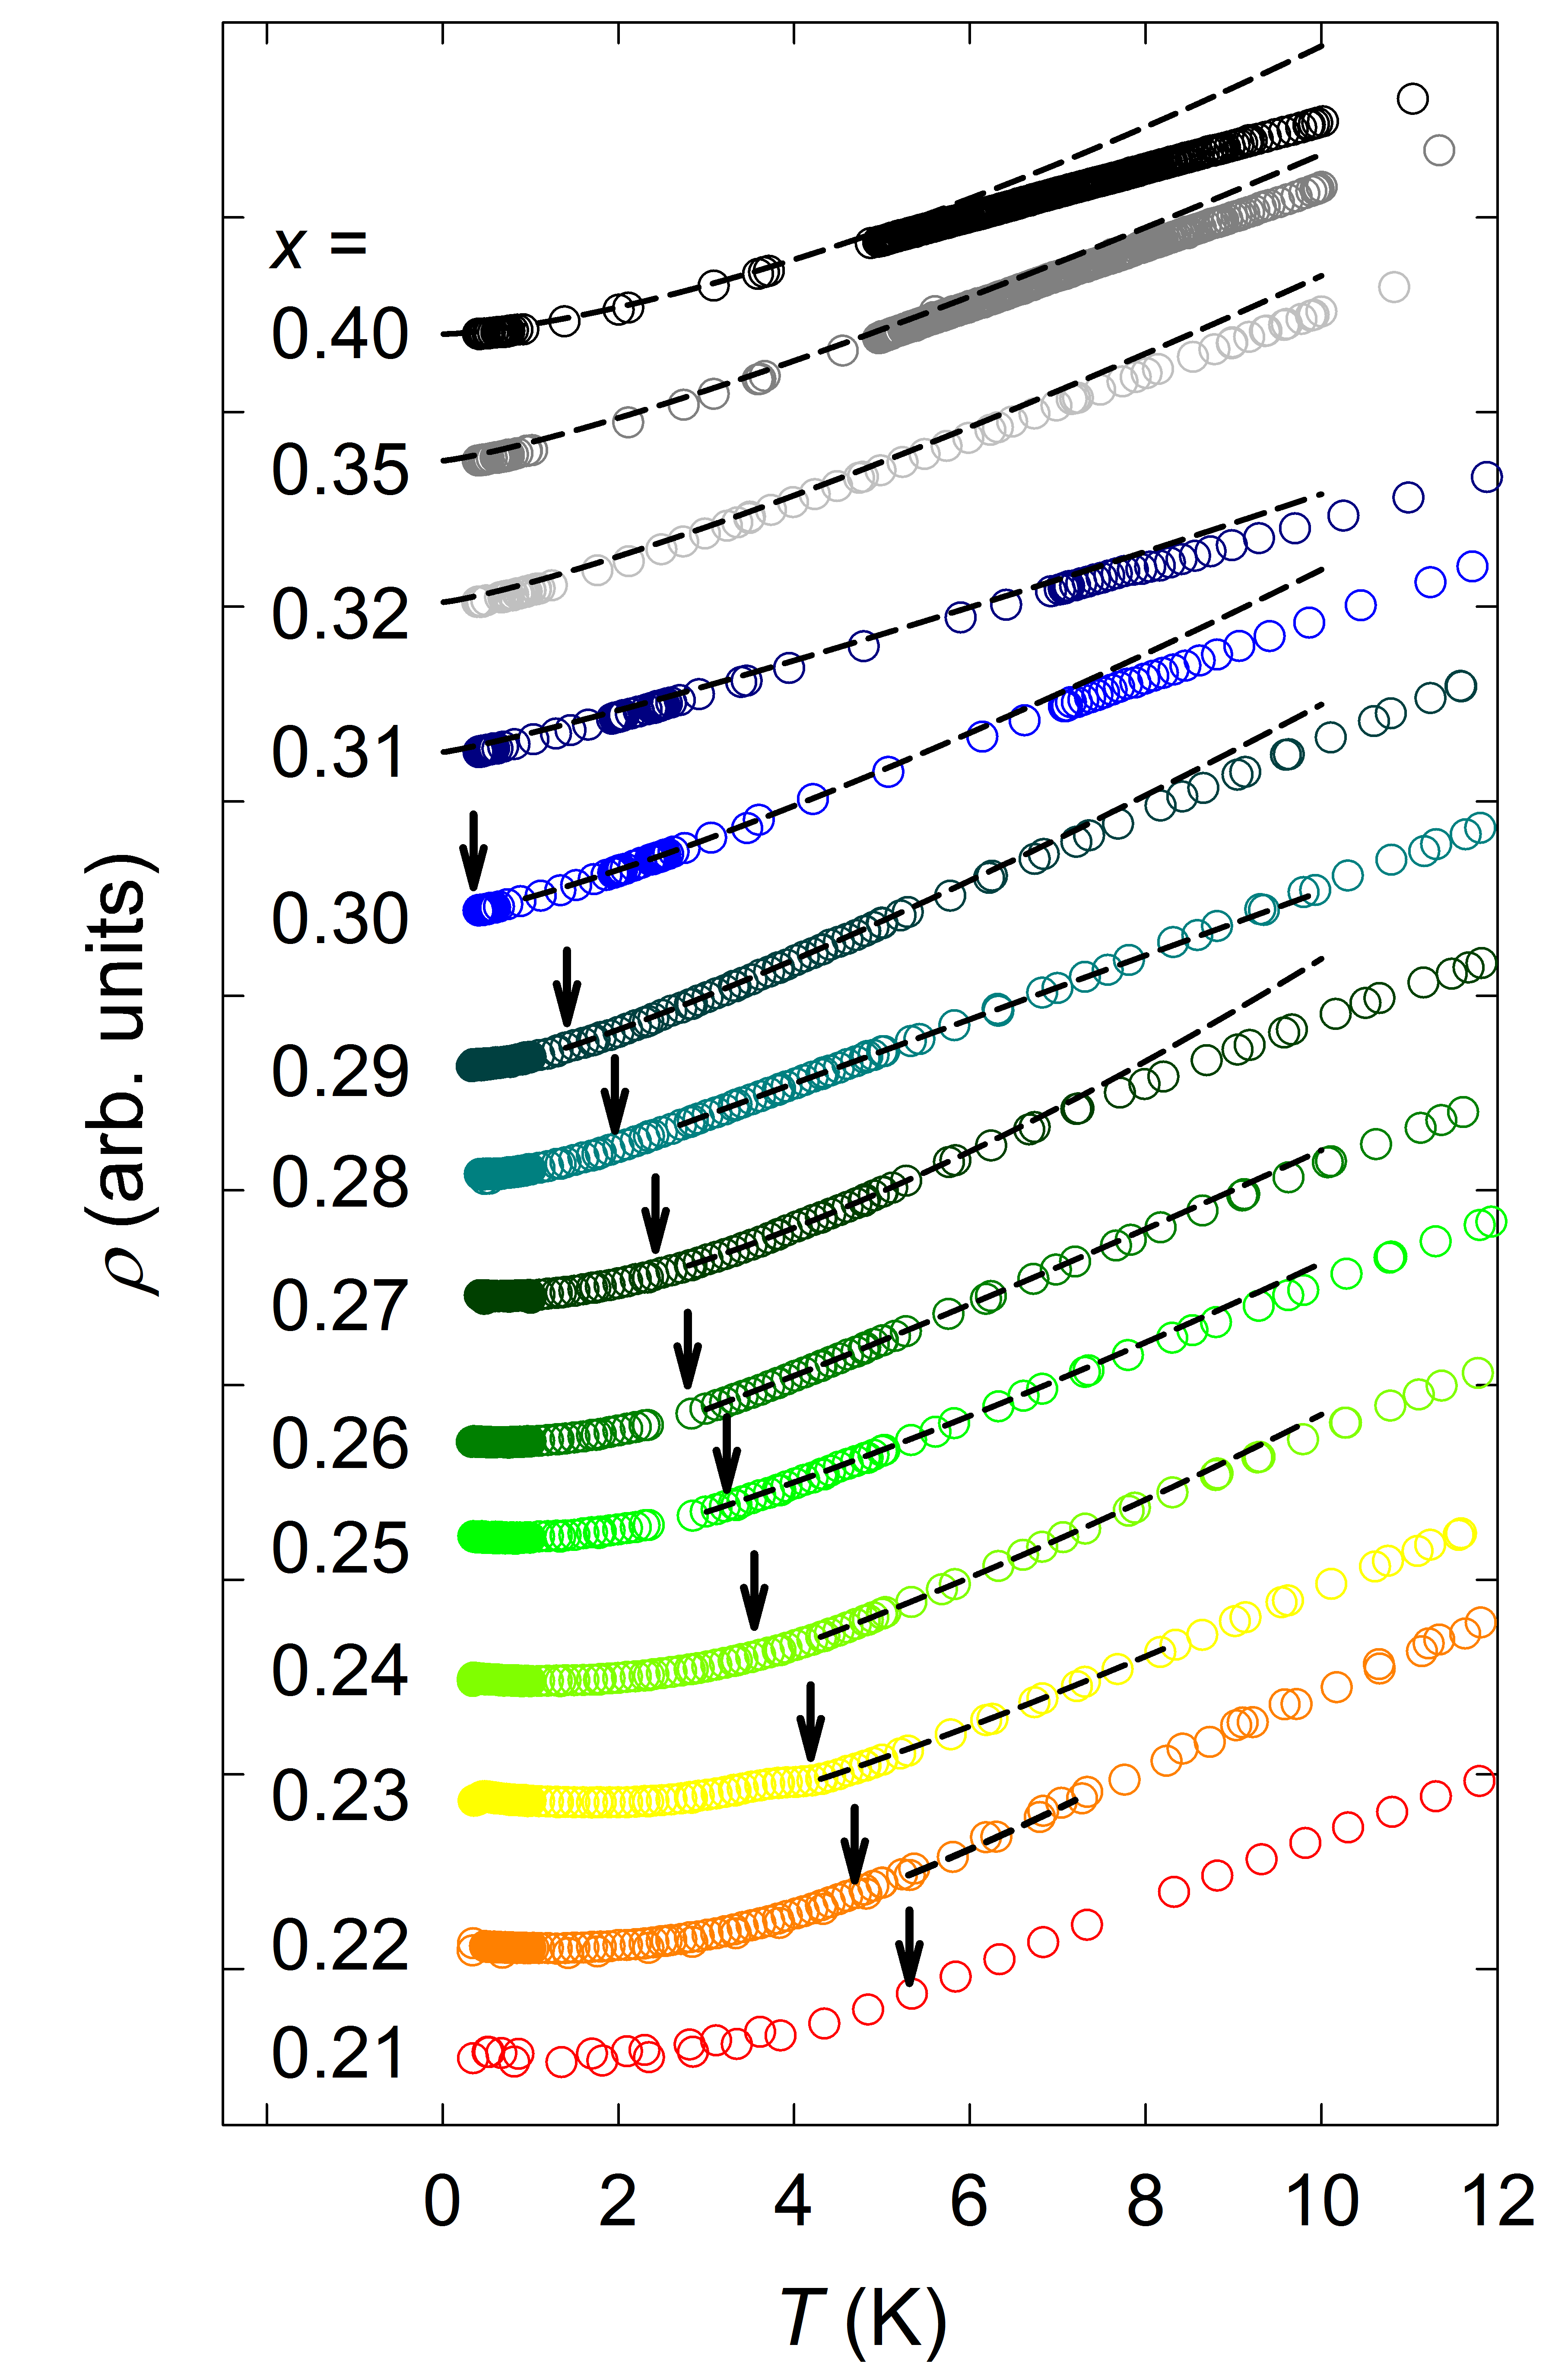
The low-temperature resistivity data measured on selected polycrystalline samples are plotted in Fig. 8. Anomalies connected with the transition from paramagnetic to ferromagnetic state are not clearly visible. It is evident, that increasing Ru content leads to considerable changes of the low temperature resistivity behavior. The data below reasonably follow the dependence usual for ferromagnets. Data above were fitted to the relation:
| (1) |
The inflection point of the dependence was taken as an upper limit for the fitting. The exponent () gradually decreases as the Ru content approaches the critical concentration . The minimum value of for is close to the proposed linear temperature dependence from the theory of Millis and HertzMillis (1993); Hertz (1976); Stewart (2001) for NFL behavior of a clean 3-dimensional itinerant ferromagnets rather than to the scaling with the exponent which follows from the spin-fluctuation theory of MoriyaStewart (2001). The samples with higher concentration of Ru () seem to exhibit gradual recovery towards a FL state which is documented by increasing the value of exponent with increasing above .
Development of the exponent is summarized in the phase diagram (Fig. 9 (b)). In order to see the exponent as a function of temperature we have calculated the logarithmic derivative of the electrical resistivity according to the Eq. (2).
| (2) |
The results of this analysis are displayed in the colored part of the phase diagram in Fig. 9 (a). One can see a significant change of the exponent between the region of ferromagnetic ordering () where and in the nonmagnetic state where . The sharp decrease of the value near down to the lowest temperatures is surrounded by regions of higher (rapidly increasing on the FM side for and slower increase on the paramagnetic side).
III.5 Theoretical calculations
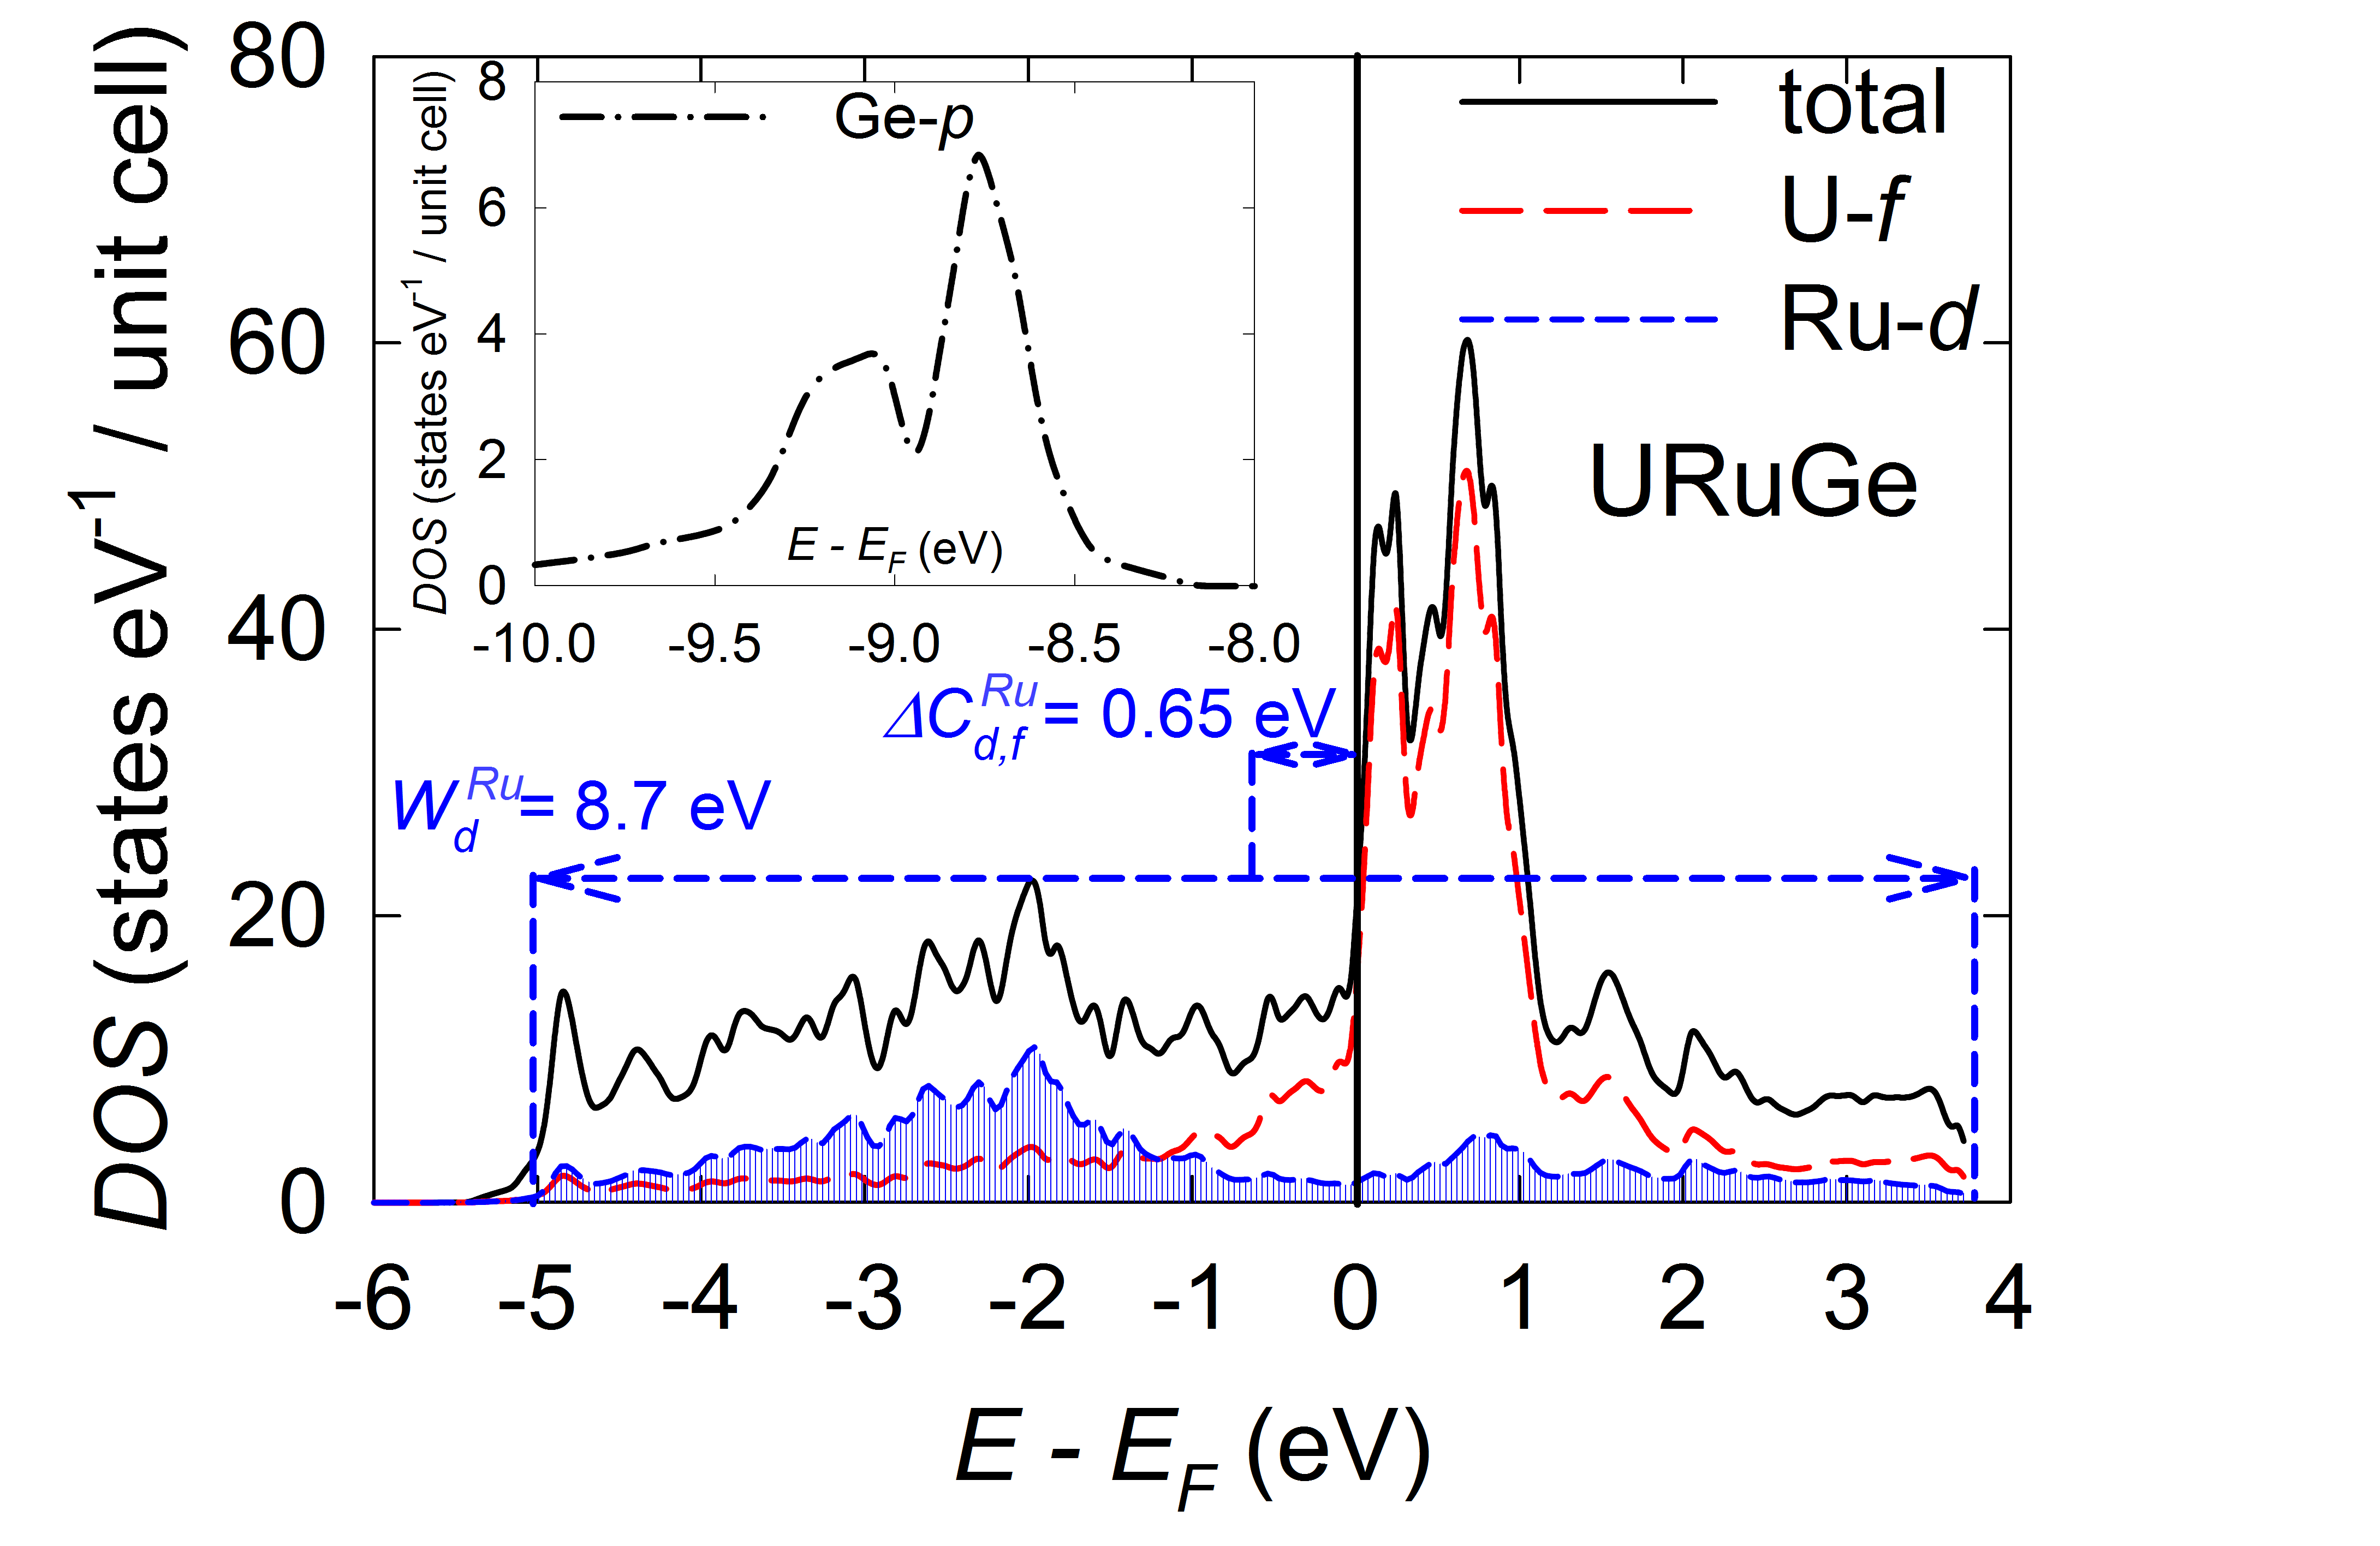
In order to better understand the changes in the electronic structure of the compounds across the ferromagnetic QCP, we have performed first-principles theoretical calculations on the paramagnetic compound URuGe. As a matter of fact, while the density of states (DOS) of the parent compound UCoGe is known (Ref. Divis (2008)) the information about the DOS of URuGe are missing. The calculated total and partial DOS of the URuGe are plotted in Fig. 10.
We used the calculated URuGe band structure by considering the simple model of Silva Neto et al. Neto et al. (2013) which is based on the periodic Anderson modelBatista et al. (2002, 2003). This simplified model proposes the key role of the hybridization ( in Eq. (3)), where is the number of electrons in the observed non-monotonous evolution of in the system. They described the evolution of with increasing as a consequence of the broadening of the and bands (, ), respectively, and the mutual shift of their centers () that are related as Neto et al. (2013):
| (3) |
If we apply this model to our system we can qualitatively describe the non-monotonous evolution of with Ru concentration. The concentration dependence of the broadness of the band is assumed to be linear according to 4
| (4) |
where (Ref. Divis (2008)) and (see Fig. 10) and (Ref. Divis (2008)). Such a behavior is consistent with other U (= transition metal, element) compounds where the band broadens while we move from the 3 to the 4 transition metalsGasche et al. (1995). Consequently deviates from linearity
We used the values from calculated DOSes, i.e. and (Ref. Divis (2008)) and adjustable parameters were taken as and . Such an approach leads to a non-monotonous dependence of the hybridization term ; starting with for UCoGe (in agreement with Ref. Neto et al. (2013)), for URuGe and as estimated for the ferromagnetic QCPNeto et al. (2013). The overall dependence starts with its decrease and thereby causes an enhancement of the density of states at the Fermi level Newns and Read (1987). In case of itinerant ferromagnets we can estimate the ordering temperature as a function of the density of states at the Fermi level where is the Stoner integral and is the total density of states at the Fermi levelMoriya (2012). In this respect we can attribute the initial increase of to the enhanced . At the hybridization reaches its minimum value and starts to increase with increasing . This point qualitatively corresponds to the position of the maximum in the experimental data at . As the Ru concentration increases the -band is shifted closer to the position of the -band and the hybridization increases and thereby results in a reduction of the contribution of the to Newns and Read (1987). For the reason mentioned above the ordering temperature decreases and reaches zero near .
IV Discussion
The 5 electron magnetism in uranium compounds is controlled by the degree of overlap of the 5 wave functions of neighboring U ions and by the hybridization of the U-ion 5-electron states with states of the ligand valence electrons (5-ligand hybridization). These two mechanisms cause that the 5-electron orbitals loose their atomic character which they exhibit in the U free ion. Thus, the 5-5 overlap and/or strong 5-ligand hybridization lead to delocalization of the 5-electrons, their participation in metallic bondingSmith and Kmetko (1983), and consequently a washout of the U magnetic momentCooper et al. (1992). In addition, the spin-orbit interaction in the U ion plays an important role in electronic structure. Accordingly, an orbital magnetic moment antiparallel to the spin moment is induced by the strong spin orbit coupling in the spin-polarized energy bands of itinerant 5 electron materialsBrooks and Kelly (1983); Lander et al. (1991). The magnitude of the U 5-electron magnetic moments is thus further strongly reduced due to the mutual compensation of the orbital and spin components. The orbital moment is by rule larger than the spin moment considering results of so far done relevant experiments (see relevant references in Ref.Sechovsky and Havela (1998)).
On the other hand, the 5-ligand hybridization plays a dual role in U compounds. Besides washing out the 5-electron magnetic moment it mediates an indirect exchange interaction which couples the uranium magnetic moments to promote the magnetic ordering and simultaneously causes very strong magnetocrystalline anisotropy even in very weak itinerant magnetsSechovsky and Havela (1998); Sanchez-Castro et al. (1995). Within this process the hybridized ligand valence states become polarized and as a result the ligand ion (especially transition element ion) exhibits a small induced magnetic moment which is usually parallel to the dominant 5-electron orbital component (see relevant references in Ref.Sechovsky and Havela (1998)). This scenario apparently holds for UCoGe as evidenced from a recent X-ray magnetic circular dichroism (XMCD) studyTaupin et al. (2015) and polarized neutron diffraction (PND) experiments on and single crystalsValiska et al. (2015). These experiments confirm that the 5-electron orbital moment dominates the antiparallel spin component. A much smaller Co magnetic moment is induced by the 5-3 hybridization.
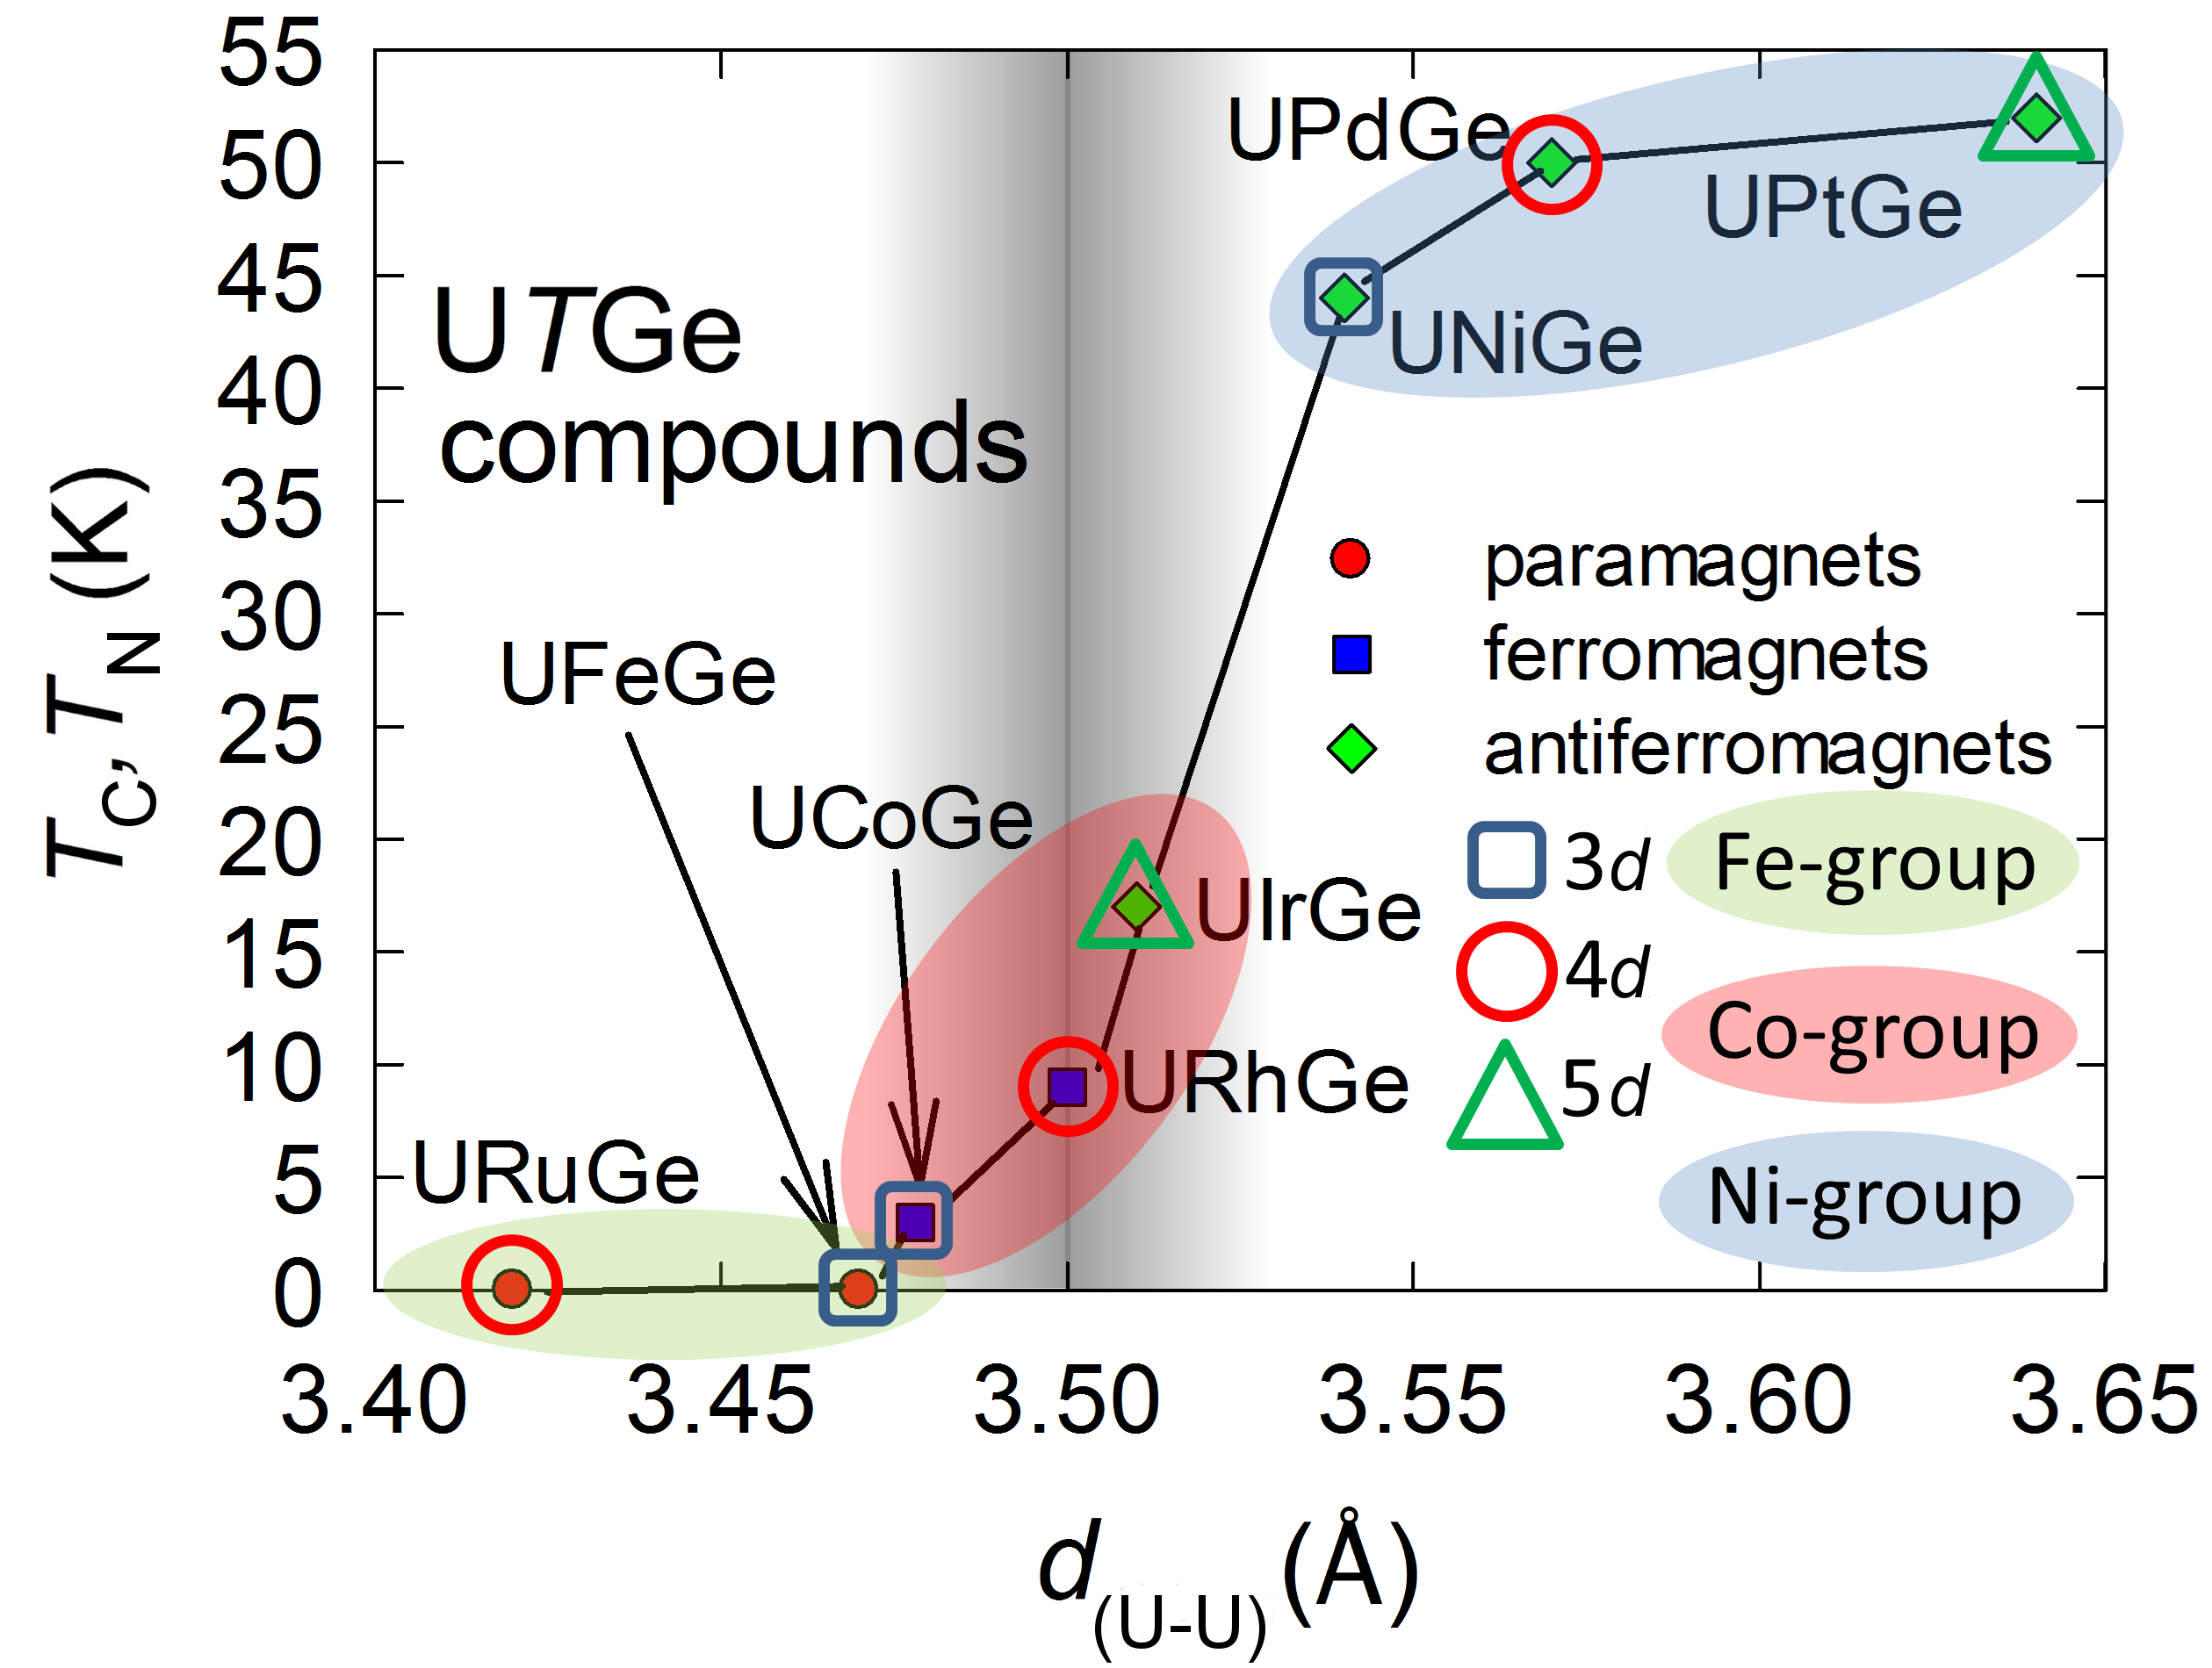
Considering the change of the U-U distance between the nearest U neighbor ions (overlap of 5 orbitals) within the series, we find that decreases with increasing Ru concentration from in UCoGe to in URuGe (see Fig. 1 and Fig. 11). Both values fall rather on the “nonmagnetic side” of the Hill plotHill . On the other hand one should bear in mind that each U ion has only 2 nearest U neighbors on the chain meandering along the -axis. If the 5-5 overlap was the only mechanism controlling magnetism then a gradual washout of U magnetic moment and monotonously decreasing of with increasing Ru content would be expected. On the contrary, however, we observe an initial rapid increase of to a maximum followed by a suppression of ferromagnetism with further increasing . We note that our observation of a ferromagnetic dome in magnetic phase diagram in (see Fig. 9 (a)) is similar to those observed for Huang et al. (2013), Huy et al. (2007b) and Huy and de Visser (2009).
Apparently an additional mechanism, namely the 5-ligand hybridization must be taken into account for conceiving the complex evolution of ferromagnetism in these systems. The increase of and U magnetic moment with increasing up to 0.12 is accompanied by increasing the 5 electron orbital momentValiska et al. (2015). The increase of the orbital moment is usually considered as a sign of partial localization of 5 electrons because the orbital moment density is distributed closer to the nucleus than the spin density as it has been demonstrated on a detailed study of the U 5 electron form factor in Lander et al. (1991); Wulff et al. (1989). Nevertheless, the ratio of indicates still a significant delocalization of the 5 electron states for Valiska et al. (2015). As we mention above our theoretical band structure calculation provide the basis for understanding the mechanism responsible for the ferromagnetic dome in the magnetic phase diagram of by following the simple model treating the changes of 5 hybridization with variations of the widths and mutual positions on the energy scale of the transition metal bands and U 5 bandsNeto et al. (2013). Accordingly, the non-isoelectronic substitution of Co by Ru causes broadening of the band from 3 to the 4 transition metal-like. Together with the mutual movement of the and bands on energy scale itself we can qualitatively conceive the dome-like dependence of the ordering temperature . This is an important confirmation of the trend. Variations of the 5 hybridization most likely cause analogous non-monotonous variation of the magnetic ground state of Huang et al. (2013) and Huy et al. (2007b) exhibiting also a ferromagnetic dome in the magnetic phase diagram. It is worth to mention that the non-monotonous evolution of magnetic ground state causing a ferromagnetic dome in the magnetic phase diagram is not only specific to the UGe compounds possessing the orthorhombic TiNiSi-type structure. Analogous trends reflecting the varying 5 hybridization are observed also in U compounds with the hexagonal ZrNiAl-type structure. Here UFeAlTroc et al. (1993), URuAlVeenhuizen et al. (1988) and UCoAlEriksson et al. (1989) are paramagnets. The latter compound is, however, close to a ferromagnetic instability. A magnetic field of only induces in UCoAl itinerant electron metamagnetismShimizu (1982); Mushnikov et al. (1999). URhAlVeenhuizen et al. (1988) and URhGeSechovsky and Havela (1998) are ferromagnets. Ferromagnetic domes are observed in the magnetic phase diagrams of Andreev et al. (1997), Sechovsky et al. (1992), Sechovsky et al. (1992) and anticipated from the results reported on Mushnikov et al. (2002).
The observed strong delocalization of the 5 electrons in at higher Ru concentrations is reflected by a dramatic decrease of the magnetic entropy down to the for which points to the itinerant nature of the weak ferromagnetism in the vicinity of the critical concentration. Note that a magnetic entropy equal to zero is expected for an ideal itinerant electron ferromagnetSechovsky and Havela (1998). Our results of the temperature dependence of the electrical resistivity provide evidence for a NFL behavior in the vicinity of most likely caused by the possible presence of the FM QCP. We have observed a drop of the exponent in the temperature dependence of resistivity and an almost logarithmic dependence of the heat capacity in a limited interval at lowest temperatures that would be in agreement with the theoretical predictions of Millis and HertzMillis (1993); Hertz (1976). Further evidence for the FM QCP is offered by the rapid increase of the effective mass of the quasiparticles near . The proposed scenario is also corroborated by scaling of the ordering temperature with the control parameter itself which obeys the formula and provides estimation of the critical concentration .
The FM transition of compounds in the vicinity of is apparently of a second order type in contrast to the first order transition reported for 3-dimensional ferromagnets in the vicinity of a QCPBelitz and Kirkpatrick (2012). Microscopic NQR studies of UCoGe suggest a first order transition to the FM stateHattori et al. (2010). The second order transition in compounds near can be conceived as a consequence of the substitution- induced disorder in the system which may blur the first order transition towards a continuous second order transition. In this context, we would like to mention the experimental and theoretical arguments regarding the observed anomalies related to the existence of a ferromagnetic QCP in should be considered with a proper caution. Disorder caused by substitution can in some cases emulate NFL behaviorMiranda et al. (1997); Rosch (1999) and may be one of the reasons of the lacking superconductivity in in the proximity of the QCP. Thorough the investigation of single crystals of compounds near at ambient and high pressures is highly desired in order to clarify the origin of the NFL state and the character of the ferromagnetic quantum phase transition in .
V Conclusions
We have successfully prepared series of the polycrystalline samples of UCoGe doped with Ru in a wide range of concentration (). The Ru substitution leads to development of a FM dome between with the maximum of and appearing at the . Further increase of the Ru content up to the critical concentration leads to the disappearance of the ferromagnetic state at a QCP. Using electronic structure calculations we were able to explain the evolution of ferromagnetism with for in terms of changes of the density of states at the Fermi level due to varying 5-ligand hybridization. The analysis of the critical exponents of the electrical resistivity and heat capacity at low temperatures revealed a non-Fermi liquid behavior for the samples in the vicinity of the QCP. The NFL state can be influenced by the substitution-induced disorder of the system because of the non-isoelectronic mixture of the 3 (Co) and 4 (Ru) bands. Further study of the region around the critical concentration including the measurements under the external pressure performed on high quality single crystals is highly desired for a better understanding the physics underlying the ferromagnetic quantum phase transition.
Acknowledgements.
This work was supported by the Czech Science Foundation no. P204/12/P418 and the Charles University in Prague, project GA UK No.720214. Experiments performed in MLTL (see: http://mltl.eu/) were supported within the program of Czech Research Infrastructures (project LM2011025).References
- Saxena et al. (2000) S. S. Saxena, P. Agarwal, K. Ahilan, F. M. Grosche, R. K. W. Haselwimmer, M. J. Steiner, E. Pugh, I. R. Walker, S. R. Julian, P. Monthoux, G. G. Lonzarich, A. Huxley, I. Sheikin, D. Braithwaite, and J. Flouquet, Nature 406, 587 (2000).
- Huxley et al. (2001) A. Huxley, I. Sheikin, E. Ressouche, N. Kernavanois, D. Braithwaite, R. Calemczuk, and J. Flouquet, Physical Review B 63, 144519 (2001).
- Aoki et al. (2001) D. Aoki, A. Huxley, E. Ressouche, D. Braithwaite, J. Flouquet, J.-P. Brison, E. Lhotel, and C. Paulsen, Nature 413, 613 (2001).
- Huy et al. (2007a) N. T. Huy, A. Gasparini, D. E. de Nijs, Y. Huang, J. C. P. Klaasse, T. Gortenmulder, A. de Visser, A. Hamann, T. Gorlach, and H. von Lohneysen, Physical Review Letters 99, 067006 (2007a).
- Uhlarz et al. (2004) M. Uhlarz, C. Pfleiderer, and S. M. Hayden, Physical Review Letters 93, 256404 (2004).
- de Nijs et al. (2008) D. E. de Nijs, N. T. Huy, and A. de Visser, Physical Review B 77, 140506R (2008).
- Stock et al. (2011) C. Stock, D. A. Sokolov, P. Bourges, P. H. Tobash, K. Gofryk, F. Ronning, E. D. Bauer, K. C. Rule, and A. D. Huxley, Physical Review Letters 107, 187202 (2011).
- Hattori et al. (2012) T. Hattori, Y. Ihara, Y. Nakai, K. Ishida, Y. Tada, S. Fujimoto, N. Kawakami, E. Osaki, K. Deguchi, N. K. Sato, and I. Satoh, Physical Review Letters 108 (2012).
- Marel et al. (2003) D. v. d. Marel, H. J. A. Molegraaf, J. Zaanen, Z. Nussinov, F. Carbone, A. Damascelli, H. Eisaki, M. Greven, P. H. Kes, and M. Li, Nature 425, 271 (2003).
- Pfleiderer et al. (1997) C. Pfleiderer, G. J. McMullan, S. R. Julian, and G. G. Lonzarich, Physical Review B 55, 8330 (1997).
- Schroder et al. (2000) A. Schroder, G. Aeppli, R. Coldea, M. Adams, O. Stockert, H. v. Lohneysen, E. Bucher, R. Ramazashvili, and P. Coleman, Nature 407, 351 (2000).
- Lohneysen et al. (1994) H. v. Lohneysen, T. Pietrus, G. Portisch, H. G. Schlager, A. Schroder, M. Sieck, and T. Trappmann, Physical Review Letters 72, 3262 (1994).
- Custers et al. (2003) J. Custers, P. Gegenwart, H. Wilhelm, K. Neumaier, Y. Tokiwa, O. Trovarelli, C. Geibel, F. Steglich, C. Pepin, and P. Coleman, Nature 424, 524 (2003).
- Pfleiderer and Huxley (2002) C. Pfleiderer and A. D. Huxley, Physical Review Letters 89, 147005 (2002).
- Belitz et al. (1999) D. Belitz, T. R. Kirkpatrick, and T. Vojta, Physical Review Letters 82, 4707 (1999).
- Mineev (2011) V. P. Mineev, Comptes Rendus Physique 12, 567 (2011).
- Janoschek et al. (2013) M. Janoschek, M. Garst, A. Bauer, P. Krautscheid, R. Georgii, P. Boni, and C. Pfleiderer, Physical Review B 87, 134407 (2013).
- Menovsky et al. (1983) A. Menovsky, F. R. de Boer, P. H. Frings, and J. J. M. Franse, in High Field Magnetism, edited by M. Date (Elsevier, Amsterdam, 1983) pp. 189–191.
- Sutherland et al. (2012) M. Sutherland, R. P. Smith, N. Marcano, Y. Zou, S. E. Rowley, F. M. Grosche, N. Kimura, S. M. Hayden, S. Takashima, M. Nohara, and H. Takagi, Physical Review B 85, 035118 (2012).
- Aoki and Flouquet (2012) D. Aoki and J. Flouquet, Journal of the Physical Society of Japan 81, 011003 (2012).
- Gasparini et al. (2010a) A. Gasparini, Y. K. Huang, N. T. Huy, J. C. P. Klaasse, T. Naka, E. Slooten, and A. de Visser, Journal of Low Temperature Physics 161, 134 (2010a).
- Aoki et al. (2009) D. Aoki, T. D. Matsuda, V. Taufour, E. Hassinger, G. Knebel, and J. Flouquet, Journal of the Physical Society of Japan 78, 113709 (2009).
- Pospisil et al. (2009) J. Pospisil, J. P. Vejpravova, M. Divis, and V. Sechovsky, Journal of Applied Physics 105, 07E114 (2009).
- Troc and Tran (1988) R. Troc and V. H. Tran, Journal of Magnetism and Magnetic Materials 73, 389 (1988).
- Huy and de Visser (2009) N. T. Huy and A. de Visser, Solid State Communications 149, 703 (2009).
- Huy et al. (2007b) N. T. Huy, A. Gasparini, J. C. P. Klaasse, A. de Visser, S. Sakarya, and N. H. van Dijk, Physical Review B 75, 212405 (2007b).
- Pospisil et al. (2011) J. Pospisil, K. Prokes, M. Reehuis, M. Tovar, J. Poltierova Vejpravova, J. Prokleska, and V. Sechovsky, Journal of the Physical Society of Japan 80, 084709 (2011).
- Rietveld (1969) H. Rietveld, Journal of Applied Crystallography 2, 65 (1969).
- Rodriguez-Carvajal (1993) J. Rodriguez-Carvajal, Physica B: Condensed Matter 192, 55 (1993).
- (30) T. Roisnel and J. Rodriguez-Carvajal (Trans Tech Publications).
- Canepa et al. (1996) F. Canepa, P. Manfrinetti, M. Pani, and A. Palenzona, Journal of Alloys and Compounds 234, 225 (1996).
- Perdew and Wang (1992) J. P. Perdew and Y. Wang, Physical Review B 45, 13244 (1992).
- Perdew et al. (1996) J. P. Perdew, K. Burke, and M. Ernzerhof, Physical Review Letters 77, 3865 (1996).
- Schwarz et al. (2002) K. Schwarz, P. Blaha, and G. K. H. Madsen, Computer Physics Communications 147, 71 (2002).
- Vegard (1921) L. Vegard, Zeitschrift fur Physik A Hadrons and Nuclei 5, 17 (1921).
- Cordero et al. (2008) B. Cordero, V. Gomez, A. E. Platero-Prats, M. Reves, J. Echeverria, E. Cremades, F. Barragan, and S. Alvarez, Dalton Transactions 0, 2832 (2008).
- Arrott (1957) A. Arrott, Physical Review 108, 1394 (1957).
- Valiska et al. (2015) M. Valiska, J. Pospisil, A. Stunault, Y. Takeda, B. Gillon, Y. Haga, K. Prokes, M. M. Abd-Elmeguid, G. Nenert, T. Okane, H. Yamagami, L. Chapon, A. Gukasov, A. Cousson, E. Yamamoto, and V. Sechovsky, (2015), arXiv:1504.05645.
- Huang et al. (2013) K. Huang, J. J. Hamlin, R. E. Baumbach, M. Janoschek, N. Kanchanavatee, D. A. Zocco, F. Ronning, and M. B. Maple, Physical Review B 87, 054513 (2013).
- Prokleska et al. (2010) J. Prokleska, J. Pospisil, J. Vejpravova Poltierova, V. Sechovsky, and J. Sebek, Journal of Physics: Conference Series 200, 012161 (2010).
- Millis (1993) A. J. Millis, Physical Review B 48, 7183 (1993).
- Hertz (1976) J. A. Hertz, Physical Review B 14, 1165 (1976).
- Stewart (2001) G. R. Stewart, Reviews of Modern Physics 73, 797 (2001).
- Gasparini et al. (2010b) A. Gasparini, Y. K. Huang, J. Hartbaum, H. von Lohneysen, and A. de Visser, Physical Review B 82, 052502 (2010b).
- Divis (2008) M. Divis, Physica B-Condensed Matter 403, 2505 (2008).
- Neto et al. (2013) M. B. S. Neto, A. H. C. Neto, J. S. Kim, and G. R. Stewart, Journal of Physics: Condensed Matter 25, 025601 (2013).
- Batista et al. (2002) C. D. Batista, J. Bonca, and J. E. Gubernatis, Physical Review Letters 88, 187203 (2002).
- Batista et al. (2003) C. D. Batista, J. Bonca, and J. E. Gubernatis, Physical Review B 68, 214430 (2003).
- Gasche et al. (1995) T. Gasche, M. S. S. Brooks, and B. Johansson, Journal of Physics: Condensed Matter 7, 9499 (1995).
- Newns and Read (1987) D. M. Newns and N. Read, Advances in Physics 36, 799 (1987).
- Moriya (2012) T. Moriya, (Springer Berlin Heidelberg, 2012).
- Smith and Kmetko (1983) J. L. Smith and E. A. Kmetko, Journal of the Less Common Metals 90, 83 (1983).
- Cooper et al. (1992) B. R. Cooper, Q. G. Sheng, S. P. Lim, C. Sanchez-Castro, N. Kioussis, and J. M. Wills, Journal of Magnetism and Magnetic Materials 108, 10 (1992).
- Brooks and Kelly (1983) M. S. S. Brooks and P. J. Kelly, Physical Review Letters 51, 1708 (1983).
- Lander et al. (1991) G. H. Lander, M. S. S. Brooks, and B. Johansson, Physical Review B 43, 13672 (1991).
- Sechovsky and Havela (1998) V. Sechovsky and L. Havela, in Handbook of Magnetic Materials, Vol. Volume 11, edited by K. H. J. Buschow (Elsevier, 1998) pp. 1–289.
- Sanchez-Castro et al. (1995) C. Sanchez-Castro, B. R. Cooper, and K. S. Bedell, Physical Review B 51, 12506 (1995).
- Taupin et al. (2015) M. Taupin, J.-P. Brison, D. Aoki, J.-P. Sanchez, F. Wilhelm, and A. Rogalev, ArXiv e-prints (2015).
- (59) H. H. Hill, pp. 1 – 19.
- Wulff et al. (1989) M. Wulff, G. H. Lander, B. Lebech, and A. Delapalme, Physical Review B 39, 4719 (1989).
- Troc et al. (1993) R. Troc, V. H. Tran, F. G. Vagizov, and H. Drulis, Journal of Alloys and Compounds 200, 37 (1993).
- Veenhuizen et al. (1988) P. A. Veenhuizen, F. R. de Boer, A. A. Menovsky, V. Sechovsky, and L. Havela, Journal de Physique 49, 485 (1988).
- Eriksson et al. (1989) O. Eriksson, B. Johansson, and M. S. S. Brooks, Journal of Physics: Condensed Matter 1, 4005 (1989).
- Shimizu (1982) M. Shimizu, J. Phys. France 43, 155 (1982).
- Mushnikov et al. (1999) N. V. Mushnikov, T. Goto, K. Kamishima, H. Yamada, A. V. Andreev, Y. Shiokawa, A. Iwao, and V. Sechovsky, Physical Review B 59, 6877 (1999).
- Andreev et al. (1997) A. V. Andreev, L. Havela, V. Sechovsky, M. I. Bartashevich, J. Sebek, R. V. Dremov, and I. K. Kozlovskaya, Philosophical Magazine B-Physics of Condensed Matter Statistical Mechanics Electronic Optical and Magnetic Properties 75, 827 (1997).
- Sechovsky et al. (1992) V. Sechovsky, L. Havela, F. R. de Boer, P. A. Veenhuizen, K. Sugiyama, T. Kuroda, E. Sugiura, M. Ono, M. Date, and A. Yamagishi, Physica B: Condensed Matter 177, 164 (1992).
- Mushnikov et al. (2002) N. V. Mushnikov, T. Goto, A. V. Andreev, V. Sechovsky, and H. Yamada, Physical Review B 66, 064433 (2002).
- Belitz and Kirkpatrick (2012) D. Belitz and T. R. Kirkpatrick, (2012), arXiv:1204.0873.
- Hattori et al. (2010) T. Hattori, K. Ishida, Y. Nakai, T. Ohta, K. Deguchi, N. K. Sato, and I. Satoh, Physica C: Superconductivity 470, S561 (2010).
- Miranda et al. (1997) E. Miranda, V. Dobrosavljevic, and G. Kotliar, Physical Review Letters 78, 290 (1997).
- Rosch (1999) A. Rosch, Physical Review Letters 82, 4280 (1999).