First Detection of 22 GHz H2O Masers in TX Camelopardalis
1 Introduction
TX Cam is a cool Mira variable star with a late spectral type M8M10. It showed an optical variation from Vmax = 11.60 to Vmin =16.20 in magnitude with a period of 557.4 d (Kholopov et al. 1985). Its distance was estimated to be 390 pc from the period-luminosity relation (Olivier et al. 2001). The mass-loss rate was obtained to be 1.1 10-6 yr-1 by Knapp & Morris (1985).
Silicon monoxide (SiO) maser emission from TX Cam was detected by Spencer et al. (1977) for the first time. Subsequently, various vibrational and rotational transitions of 28SiO, 29SiO, and 30SiO masers including the rare masers of 28SiO = 2, = 2–1 and 29SiO = 1, = 1–0 lines were detected from this star (Jewell et al. 1987, Herpin et al. 1998, Gray et al. 1999, Cho & Ukita 1995, 1998, Cho et al. 1998, Cho & Kim 2012). Single dish monitoring of SiO masers toward evolved stars including this star has been performed in the SiO = 1, 2, = 1–0 lines by Alcolea et al. (1999) and Pardo et al. (2004). Kang et al. (2006) also performed monitoring observations in both SiO = 1, 2, 3, = 2–1 and = 3–2 masers using the TRAO 14 m telescope. Alcolea et al. (1999) and Pardo et al. (2004) showed that the SiO intensity maxima are in agreement with those of NIR maxima with phase lags of 0.05 – 0.20 supporting the radiative pumping of SiO masers against collisional pumping. Kang et al. (2006) reported that the time variability of = 1, = 2–1 and = 3–2 masers is very different, i. e., main peak components of the = 1, = 2–1 maser show dominant red-shifted features compared to the = 1, = 3–2 maser. For VLBI monitoring observations, a movie of the SiO ( = 1, = 1–0) masers around TX Cam using the VLBA was presented by Diamond & Kemball (2003) and directly showed stellar pulsation motions traced by SiO masers. Gonidakis et al. (2010, 2013) also presented new and final versions of the SiO maser movies exhibiting the existence of shock waves and their effect on the morphology and kinematics of the gas. However, the H2O maser (Bowers & Hagen 1984, Benson & Little-Marenin 1996, Shintani et al. 2008) as well as the OH maser (Olnon et al. 1980) has not been detected in TX Cam. This is not the case of a large number of oxygen-rich AGB stars in which both H2O and OH masers are detected together with SiO masers. Benson & Little-Marenin (1996) did not detected the H2O maser despite repeated attempts. They considered this missed detection quite strange, despite a high mass-loss rate, a relatively close distance, and a well-developed shell. Therefore, we included TX Cam in our simultaneous monitoring programs of 22 GHz H2O and 43, 86, 129 GHz SiO masers using the Korean VLBI Network (KVN) single dish telescopes in order to confirm the existence of the 22 GHz H2O maser and the variation characteristics of the maser properties among SiO = 1–0, = 2–1, and = 3–2 masers through systematic monitoring observations.
In this paper, we present the first detection of the 22 GHz H2O maser emission and results of simultaneous observations of 28SiO = 0, 1, 2, = 1–0, = 2–1, = 3–2, 29SiO = 0, = 1–0 and H2O masers in the direction of TX Cam. In Section 2, we describe the observations. In Section 3, observational results are presented. In Section 4, we discuss the detection of H2O maser emission, the intensity ratio and the peak velocity pattern among SiO masers according to the optical phases. A summary is given in Section 5.
2 Observations
Simultaneous monitoring observations of H2O and SiO masers have been performed from June 2009 to June 2014. The SiO = 2–1 and = 3–2 lines began to be observed from May 27, 2012 after installation of 86/129 GHz band receivers. Therefore, simultaneous monitoring of H2O and 28SiO = 1, 2, = 1–0, 29SiO = 0, = 1–0 maser lines were performed from June 10, 2009 to April 13, 2012 and simultaneous monitoring of H2O and 28SiO = 1, 2, = 1–0; = 1, = 2–1, = 3–2 maser lines performed from May 27, 2012 to June 4, 2014 except the SiO = 3–2 maser which was observed in 2012 July and October. Simultaneous observations of SiO = 0, = 1–0; = 2, = 2–1, = 3–2 lines were added in May 2012 and SiO = 0, = 1–0, = 2–1 lines added in July 2012. In total, 15 epoch data were obtained.
We used one of the KVN Yonsei, Ulsan, and Tamna 21 m single dish telescopes based on our observational dates. The KVN antenna optics were designed for supporting simultaneous observations in four bands of 22, 43, 86, and 129 GHz using three quasi-optical low-pass filters (Han et al. 2008, 2013). The low pass filter 1 (LPF1) reflects the beam for the 86/129 GHz bands and the beam for the 22 GHz and 43 GHz bands. Likewise, LPF2 and LPF3 split beams into 22/43 GHz and 86/129 GHz, respectively. The half power beam widths and aperture efficiencies of the three KVN telescopes at four bands were given in the KVN home page (http://kvn-web.kasi.re.kr/). We adopted an average values of the three telescopes because their parameters are similar. Hence, the average half power beam widths and aperture efficiencies are 123′′, 0.58 (at 22 GHz) and 62′′, 0.61 (at 43 GHz), 32′′, 0.50 (at 86 GHz) and 23′′, 0.35 (at 129 GHz), respectively. The pointing accuracy was checked every 2 hours using the source itself. We used the cryogenic 22, 43, 86 GHz High Electron Mobility Transistor (HEMT) receivers and the Superconductor-Insulator-Superconductor (SIS) 129 GHz receiver with both right and left circular polarized feeds (Han et al. 2013). Only the left circular polarized feed was used during our observations.
The SSB system noise temperatures of a single side-band range from 72 K to 156 K (at 22 GHz), from 96 K to 235 K (at 43 GHz), from 175 K to 385 K (at 86 GHz), and from 189 K to 566 K (at 129 GHz) depending on weather conditions and elevations. We used a digital spectrometer with total band widths chosen from one 64 MHz mode for the H2O line and three 64 MHz modes for the SiO = 1, 2, and 29SiO = 0, = 1–0 lines until the April 2012 observation with only available 22 and 43 GHz modes. After that period, for the four bands (22, 43, 86, and 129 GHz), we used three 32 MHz modes for the H2O , SiO = 1, 2, = 1–0 lines and two 64 MHz modes for the SiO = 1, = 2–1 and = 3–2 lines, respectively. These band widths correspond to the radial velocity ranges of 860 km s-1 (at 22 GHz), 440 km s-1 (at 43 GHz). The velocity resolutions of each band are 0.21 km s-1 (at 22 GHz), 0.11 km s-1 (at 43 GHz) until the April 2012 observation mode. After that, for the four band modes, the radial velocity ranges are 440 km s-1 (at 22 GHz), 222 km s-1 (at 43 GHz), 222 km s-1 (at 86 GHz), and 148 km s-1 (at 129 GHz) with velocity resolutions of 0.11 km s-1 (at 22 GHz), 0.05 km s-1 (at 43 GHz), 0.05 km s-1 (at 86 GHz), and 0.036 km s-1 (at 129 GHz), respectively. All the spectra were Hanning-smoothed for velocity resolutions of 0.44 0.57 km s-1.
The chopper wheel method was used for the data calibration; it corrects the atmospheric attenuation and the antenna gain variations, depending on elevation in order to yield an antenna temperature . The integration time was 60120 minutes to achieve the sensitivity of 0.06 K at the 3 level. The average conversion factors of the three telescopes from the antenna temperature to the flux density are about 13.8 Jy K-1 at 22 GHz, 13.1 Jy K-1 at 43 GHz, 15.9 Jy K-1 at 86 GHz, and 22.8 Jy K-1 at 129 GHz, respectively.
| Molecule | Transition | Frequency (GHz) |
|---|---|---|
| H2O | 61,6–52,3 | 22.235080 |
| 28SiO | = 0, = 1–0 | 43.423858 |
| = 1, = 1–0 | 43.122080 | |
| = 2, = 1–0 | 42.820587 | |
| = 0, = 2–1 | 86.846998 | |
| = 1, = 2–1 | 86.243442 | |
| = 2, = 2–1 | 85.640452 | |
| = 1, = 3–2 | 129.363359 | |
| = 2, = 3–2 | 128.458891 | |
| 29SiO | = 0, = 1–0 | 42.879916 |
3 Observational Results
| Molecule and Transition | (peak) | rms | (peak) | (peak) | Date(phase) | |
|---|---|---|---|---|---|---|
| (K) | (K) | (K km s-1) | (km s-1) | (km s-1) | (yymmdd) | |
| (1) | (2) | (3) | (4) | (5) | (6) | (7) |
| H2O 61,6–52,3 | 0.08 | 090610(0.62) | ||||
| 0.02 | 101211(1.60) | |||||
| 0.05 | 110222(1.74) | |||||
| 0.02 | 111018(2.16) | |||||
| 0.01 | 120102(2.30) | |||||
| 0.02 | 120413(2.48) | |||||
| 0.03 | 120527(2.56) | |||||
| 0.04 | 120704(2.63) | |||||
| 0.01 | 121210(2.91) | |||||
| 0.12 | 0.02 | 0.23 | 11.2 | 0.2 | 130410(3.13) | |
| 0.07 | 0.02 | 0.08 | 10.8 | 0.2 | 130915(3.42) | |
| 0.06 | 0.01 | 0.11 | 12.5 | 1.5 | 131125(3.54) | |
| 0.01 | 140211(3.68) | |||||
| 0.09 | 0.02 | 0.22 | 11.2 | 0.2 | 140407(3.78) | |
| 0.15 | 0.03 | 0.35 | 11.3 | 0.3 | 140604(3.89) | |
| 28SiO = 0, = 1–0 | 0.26 | 0.04 | 2.55 | 12.9 | 1.9 | 120527(2.56) |
| 0.20 | 0.02 | 4.07 | 10.7 | 0.3 | 120704(2.63) | |
| 28SiO = 1, = 1–0 | 3.53 | 0.08 | 9.44 | 6.6 | 4.4 | 090610(0.62) |
| 5.57 | 0.03 | 15.42 | 11.0 | 0.0 | 101211(1.60) | |
| 9.10 | 0.05 | 29.18 | 11.1 | 0.1 | 110222(1.74) | |
| 10.85 | 0.02 | 72.17 | 11.6 | 0.6 | 111018(2.16) | |
| 7.26 | 0.02 | 47.71 | 7.7 | 3.3 | 120102(2.30) | |
| 0.88 | 0.03 | 5.14 | 6.5 | 4.5 | 120413(2.48) | |
| 2.28 | 0.02 | 13.14 | 7.2 | 3.8 | 120527(2.56) | |
| 2.49 | 0.03 | 15.29 | 5.1 | 5.9 | 120704(2.63) | |
| 6.08 | 0.04 | 47.31 | 10.4 | 0.6 | 121210(2.91) | |
| 26.64 | 0.01 | 95.93 | 12.5 | 1.5 | 130410(3.13) | |
| 14.53 | 0.01 | 45.85 | 12.5 | 1.5 | 130915(3.42) | |
| 11.45 | 0.01 | 38.01 | 13.0 | 2.0 | 131125(3.54) | |
| 15.91 | 0.01 | 51.59 | 13.4 | 2.4 | 140211(3.68) | |
| 19.98 | 0.01 | 66.76 | 12.5 | 1.5 | 140407(3.78) | |
| 19.48 | 0.02 | 58.20 | 12.5 | 1.5 | 140604(3.89) | |
| 28SiO = 2, = 1–0 | 2.78 | 0.09 | 16.61 | 10.6 | 0.4 | 090610(0.62) |
| 8.62 | 0.03 | 20.18 | 10.9 | 0.1 | 101211(1.60) | |
| 9.19 | 0.05 | 24.45 | 10.6 | 0.4 | 110222(1.74) | |
| 16.15 | 0.02 | 77.43 | 11.2 | 0.2 | 111018(2.16) | |
| 9.89 | 0.02 | 47.41 | 7.2 | 3.8 | 120102(2.30) | |
| 3.25 | 0.03 | 12.18 | 7.6 | 3.4 | 120413(2.48) | |
| 1.70 | 0.04 | 7.99 | 5.1 | 5.9 | 120527(2.56) | |
| 2.35 | 0.02 | 9.51 | 5.1 | 5.9 | 120704(2.63) | |
| 9.34 | 0.04 | 38.93 | 10.7 | 0.3 | 121210(2.91) | |
| 21.98 | 0.01 | 89.51 | 12.5 | 1.5 | 130410(3.13) | |
| 14.60 | 0.01 | 50.66 | 12.9 | 1.9 | 130915(3.42) | |
| 18.02 | 0.01 | 49.88 | 13.0 | 2.0 | 131125(3.54) | |
| 17.76 | 0.01 | 45.35 | 13.0 | 2.0 | 140211(3.68) | |
| 18.12 | 0.01 | 45.39 | 12.9 | 1.9 | 140407(3.78) | |
| 22.32 | 0.03 | 51.44 | 13.0 | 2.0 | 140604(3.89) | |
| 28SiO = 0, = 2–1 | 0.41 | 0.03 | 10.52 | 10.3 | 0.7 | 120704(2.63) |
| 28SiO = 1, = 2–1 | 8.13 | 0.03 | 23.90 | 10.4 | 0.6 | 120527(2.56) |
| 5.40 | 0.03 | 18.38 | 10.8 | 0.2 | 120704(2.63) | |
| 9.21 | 0.01 | 43.54 | 9.5 | 1.5 | 121210(2.91) | |
| 11.43 | 0.02 | 55.91 | 11.5 | 0.5 | 130410(3.13) | |
| 8.59 | 0.02 | 38.92 | 10.4 | 0.6 | 130915(3.42) | |
| 6.86 | 0.01 | 34.61 | 9.9 | 1.1 | 131125(3.54) | |
| 3.66 | 0.02 | 24.51 | 12.0 | 1.0 | 140211(3.68) | |
| 6.13 | 0.02 | 32.47 | 11.6 | 0.6 | 140407(3.78) |
| Molecule and Transition | (peak) | rms | (peak) | (peak) | Date(phase) | |
|---|---|---|---|---|---|---|
| (K) | (K) | (K km s-1) | (km s-1) | (km s-1) | (yymmdd) | |
| (1) | (2) | (3) | (4) | (5) | (6) | (7) |
| 9.97 | 0.03 | 38.56 | 11.6 | 0.6 | 140604(3.89) | |
| 28SiO = 2, = 2–1 | 0.05 | 120527(2.56) | ||||
| 28SiO = 1, = 3–2 | 1.96 | 0.05 | 4.34 | 10.7 | 0.3 | 120527(2.56) |
| 7.17 | 0.01 | 24.98 | 11.4 | 0.4 | 130410(3.13) | |
| 3.55 | 0.02 | 10.38 | 10.7 | 0.3 | 130915(3.42) | |
| 4.02 | 0.02 | 11.26 | 10.1 | 0.9 | 131125(3.54) | |
| 0.99 | 0.02 | 2.48 | 10.3 | 0.7 | 140211(3.68) | |
| 3.32 | 0.01 | 11.56 | 10.1 | 0.9 | 140407(3.78) | |
| 2.83 | 0.03 | 10.55 | 10.1 | 0.9 | 140604(3.89) | |
| 28SiO = 2, = 3–2 | 0.07 | 120527(2.56) | ||||
| 29SiO = 0, = 1–0 | 0.53 | 0.02 | 1.57 | 10.7 | 0.3 | 101211(1.60) |
| 1.02 | 0.05 | 2.37 | 10.9 | 0.1 | 110222(1.74) | |
| 2.01 | 0.02 | 3.11 | 11.4 | 0.4 | 111018(2.16) | |
| 1.50 | 0.02 | 2.44 | 11.4 | 0.4 | 120102(2.30) | |
| 0.51 | 0.03 | 0.70 | 11.4 | 0.4 | 120413(2.48) |
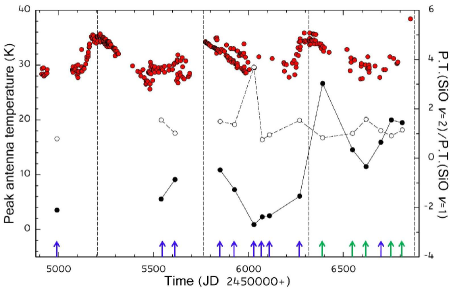
Table 2 presents the results of the SiO and H2O monitoring observations. The observed molecules and transitions are given in Column 1. The detected peak antenna temperatures of H2O and SiO maser lines and their root mean square (rms) levels are given in Columns 2 and 3. Columns 4 and 5 provide integrated antenna temperatures and peak velocities. Column 6 gives the peak velocities with respect to the local standard of rest (LSR) for each detected maser line. The dates of the observation with the corresponding phase of the optical light curve (maximum light = 1.0, 2.0, 3.0) are listed in Column 7. The optical phase was calculated from the optical data provided by the American Association of Variable Star Observers (AAVSO).
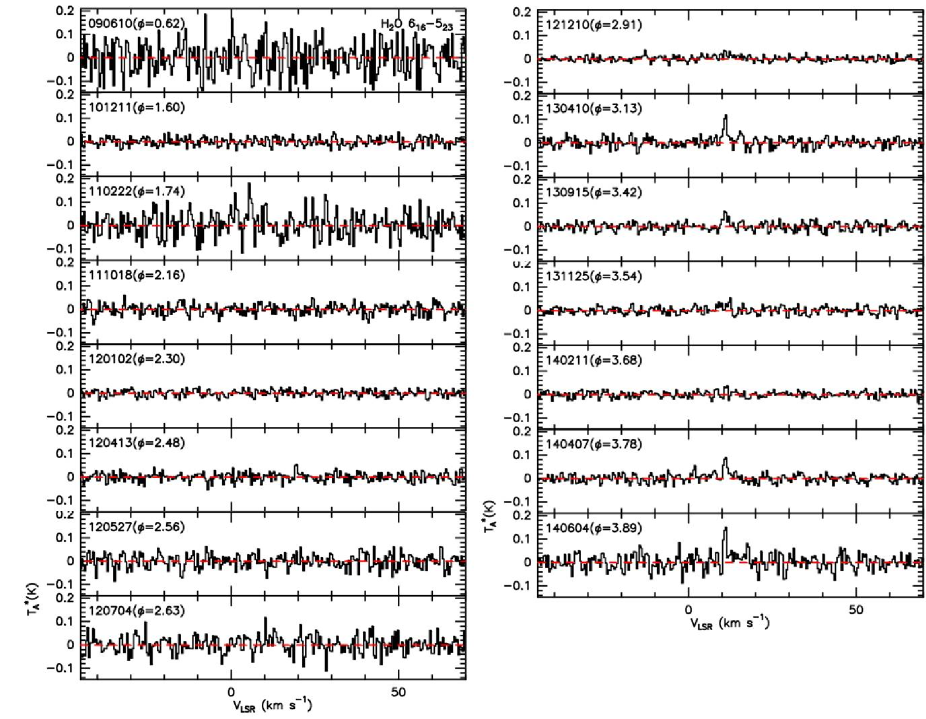
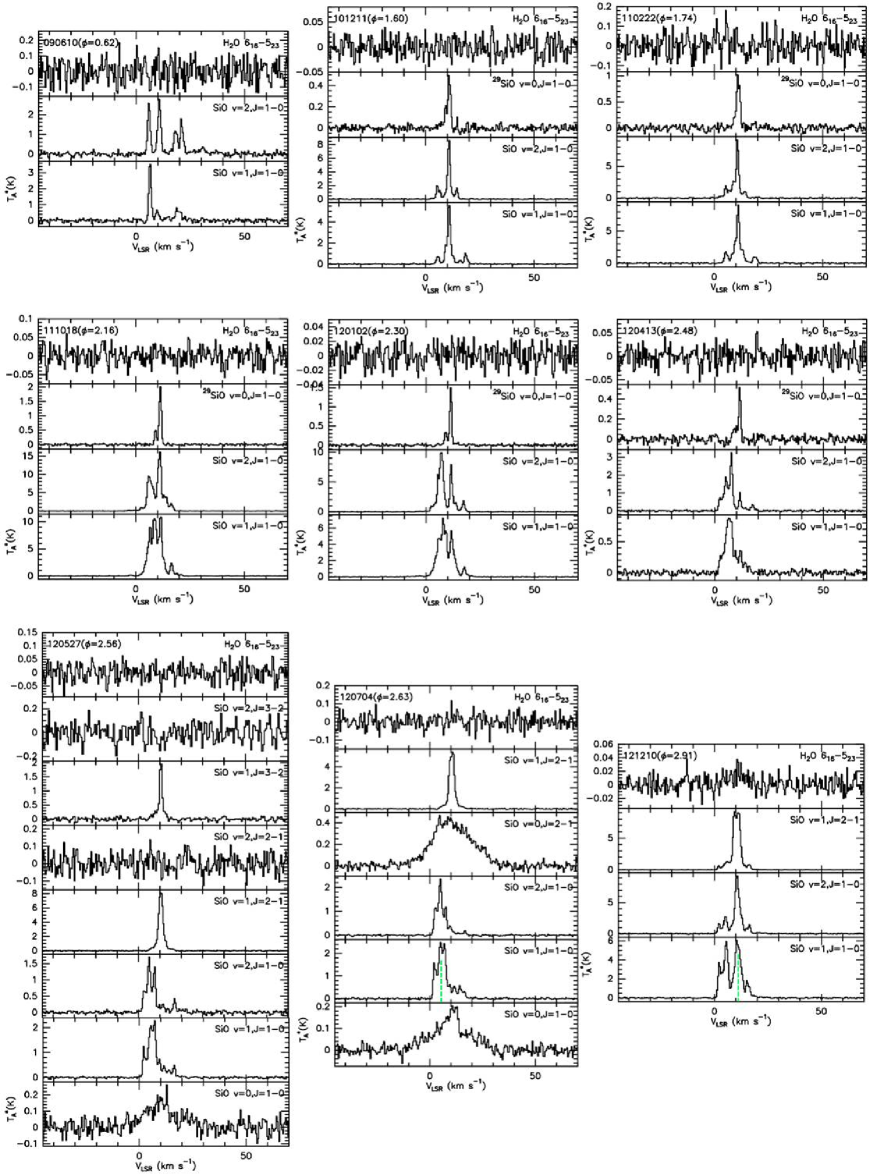
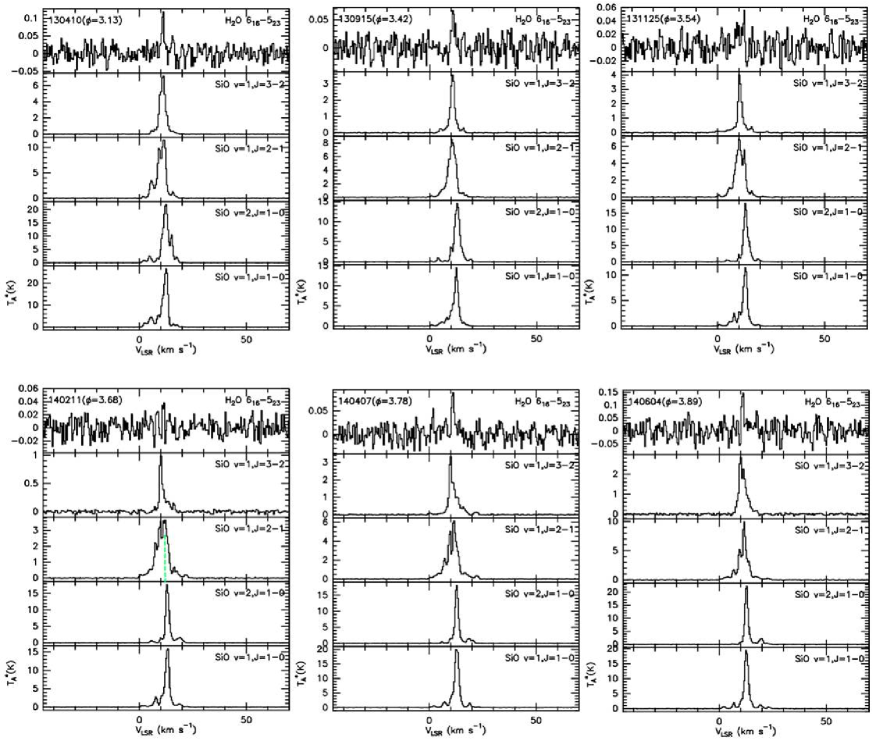
Figure 1 shows our monitoring epochs with respect to the optical light curve of TX Cam. The H2O maser detected epochs are indicated with green arrows. Figure 2 presents all the observed spectra of the H2O masers according to the observational dates including the detected H2O maser lines. As shown in Figure 2 and Table 2, we can confirm the detection of H2O maser lines at 5 epochs from April 2013 to June 2014. The intensities of the H2O maser lines are very weak, from 0.06 K to 0.15 K, and they are detected around the stellar velocity of 11.0 km s-1 (Feast & Whitelock 2000). Figure 3 displays the spectra of H2O and SiO masers which are simultaneously obtained at the same epoch.
We confirm that the H2O maser emission is very weak compared to SiO masers and also occurs around the peak velocity of SiO masers. These H2O maser lines are detected from the Mira variable star TX Cam for the first time. The previously undetected H2O maser was considered to be related with a transition object from oxygen-rich to carbon-rich stars (Cho & Ukita 1995). The detection of the H2O maser in relation with the characteristics of TX Cam will be discussed in the next section.
In Figure 3, one can compare line profile features among SiO = 1–0, = 2–1, and = 3–2 masers. The spectra of SiO = 1–0, = 2–1, and = 3–2 masers exhibit different intensities and peak velocities even at same epoch according to their different maser conditions. In addition, SiO = 1, 2, = 1–0 spectra were not repeated at similar optical phases as shown in spectra at the epochs June 10, 2009 (090610, = 0.62), December 11, 2011 (111211, = 1.60), July 4, 2012 (120704, = 2.63), and February 11, 2014 (140211, = 3.68). The SiO = 0, = 1–0, = 2–1 spectra relative to May 27, 2012 (120527) and July 4, 2012 (120704) show a broad and parabolic shape (the FWZP of SiO = 0, = 1–0 lines = 37.41, 47.41 km s-1, FWZP of = 0, = 2–1 line = 47.5 km s-1) compared to the SiO = 1, 2, = 1–0, = 2–1, and = 3–2 maser lines (the FWZP of = 1, 2, = 1–0 masers = 23.89, 22.75 km s-1, and FWZP of = 1, = 2–1 maser = 18.66 km s-1) because they originate from thermal emission. In addition, the SiO = 0, = 1–0 spectra show a combination of thermal parabolic and spike emission due to partial maser emission. The expansion velocity of TX Cam can be measured to be 23.7 km s-1 from the half of the full width at zero power of these thermal lines. The peak antenna temperature variations of SiO = 1, = 1–0 masers are shown in Figure 1, together with the optical light curve. The behavior of the SiO intensity curves corresponds well with the optical light curve, although the monitoring time interval and numbers are limited. However, it is difficult to confirm the phase lag of SiO maxima with respect to the optical maxima although the SiO intensity shows a maximum on April 10, 2013 (at = 3.13, the first detection phase of H2O) because our monitoring epochs around the optical maxima are very limited. The SiO = 2, = 2–1 and = 3–2 masers were not detected near the minimum optical phase = 2.56 (May 27, 2012) as shown in Figure 3.
4 Discussion
4.1 Detection of the H2O Maser Emission
The H2O maser emission has started to be detected from April 10, 2013 ( = 3.13). Our high sensitivity observations (0.4–1.2 Jy in 2013 – 2014) together with our monitoring observations over three periods extended from the optical maximum to minimum phases led us to detect the H2O maser. The detection limits of the Benson & Little-Marenin (1996) and Shintani et al. (2008) observations were about or above 1 Jy. Another possibility for the detection of the H2O maser may be a change of physical and chemical conditions for pumping the H2O maser in TX Cam since 2013. However, it is difficult to accept those rapid changes without confirming previous long-term monitoring results of H2O masers and other wavelength spectroscopic results. TX Cam showed unusual infrared and chemical characteristics for a known oxygen-rich AGB star although it has shown a normal feature as a Mira variable star. These unusual characteristics were discussed by Cho & Ukita (1995), and this is why TX Cam is located in the region VII of the IRAS two-color diagram (van der Veen & Habing 1988) due to a large IRAS flux ratio of S(60)/S(25). The region VII contains a large number of variable stars with C-rich circumstellar shells. In the case of TX Cam, carbon-bearing molecules are detected with particularly high abundances (Lindqvist et al. 1988, 1992). Therefore, this star is considered as a transition object between oxygen-rich and carbon-rich stars. If this star is a transition object, for example, in a similar stage as an S star, the H2O maser emission may not be detected, as well as in a typical S star Cyg. However, the H2O maser was detected despite its intensity (peak antenna temperature: 0.06 – 0.15 K) compared with other Mira variable stars. In particular, the intensity ratios of H2O with respect to SiO ( = 1, = 1–0) masers are very low, ranging from 0.0045 to 0.0077. These intensity ratios are above 0.1 for almost all of AGB stars (Kim et al. 2010). Exceptions appear in R Cas and R Leo, which also have very low intensity ratios less than 0.1 at most optical phases.
The Mira variable stars TX Cam, R Cas, and R Leo show the rare maser SiO = 2, = 2–1 line. Olofsson et al. (1981) explained that the weakness of the = 2, = 2–1 line in oxygen-rich stars may be attributed to an infrared line overlap of H2O with the = 1, = 0 = 2, = 1 line. Therefore, they suggested that for these H2O deficient stars, the rare maser SiO = 2, = 2–1 line can occur without the line overlap disturbance. The SiO = 2, = 2–1 maser emission is also detected from the S star Cyg in which the H2O maser is not detected. Cho & Ukita (1995) also suggested that the detection of another rare maser 29SiO = 1, = 1–0 line from TX Cam can be explained by a similar line overlap of H2O. In these stars, enough oxygen may not be available for forming H2O molecule as suggested by Benson & Little-Marenin (1996). In addition, long-term and regular monitoring observations of 22 GHz H2O maser are required for tracing the continuous detectability and the variations of intensities according to the optical phases together with sub-mm H2O maser observations.
4.2 Intensity Ratio and Peak Velocity Pattern among SiO Masers According to the Optical Phases
The peak antenna temperature ratios between the vibrational state SiO = 1 and = 2, = 1–0 masers are plotted in Figure 1. The variation of = 2 / = 1 peak temperature ratio does not show a large spread with respect to the ratio 1 except the ratio 3.69 on April 13, 2012 ( = 2.48). The peak antenna temperature of the SiO = 1, = 1–0 maser at = 2.48 is quite low. The average value of these ratios at 14 epochs (except the value at = 2.48) is about 1.14. Furthermore, the peak antenna temperatures of SiO = 2, = 1–0 show large values at 10 epochs among 15 observed epochs compared to those of = 1. Alcolea et al. (1999) reported that the = 2 / = 1 integrated flux ratio is almost unity independently of the phase. This intensity ratio may be associated with the evolutionary stage of a late AGB phase as indicated by Cho & Kim (2012). The intensity of the SiO = 2 maser can increase according to the development of a hot dust shell from a late AGB phase to a post-AGB one (Cho & Kim 2012). This tendency clearly appeared in post-AGB stars accompanying only = 2, = 1–0 maser detections without = 1 detections (Yoon et al. 2014). Therefore, this tendency seems to appear in the very late M-type star TX Cam (M8–M10).
| Date(phase) | |||
|---|---|---|---|
| 120527(2.56) | 3.56 | 0.86 | 0.24 |
| 120704(2.63) | 2.17 | ||
| 121210(2.91) | 1.51 | ||
| 130410(3.13) | 0.43 | 0.27 | 0.63 |
| 130915(3.42) | 0.59 | 0.24 | 0.41 |
| 131125(3.54) | 0.60 | 0.35 | 0.59 |
| 140211(3.68) | 0.23 | 0.06 | 0.27 |
| 140407(3.78) | 0.31 | 0.17 | 0.54 |
| 140604(3.89) | 0.51 | 0.15 | 0.28 |
In Table 3, we provide the variation of the peak antenna temperature ratios among SiO = 1, = 1–0, = 2–1, and = 3–2 masers, according to nine optical phases of our monitoring observations. The peak antenna temperature ratios of = 2–1 / = 1–0 exhibit a large spread compared to those of P.T.( = 3–2) / P.T.( = 1–0) and P.T.( = 3–2) / P.T.( = 2–1). In particular, those peak ratios exhibit a large spread from the second to the third period, despite similar optical phases. These differences seem to be related with a SiO maser pumping mechanism, which responds to different local physical conditions among different SiO maser lines. The average peak antenna temperature ratios among SiO = 1, = 1–0, = 2–1, and = 3–2 masers are estimated to be P.T.( = 2–1) / P.T.( = 1–0) = 0.85, P.T.( = 3–2) / P.T.( = 1–0) = 0.30, and P.T.( = 3–2) / P.T.( = 2–1) = 0.42, respectively. These SiO intensity ratios can be deeply influenced by dust, as shown in the Gray et al. (2009) model. The previous authors suggested that collisional and radiative pumping are spatially associated, via close association of shock and radii of the SiO pumping band at 8.13 micron of dust. The peak antenna temperature ratios obtained from simultaneous monitoring observations of multi-frequencies will provide good constraints for these maser pumping models.
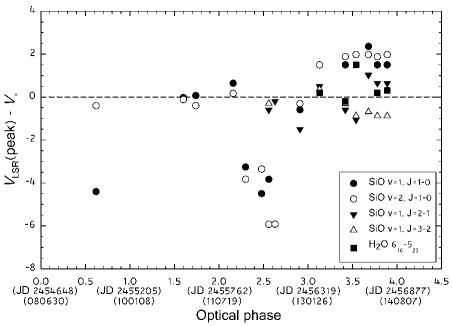
In Figure 4, the shift of the peak velocities of the 22 GHz H2O and SiO masers with respect to the stellar velocity is shown according to the observed optical phases. As clear from the figure, the H2O maser occurs near the stellar velocity during our monitoring interval. On the other hand, SiO masers show a spread in both the blue- and red-shifted part with respect to the stellar velocity. One of the reasons can be the difference of H2O and SiO maser regions. Namely, SiO masers arise from a close to central star 2–4 (Diamond et al. 1994) which is directly influenced by pulsating motion. The H2O masers occur farther out from above dust formation layers where the expansion velocity approaches the terminal velocity of the mass loss.
Among SiO masers, the peak velocities of SiO = 2–1, and = 3–2 masers show a smaller spread with respect to the stellar velocity than those of SiO = 1–0 masers. It is difficult to discuss the systematic pulsation effect on the shift of SiO peak velocities due to limited monitoring data. Simultaneous monitoring observations of SiO = 2–1 and = 3–2 masers using the TRAO 14 m telescope (Kang et al. 2006) showed that the main peak component of the = 1, = 2–1 maser has dominant red-shifted features compared to the = 1, = 3–2 maser. These differences may originate from the differences of maser regions among SiO = 1–0, = 2–1, and = 3–2 masers including the differences of masing conditions. The VLBA observations of SiO = 1, = 1–0 and = 2–1 masers showed that the SiO = 1, = 2–1 arise farther away than the SiO = 1, = 1–0 in the case of the OH/IR star WX Psc (Soria-Ruiz et al. 2004). However, they arise from almost the same distance from the central star for Cyg. These VLBI observations of SiO = 1–0 and = 2–1 masers are very limited due to lack of an existing VLBI system which can be operated at both SiO = 1–0 and = 2–1 maser observing bands. Furthermore, except for the KVN, there are no VLBI systems in the world that can be operated in the SiO = 3–2 observing band. Therefore, KVN will play an important role in near future.
5 Summary
Our results can be summarized as follows.
1. We detected the 22 GHz H2O maser emission from a Mira variable star TX Cam for the first time. The 22 GHz H2O maser was detected near the stellar velocity at five epochs from April 10, 2013 ( = 3.13) to June 4, 2014 ( = 3.89) including the period around minimum optical phases. The peak antenna temperatures were very weak (0.06 – 0.15 K) compared to SiO = 1, = 1–0 masers (the peak antenna temperature ratio between P.T.(SiO = 1, = 1–0) / P.T.(H2O) = 0.0045 at minimum). These weak intensities of the H2O maser emission may suggest that the existence of rare masers SiO = 2, = 2–1 and 29SiO = 1, = 1–0 lines is associated with an infrared line overlap of H2O.
2. The average value of peak antenna temperature ratios between the vibrational state SiO = 1 and = 2, = 1–0 masers at 14 epochs (except the value at = 2.48) is about 1.14. Furthermore, the peak antenna temperatures of SiO = 2, = 1–0 show large values at 10 epochs among 15 observed epochs compared to those of = 1. The intensity of SiO = 2 maser can increase according to the development of a hot dust shell from a late AGB phase to a post-AGB one. Therefore, this tendency seems to appear in the very late M-type star TX Cam (M8–M10).
3. The peak antenna temperature ratios of = 2–1 / = 1–0 show a large spread compared to those of P.T.( = 3–2) / P.T.( = 1–0) and P.T.( = 3–2) / P.T.( = 2–1). In particular, the peak antenna temperature ratios of = 2–1 / = 1–0 exhibit a large spread despite similar optical phases in the second and third periods. The average peak antenna temperature ratios among SiO = 1, = 1–0, = 2–1, and = 3–2 masers are estimated to be P.T.( = 2–1) / P.T.( = 1–0) = 0.85, P.T.( = 3–2) / P.T.( = 1–0) = 0.30, and P.T.( = 3–2) / P.T.( = 2–1) = 0.42, respectively.
4. The peak velocities of SiO = 2–1 and = 3–2 masers occur closer to the stellar velocity than those of SiO = 1–0 masers. These differences may be originated from the differences of maser regions among SiO = 1–0, = 2–1, and = 3–2 masers including the differences of masing conditions. The simultaneous VLBI monitoring observations of SiO = 1–0, = 2–1, and = 3–2 masers are highly required for determining the relative distributions and the variation of these masers, according to the stellar pulsation.
Acknowledgements.
This work was supported by Basic and Fusion Research Programs (2010–2014) and also partially supported by KASI–Yonsei Joint Research Program “Degree and Research Center Program” funded by the National Research Council of Science and Technology (NST). In this research we have used the information from the AAVSO International Database operated at AAVSO Headquarter, 25 Birch Street, Cambridge, MA 02138 and SIMBAD database operated at CDS, Strasbourg, France.References
- Alcolea et al. (1999) Alcolea, J., Pardo, J. R., Bujarrabal, V., et al. 1999, Six years of short-spaced monitoring of the = 1 and = 2, = 1–0 28SiO maser emission in evolved stars, A&AS, 139, 461
- Benson & Little-Marenin (1996) Benson, P. J., & Little-Marenin, I. R. 1996, Water masers associated with circumstellar shells, ApJS, 106, 579
- Bowers & Hagen (1984) Bowers, P. F., & Hagen, W. 1984, Luminosities and mass loss rates of OH/H2O maser stars, ApJ, 285, 637
- Cho et al. (1998) Cho, S.-H., Chung, H.-S., Kim, H.-R., et al. 1998, Observations of SiO ( = 0, 1, 2) = 3–2 and = 2–1 emission in late-type stars, ApJS, 115, 277
- Cho & Kim (2012) Cho, S.-H., & Kim, J. 2012, Simultaneous observations of SiO and H2O masers toward known stellar SiO maser sources, AJ, 144, 129
- Cho & Ukita (1995) Cho, S.-H., & Ukita, N. 1995, Detection of the 29SiO = 1, = 1–0 Maser from TX Camelopardalis, PASJ, 47, L1
- Cho & Ukita (1998) Cho, S.-H., & Ukita, N. 1998, A survey of 30SiO emission from evolved stars, AJ, 116, 2495
- Diamond & Kemball (2003) Diamond, P. J., & Kemball, A. J. 2003, A movie of a star: Multiepoch very long baseline array imaging of the SiO masers toward the Mira variable TX Cam, ApJ, 599, 1372
- Diamond et al. (1994) Diamond, P. J., Kemball, A. J., Junor, W., et al. 1994, Observaiton of a ring structure in SiO maser emission from late-type stars, ApJ, 430, L61
- Feast & Whitelock (2000) Feast, M. W., & Whitelock, P. A. 2000, Mira kinematics from Hipparcos data: a Galactic bar to beyond the Solar circle, MNRAS, 317, 460
- Gonidakis et al. (2010) Gonidakis, I., Diamond, P. J., & Kemball, A. J. 2010, Kinematics of the = 1, = 1–0 SiO masers at 43 GHz toward TX Cam – a new 73-frame movie, MNRAS, 406, 395
- Gonidakis et al. (2013) Gonidakis, I., Diamond, P. J., & Kemball, A. J. 2013, A long-term VLBA monitoring campaign of the = 1, = 1–0 SiO masers toward TX Cam –I. Mprphology and shock waves, MNRAS, 433, 3133
- Gray et al. (1999) Gray, M. D., Humphreys, E. M. L., & Yates, J. A. 1999, A survey of high-frequency SiO masers in supergiants and AGB stars, MNRAS, 304, 906
- Gray et al. (2009) Gray, M. D., Wittkowski, M., Scholz, M., Humphreys, E. M. L., Ohnaka, K., & Boboltz, D. 2009, SiO maser emission in Miras, MNRAS, 394, 51
- Han et al. (2008) Han, S.-T., Lee, J.-W., Kang, J., et al. 2008, Millimeter-wave receiver optics for Korean VLBI Network, Int. J Infrared Milli Waves, 29, 69
- Han et al. (2013) Han, S.-T., Lee, J.-W., Kang, J., et al. 2013, Korean VLBI Network receiver optics for simultaneous multifrequency observation: Evaluation, PASP, 125, 539
- Herpin et al. (1998) Herpin, F., Baudry, A., Alcolea, J., & Cernicharo, J. 1998, On the origin of the high velocity SiO maser emission from late-type stars, A&A, 334, 1037
- Jewell et al. (1987) Jewell, P. R., Dickinson, D. F., Snyder, L. E., & Clemens, D. P. 1987, High-excitation SiO masers in evolved stars, ApJ, 323, 749
- Kang et al. (2006) Kang, J., Cho, S.-H, Kim, H.-G., et al. 2006, Time monitoring observations of SiO = 2–1 and = 3–2 maser emission toward late-type stars, ApJS, 165, 360
- Kholopov et al. (1985) Kholopov, P. N., et al. 1985, General Catalogue of Variable Stars. Moscow Publishing House, Moscow
- Kim et al. (2010) Kim, J., Cho, S.-H., Oh, C. S., & Byun, D.-Y. 2010, Simultaneous observations of SiO and H2O masers toward known stellar SiO and H2O maser sources, ApJS, 188, 209
- Knapp & Morris (1985) Knapp, G. R. & Morris, M. 1985, Mass loss from evolved stars. III. Mass loss rates for fifty stars from CO = 1–0 observations, ApJ, 292, 640
- Lindqvist et al. (1988) Lindqvist, M., Nyman, L.-Å., Olofsson, H., & Winnberg, A. 1988, Carbon-bearing molecules and SiS in oxygen-rich circumstellar envelopes, A&A, 205, L15
- Lindqvist et al. (1992) Lindqvist, M., Olofsson, H., Winnberg, A., & Nyman, L.-Å. 1992, Carbon-bearing molecules in the envelopes around oxygen-rich stars, A&A, 263, 183
- Olivier et al. (2001) Olivier, E. A., Whitelock, P., & Marang, F. 2001, Dust-enshrouded asymptotic giant branch stars in the solar neighbourhood, MNRAS, 326, 490
- Olnon et al. (1980) Olnon, F. M., Winnberg, A., Matthews, H. E., & Schultz, G. V. 1980, Maser emission from infrared stars. I. New OH and H2O observations, A&AS, 42, 119
- Olofsson et al. (1981) Olofsson, H., Rydbeck, O. E. H., Lane, A. P., & Predmore, C. R. 1981, Detection of the SiO ( = 2, = 2–1) maser, ApJ, 247, L81
- Pardo et al. (2004) Pardo, J. R., Alcolea, J., Bujarrabal, V., et al. 2004, 28SiO = 1 and = 2, = 1–0 maser variability in evolved stars. Eleven years of short spaced monitoring, A&A, 424, 145
- Shintani et al. (2008) Shintani, M., Imai, H., Ando, K., et al. 2008, Statistical properties of stellar H2O masers – Results of three-year single-dish observations with the VERA Iriki telescope, PASJ, 60, 1077
- Soria-Ruiz et al. (2004) Soria-Ruiz, R., Alcolea, J., Colomer, F., et al. 2004, High resolution observations of SiO masers: Comparing the spatial distribution at 43 and 86 GHz, A&A, 426, 131
- Spencer et al. (1977) Spencer, J. H., Schwartz, P. R., Waak, J. A., & Bologna, J. M. 1977, Observations of 7-mm SiO sources, AJ, 82, 706
- van der Veen & Habing (1988) van der Veen, W. E. C. J. & Habing, H. J. 1988, The IRAS two-colour diagram as a tool for studying late stages of stellar evolution, A&A, 194, 125
- Yoon et al. (2014) Yoon, D.-H., Cho, S.-H., Kim, J., Yun, Y. J., & Park, Y.-S. 2014, SiO and H2O maser survey toward post-asymptotic giant branch and asymptotic giant branch stars, ApJS, 211, 15