Production of N2 Vegard-Kaplan and Lyman-Birge-Hopfield emissions on Pluto
Abstract
We have developed a model to calculate the emission intensities of various vibrational transitions of N2 triplet band and Lyman-Birge-Hopfield (LBH) band emissions in the dayglow of Pluto for solar minimum, moderate, and maximum conditions. The calculated overhead intensities of Vegard-Kaplan (), First Positive (), Second Positive (), Wu-Benesch (), Reverse First Positive, and LBH (– ) bands of N2 are 17 (74), 14.8 (64), 2.4 (10.8), 2.9 (12.7), 2.9 (12.5), and 2.3 (10) R, respectively, for solar minimum (maximum) condition. We have predicted the overhead and limb intensities of VK (150-190 nm) and LBH (120-190 nm) bands of N2 on Pluto for the New Horizons (NH) flyby condition that can be observed by Alice: the ultraviolet imaging spectrograph also know as P-Alice. The predicted limb intensities of VK and LBH bands peak at radial distance of 2000 km with the value of about 5 (13) and 9.5 (22) R for solar zenith angle 60∘ (0∘), respectively. We have also calculated overhead and limp intensities of few prominent transition of CO Fourth Positive bands for NH flyby condition.
keywords:
Pluto , Pluto Atmosphere , Ultraviolet observations , Upper atmosphere , New Horizon , Aeronomy , N2 emission, Dayglow1 Introduction
The atmosphere of Pluto is believed to be hydrodynamically escaping and extending to heights comparable to its radius (Krasnopolsky and Cruikshank, 1999; Strobel, 2008). Most of the information about the atmosphere of Pluto have come from the ground based occultation observations (Elliot et al., 2007; Young et al., 2008). Schindhelm et al. (2014) have provided a brief review of ultraviolet spectra observed from Pluto-Charon system by IUE. The data from these occultation observations are used to understand Pluto’s atmosphere and are instrumental in the recent developments of general circulation models (Zalucha and Gulbis, 2012). Occultation studies have also shown that Pluto’s atmosphere has undergone a surface pressure expansion by a factor of 2 from 1988 to 2002, followed by a stabilization from 2002 to 2007 (Elliot et al., 2007; Young et al., 2008). The atmosphere of Pluto is similar to the Saturn’s largest moon Titan: dominated by the N2 (97-99%), followed by CH4 (3-1%), and a trace amount of CO. Titan’s extreme ultraviolet (EUV) dayglow spectra is dominated by N2 Carroll-Yoshino (CY) Rydberg bands, while far ultraviolet (FUV) spectra is dominated by N2 Lyman-Birge-Hopfield (LBH) and Vegard-Kaplan (VK) bands, and N and N+ lines (Ajello et al., 2008; Stevens et al., 2011). Pluto’s dayglow spectrum is expected to be similar to that of Titan. Summers et al. (1997) have estimated the overhead emission intensities of possible airglow features in the atmosphere of Pluto, and calculated vertical column rates of various emission of and N, and N+ in airglow of Pluto.
New Horizons (NH) flyby of Pluto in July 2015 and will be the first visit of a man made object to Pluto. NH is carrying a host of instruments to understand the atmosphere and surface properties of Pluto. One of the instruments, ALICE: an ultraviolet imaging spectrograph (Pluto-ALICE or P-ALICE), is aimed at observing Pluto at EUV and FUV wavelength regions, and might observe various emissions from N2 and its dissociated products mentioned above. We have developed the N2 triplet band emission model for atmospheres of Mars, Venus, and Titan (Jain and Bhardwaj, 2011; Bhardwaj and Jain, 2012a, b). In the present study, we have extended the N2 triplet band emission model to Pluto, and have added the calculation of LBH (singlet) band emissions. We have made calculations for solar minimum, moderate, and maximum conditions as well as for the New Horizons flyby conditions. These model calculations will help in making observations of Pluto’s airglow by P-ALICE. In this study, we give volume emission rate and limb intensity of N2 VK and LBH in the wavelength region 120–190 nm region, which lies in spectral range of P-ALICE (Stern et al., 2008). For the N2 VK band major focus is given to transitions that lie between 150 and 190 nm region because emissions in wavelength region 120–150 nm constitute less than 1% of N2 VK emission in wavelength region 120–190 nm (Jain and Bhardwaj, 2011; Bhardwaj and Jain, 2012a, b). We have also reported limb and overhead intensities for CO fourth positive bands.
2 Model
Model atmosphere of Pluto for solar minimum, moderate, and maximum conditions, and for NH arrival condition is taken from Strobel (2008). The mixing ratios of N2, CH4, and CO is taken as 0.97, 0.03, and 0.00046, respectively (Strobel, 2008). The mean Sun-Pluto distance is taken as 30 AU for solar minimum, moderate, and maximum conditions, and 33.4 AU for the NH arrival time prediction.
We have used the solar irradiance measured at Earth (between 2.5 to 120.5 nm) by Solar EUV Experiment (SEE, Version 10.2) (Woods et al., 2005; Lean et al., 2011) for solar minimum (F10.7 = 68), moderate (F10.7 = 150), and maximum (F10.7 = 250) conditions at 1 nm spectral resolution. For the NH flyby prediction (July 2015), the SEE solar flux is taken as on 1 May 2011, for which F10.7 = 106; the F10.7 solar flux index value is based on the solar cycle prediction made by Hathaway et al. (1994) (http://solarscience.msfc.nasa.gov/predict.shtml). The solar flux is scaled to the Sun-Pluto distance of 30 AU for solar minimum, moderate, and maximum conditions, and 33.4 AU for NH flyby predicted intensity calculations. The solar zenith angle (SZA) is taken as 60∘ unless otherwise mentioned in the text. All distances mentioned are radial distances measured from the centre of the planet.
The limb intensity of various airglow emissions is calculated as
| (1) |
where is the density of the th gas at altitude , is the total inelastic cross section for the th gas, is the electron impact cross section for the th state of the th gas, for which the threshold is , (Z, E) is the photoelectron production rate at altitude , is minimum excitation energy for excited state of th gas, is abscissa along the horizontal line of sight, and is the two-dimensional Analitical Yield Spectra (AYS), which embodies the non-spatial information of degradation process. It represents the equilibrium number of photoelectrons per unit energy at an energy resulting from the local energy degradation of an incident electron of energy (Bhardwaj et al., 1990, 1996; Bhardwaj, 2003; Bhardwaj and Michael, 1999; Bhardwaj and Jain, 2009). While calculating the line of sight intensities of various LBH transition, we have taken absorption by N2 and CH4 into consideration, because below 140 nm, absorption by atmospheric gases can significantly affect the calculated limb intensities.
Electron impact excitation following XUV photoionization is the major source of triplet band emissions. The details of the model calculation of N2 triplet band emissions is provided in our earlier studies on Mars (Jain and Bhardwaj, 2011), Venus (Bhardwaj and Jain, 2012a), and Titan (Bhardwaj and Jain, 2012b). In the present paper we have extended the model to include the N2 LBH band emission calculation. Johnson et al. (2005) have reported the excitation cross section of a state. Young et al. (2010) have measured emission cross section for the a () – X () and a () – X () transitions. The shape and magnitude of their relative emission cross section of a(3,0) and a(2,0) emission is consistent with the results of Johnson et al. (2005). Young et al. (2010) have not given emission cross section for entire LBH band system, though they suggested the emission cross section value of cm2 at 100 eV. The electron impact excitation cross section of singlet (a1, a′1, w1) states are taken from Johnson et al. (2005) and fitted analytically for ease of usage in the model (see Jain and Bhardwaj, 2011, and references therein). We have included radiative cascading between three lowest singlet states of N2 (a, a, and w). For state, vibrational levels which lie above are not considered since these vibrational levels predissociate, and we have excluded the cascade contributions from and states vibrational levels which lie above of the state (Eastes, 2000; Eastes et al., 2011). The radiative transition data for the , , and are taken from Gilmore et al. (1992). For the transition, lifetime of 17 ms is taken for all vibrational level (Eastes, 2000). The collisional quenching rates of states are taken as described by Eastes (2000).
3 Results
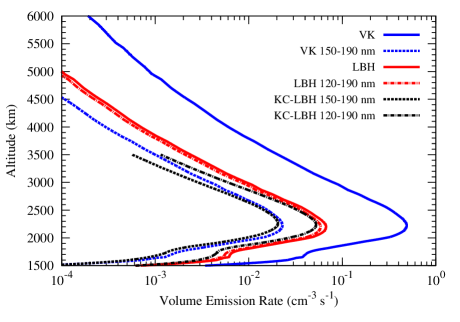
The volume emission rates of vibrational transitions of various triplet and LBH bands of N2 on Pluto are calculated for the three solar conditions. Figure 1 shows the volume emission rates of N2 VK (150-190 nm) and LBH (120-190 nm) bands for solar moderate condition at SZA = 60∘. Total emission rates of N2 VK and LBH bands are also shown in the figure.
| Band | Intensity (R) | |||
| Minimum | Moderate | Maximum | NH11footnotemark: 1 | |
| Prediction | ||||
| Triplet bands | ||||
| VK () (137–1155 nm) | 17 | 37 (30.3)22footnotemark: 2 | 74 | 25.3 |
| 137–190 nm | 0.8 | 1.7 (1.4) | 3.5 | 1.2 |
| 200–300 nm | 5.9 | 13 (10.5) | 25.8 | 8.8 |
| 300–400 nm | 6.6 | 14 (11.8) | 28.9 | 9.8 |
| 400–800 nm | 3.7 | 8 (6.6) | 16 | 5.5 |
| 1P () (263–94129 nm) | 14.8 | 32 (26.2) | 64.4 | 21.9 |
| 2P () (268–1140 nm) | 2.4 | 5 (4.4) | 10.8 | 3.7 |
| (399–154631 nm) | 2.9 | 6 (5.1) | 12.7 | 4.3 |
| (312–37699 nm) | 1.2 | 2.7 (2.2) | 5.4 | 1.8 |
| R1P () (739–74175 nm) | 2.9 | 6.3 (5.1) | 12.5 | 4.2 |
| (207–303 nm) | 3.3E-233footnotemark: 3 | 7.2E-2 (5.9E-2) | 0.14 | 4.9E-2 |
| (259–483 nm) | 5.2E-3 | 1.3E-2 (9.3E-3) | 2.3E-2 | 7.8E-3 |
| (1113–10127 nm) | 1.9E-2 | 4.2E-2 (3.5E-2) | 4.4E-2 | 2.9E-2 |
| Singlet bands | ||||
| LBH () (120–260 nm) | 2.3 | 4.9 (4) | 10 | 3.4 |
| 120–190 nm | 2 | 4.3 (3.5) | 8.8 | 3 |
VK = Vegard-Kaplan; 1P = First Positive; 2P = Second Positive, LBH = Lyman-Birge-Hopfield band,
R1P = Reverse First Positive
11footnotemark: 1Prediction for New Horizons arrival on Pluto (F10.7 = 106) for Pluto-Sun distance
of 33.4 AU.
22footnotemark: 2Values in the parenthesis are overhead intensities calculated by using
the M1 model atmosphere of Krasnopolsky and Cruikshank (1999) for solar moderate condition.
33footnotemark: 33.3E-2 = .
Emission rates of both VK (150–190 nm) and LBH (120–190 nm) bands peak at radial distance of about 2200 km, with a value of 0.02 and 0.06 cm-3 s-1, respectively. Table 3 shows the total height-integrated overhead intensity for Vegard-Kaplan (VK) (), First positive (), Second Positive (), Herman-Kaplan (HK) (), , Reverse First Positive (), , and Lyman-Birge-Hopfield () bands of N2 at SZA=60∘, for minimum, moderate, and maximum solar conditions. Since many bands of N2 span a large wavelength region, the overhead intensities of VK and LBH bands in different wavelength regions are also given in the Table 3. Summers et al. (1997) have calculated volume emission rates of various emissions of N2 and N on Pluto for moderate solar activity condition at Sun-Pluto distance of 30 AU. Their calculated volume emission rates peaks at 2000 km radial distance. For N2 LBH bands, Summers et al. (1997) have calculated an overhead intensity of about 5.7 R for CH4 mixing ratio of . Our calculated overhead intensity of N2 LBH is 4.9 R for solar moderate condition. The minor difference in the two studies may largely be due to the cross section for N2 LBH band used in the two studies and the input solar flux model.
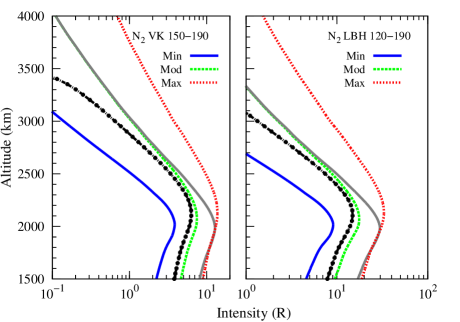
Figure 2 shows the calculated limb intensities of N2 VK (150-190 nm) and LBH (120-150 nm) bands on Pluto for solar minimum, moderate, and maximum conditions. The limb intensity of N2 VK (LBH) band peaks at radial altitude of about 2025, 2075, and 2125 km with magnitude of 3.8 (9.1) R, 7.4 (17.5) R, and 13.8 (32.9) R for solar minimum, moderate, and maximum conditions, respectively. Calculated limb intensities of N2 VK and LBH bands at SZA = 0∘ are also shown for solar moderate condition in Figure 2, which peak at 1995 and 1988 km with values of 12.8 and 29.7 R, respectively. We have also calculated limb intensities for other solar zenith angles. For SZA = 30∘ (45∘) the calculated limb intensities of VK (150–190 nm) and LBH (120–190 nm) bands peak at radial altitude of 2000 (2020) km with values of 11.3 (9.6) R and 26.5 (22.6) R, respectively.
4 Discussion
4.1 Effect of model atmosphere
Krasnopolsky and Cruikshank (1999) have developed a detailed photochemical model of Pluto’s atmosphere. Based on the occultation curve data, they have used two atmospheric models in their calculation for solar moderate condition and SZA = 60∘; one assuming atmospheric tropopause at 1195 km (M1), and other assuming planet’s surface at 1195 km (M2). In both models N2 density is similar up to about 2000 km, and above this distance N2 is higher in model M1. To evaluate the effect of model atmosphere on the calculated intensity, we have taken model atmosphere M1 from the study of Krasnopolsky and Cruikshank (1999) for the moderate solar activity condition. Figure 1 shows volume emission rates of N2 VK (150-190 nm) and LBH (120-190 nm) bands calculated by using the M1 model atmosphere from Krasnopolsky and Cruikshank (1999) in addition to those using model atmosphere of Strobel (2008). The emission rate peaks at about same radial distance for the two model atmospheres, but the magnitude of emission rate at the peak is about 15% higher on using the model atmosphere of Strobel (2008). Table 3 presents the overhead intensities calculated by using the M1 model atmosphere from Krasnopolsky and Cruikshank (1999).
4.2 Prediction
P-ALICE instrument is an imaging spectrograph aboard the New Horizons mission to Pluto/Charon and the Kuiper belt, with a spectral passband of 52–187 nm (see Stern et al., 2008, for details). The main objective of P-ALICE instrument is to perform spectroscopic investigations of Pluto’s atmosphere and surface at EUV and FUV wavelengths. The spectral passband of P-ALICE is very similar to the Cassini-UVIS instrument, which observed both N2 VK (150–190 nm) and LBH (120–190 nm) bands in the dayglow of Titan (Stevens et al., 2011). New Horizons flyby of Pluto will occur around July 2015. For the conditions similar (see Section 2) to NH flyby of Pluto, we predict the intensity of N2 VK and LBH bands within the spectral passband of P-ALICE. With given baseline trajectory (cf. Guo and Farquhar, 2005), for a limb observation solar zenith angle variation may not be significant, hence we have predicted limb intensities for fixed solar zenith angles of 0∘, and 60∘.
As discussed earlier, intensity of N2 VK bands in 120-150 nm wavelength region is very small (0.02%), which make them difficult to observe in the dayglow spectra, and explain their absence in the dayglow spectrum of Titan (Stevens et al., 2011; Bhardwaj and Jain, 2012b). However, N2 VK (150–190 nm) and LBH (120–190 nm) bands are observed on Titan (Stevens et al., 2011). For the NH flyby condition, the calculated overhead intensities of various triplet and LBH bands of N2 is given in Table 3. The overhead intensities of N2 VK (150–190 nm) and LBH (120–190 nm) bands are 1.2 and 3 R, respectively. Prominent emissions of N2 VK and LBH bands in wavelength region 150–190 and 120–190 nm are given in Table 2. The N2 VK (7-0), (8-0), and (9-0) are dominant emissions in wavelength region 150–190 nm with intensities of 0.21, 0.2, and 0.11R, respectively. In 120–150 nm region, N2 LBH (2-0), (3-0), (4-0), and (5-0) bands are the dominant emissions with intensities of 0.18, 0.22, 0.18, and 0.11 R, respectively. On Titan, our calculations suggest that intensities of N2 VK (8-0) at 165.5 nm and (11-0) at 156.3 nm is about 2 to 3 orders of magnitude higher than that of CI 165.7 and 156.1 nm lines (Bhardwaj and Jain, 2012b), which were misidentified as possible source for carbon emissions near 165 and 156 nm (cf. Ajello et al., 2008; Stevens et al., 2011). On Pluto, we expect N2 VK (8-0) and (11-0) bands intensities to be higher than that of CI 165.7 and 156.1 nm lines.
We have also calculated overhead intensity and limb intensities of CO Fourth Positive (A – X) band by electron impact excitation of CO and by fluorescent scattaring. The electron impact emission cross section are taken from Avakyan et al. (1998) and fluorescence efficiencies for low solar activity conditions are taken from Tozzi et al. (1998). The overhead intensities of CO Fourth Positive (0,1; 159.7 nm), (1,4; 172.9 nm), (2,2; 157.6 nm), (3,0; 144.7 nm), and (4,0; 141.9 nm) emissions due to electron impact excitation (fluorescent scattering) are 1.4E-4 (2), 1.1E-4 (1.4), 1.2E-4 (1.1), 3.6E-4 (2.5), and 1.5E-4 (0.8) R, respectively, for NH flyby condition (see Table 2).
| Band | Band Origin | Intensity | Band | Band Origin | Intensity | |
|---|---|---|---|---|---|---|
| () | nm | (R) | () | nm | (R) | |
| Vegard-Kaplan (– ) | Lyman-Birge-Hopfield (– ) | |||||
| 3-0 | 185.3 | 2.1E-2 | 3-9 | 185.4 | 7.9E-2 | |
| 4-0 | 180.8 | 4.7E-2 | 4-0 | 132.5 | 1.8E-1 | |
| 5-0 | 176.5 | 8.2E-2 | 4-2 | 141.2 | 8.9E-2 | |
| 5-1 | 184.1 | 4.3E-2 | 4-4 | 150.8 | 5.9E-2 | |
| 6-0 | 172.6 | 1.3E-1 | 4-5 | 156.0 | 2.5E-2 | |
| 6-1 | 179.8 | 4.5E-2 | 4-6 | 161.6 | 1.1E-2 | |
| 7-0 | 168.9 | 2.1E-1 | 4-8 | 173.6 | 1.7E-2 | |
| 7-1 | 175.8 | 3.7E-2 | 4-9 | 180.1 | 5E-3 | |
| 8-0 | 165.5 | 2E-1 | 5-0 | 129.9 | 1.1E-1 | |
| 9-0 | 162.2 | 1.1E-1 | 5-1 | 133.9 | 3.7E-2 | |
| 10-0 | 159.2 | 5.1E-2 | 5-2 | 138.2 | 3.5E-2 | |
| 11-0 | 156.3 | 2.2E-2 | 5-3 | 142.7 | 2.3E-2 | |
| 12-0 | 153.6 | 1.1E-2 | 5-4 | 147.4 | 3.5E-2 | |
| Lyman-Birge-Hopfield (– ) | 4-7 | 1674 | 4E-2 | |||
| 0-1 | 150.1 | 3.3E-2 | 5-6 | 157.6 | 3.9E-2 | |
| 0-2 | 155.5 | 4.9E-2 | 5-8 | 169.0 | 2E-2 | |
| 0-3 | 161.2 | 4.4E-2 | 5-9 | 175.2 | 3.1E-2 | |
| 0-4 | 167.2 | 2.7E-2 | 6-0 | 127.3 | 5.4E-2 | |
| 1-0 | 141.6 | 8.0E-2 | 6-1 | 131.2 | 5E-2 | |
| 1-1 | 146.4 | 1.2E-1 | 6-3 | 139.6 | 3.6E-2 | |
| 1-2 | 151.5 | 4.6E-2 | 6-5 | 148.9 | 2.6E-2 | |
| 1-4 | 162.7 | 4E-2 | 6-7 | 159.2 | 1.4E-2 | |
| 1-5 | 168.8 | 7.6E-2 | 6-8 | 164.8 | 1.6E-2 | |
| 1-6 | 175.2 | 6.2E-2 | 6-10 | 176.9 | 1.9E-2 | |
| 1-7 | 182.1 | 3.3E-2 | 6-11 | 183.5 | 1E-2 | |
| 2-0 | 138.4 | 1.8E-1 | 6-3 | 139.6 | 3.6E-2 | |
| 2-1 | 143.0 | 9.4E-2 | 6-5 | 148.9 | 2.6E-2 | |
| 2-3 | 153.0 | 8.5E-2 | 6-7 | 159.2 | 1.4E-2 | |
| 2-4 | 158.5 | 6.1E-2 | 6-8 | 164.8 | 1.6E-2 | |
| 2-6 | 170.3 | 3.8E-2 | 6-10 | 176.9 | 1.9E-2 | |
| 2-7 | 176.8 | 8.6E-2 | 6-11 | 183.5 | 1E-2 | |
| 2-8 | 183.8 | 7.4E-2 | CO Fourth Positive (– ) | |||
| 3-0 | 135.4 | 2.2E-1 | 0-1 | 159.7 | 2 | |
| 3-1 | 139.8 | 1.4E-2 | 1-4 | 172.9 | 1.42 | |
| 3-2 | 144.4 | 5.5E-2 | 2-2 | 157.6 | 1.1 | |
| 3-3 | 149.3 | 6.3E-2 | 3-0 | 144.7 | 2.5 | |
| 3-5 | 160.0 | 7.1E-2 | 4-0 | 141.9 | 0.83 | |
| 3-6 | 165.8 | 4.3E-2 | 5-0 | 139.2 | 0.79 | |
| 3-8 | 178.5 | 4.4E-2 | 5-1 | 143.5 | 1.36 | |
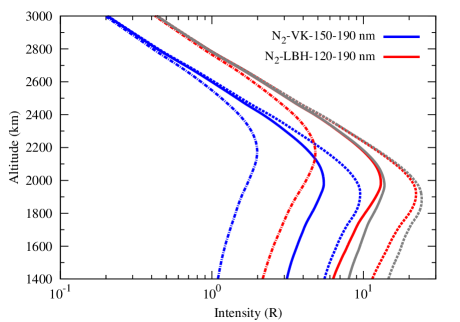
Figure 3 shows the limb intensity of N2 VK (150–190 nm) and LBH (120–190 nm) bands predicted for NH flyby condition. Calculated limb intensities of VK and LBH bands peak at the radial distance of 2000 km with values of 5 and 10 R, respectively. For SZA = 0∘, the calculated intensity increases by a factor of 2 and the altitude of peak emission decreases by about 75 km and peaks at about 1920 km.
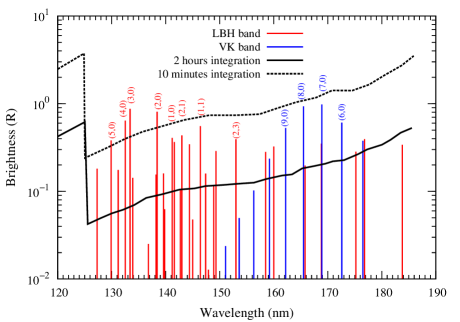
For P-ALICE to observe the LBH and VK bands in the dayglow of Pluto, it is very essential that emission intensities must be higher than the sensitivity of the instrument, and also for a given observation, the signal to noise ratio (SNR) should be high enough to detect any meaningful data. In Figure 4, we present the predicted limb intensities of prominent transitions of LBH and VK, and CO fourth positive bands at 2000 km, along with expected P-ALICE SNR 10 for 10-minutes and 2-hours integrations (taken from Figure 1 of Stern et al., 2008). The overhead intensities of LBH and VK, and CO Fourth positive bands are also shown in Figure 4, which shows that overhead intensity of CO fourth positive is higher than both LBH and VK bands. The sensitivity analysis given by Stern et al. (2008) is not related to viewing geometry and their estimated brightness features are for unresolved disk and limb. We found that for 2-hr integration, P-ALICE could detect a number of prominent transitions of LBH and VK bands, however for low integration (10-minutes) only a very few transitions are above SNR level of 10. This suggests that integration time for P-ALICE observations should be higher for it to detect bright emissions of LBH and VK bands.
4.3 Comparison with Titan’s emissions
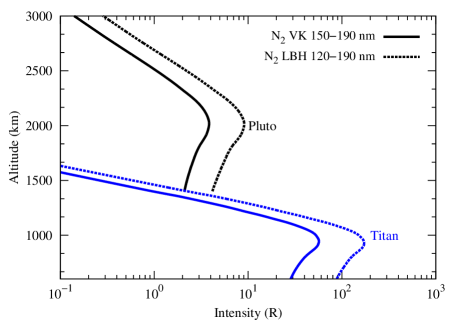
UVIS onboard Cassini spacecraft have observed VK and LBH bands emissions on Titan (Stevens et al., 2011). As mentioned earlier, we have developed model for emissions on Titan (Bhardwaj and Jain, 2012b). Figure 5 shows the calculated limb intensities of VK (150-190 nm) and LBH (120-190 nm) bands in the atmospheres of Titan and Pluto for solar minimum condition (F10.7=68) and SZA = 60∘. Figure 5 clearly depicts that emissions intensities on Titan is an order of magnitude higher than that on Pluto, reflecting closer proximity of Titan to Sun. The altitude of peak emissions on the Titan and Pluto differs by about 1000 km, which mostly due to the extended atmosphere of Pluto.
5 Conclusions
We present the calculation of N2 dayglow emissions in the atmosphere of Pluto. Our calculations predicted peak limb intensity of 5 (10) R for N2 VK 150–190 (LBH 120–190) nm for the NH flyby conditions. However, the predicted intensities depend upon various input model parameters and the observed intensities would depend on conditions at the time of measurements. Based on our current understanding of Pluto’s atmosphere for solar minimum and maximum conditions, variability for the peak limb intensity in the range 4 to 13.7 R (9 to 33 R) for N2 VK (LBH) band is expected. Our calculation shows that overhead intensity of CO 4P bands for NH flyby condition is higher than that of VK and LBH bands. We hope that the NH mission will significantly improve our understanding of Pluto’s atmosphere, and suggest conducting the limb observations of P-ALICE about 2000 km radial distance where airglow emissions peak and with enough integration time to detect prominent transitions of LBH and VK bands.
Acknowledgement
The work of SKJ was supported by DST INSPIRE Faculty program at SPL, VSSC, while work of AB was supported by ISRO.
References
- Ajello et al. (2008) Ajello, J. M., Gustin, J., Stewart, I., Larsen, K., Esposito, L., Pryor, W., McClintock, W., Stevens, M. H., Malone, C. P., Dziczek, D., 2008. Titan airglow spectra from the Cassini Ultraviolet Imaging Spectrograph: FUV disk analysis. Geophys. Res. Lett. 35, L06102. doi:\bibinfodoi10.1029/2007GL032315.
- Avakyan et al. (1998) Avakyan, S. V., II’in, R. N., Lavrov, V. M., Ogurtsov, G. N., 1998. In: Avakyan, S. V. (Ed.), Collision Processes and Excitation of UV Emission from Planetary Atmospheric Gases: A Handbook of Cross Sections. Gordon and Breach science publishers.
- Bhardwaj (2003) Bhardwaj, A., 2003. On the solar EUV deposition in the inner comae of comets with large gas production rates. Geophys. Res. Lett. 30 (24), 2244. doi:\bibinfodoi10.1029/2003GL018495.
- Bhardwaj et al. (1990) Bhardwaj, A., Haider, S. A., Singhal, R. P., 1990. Auroral and photoelectron fluxes in cometary ionospheres. Icarus 85, 216 – 228. doi:\bibinfodoi10.1016/0019-1035(90)90112-M.
- Bhardwaj et al. (1996) Bhardwaj, A., Haider, S. A., Singhal, R. P., 1996. Production and emissions of atomic carbon and oxygen in the inner coma of comet 1P/Halley: Role of electron impact. Icarus 120, 412 – 430. doi:\bibinfodoi10.1006/icar.1996.0061.
- Bhardwaj and Jain (2009) Bhardwaj, A., Jain, S. K., 2009. Monte Carlo model of electron energy degradation in a CO2 atmosphere. J. Geophys. Res. 114. doi:\bibinfodoi10.1029/2009JA014298.
- Bhardwaj and Jain (2012a) Bhardwaj, A., Jain, S. K., 2012a. Calculations of N2 triplet states vibrational populations and band emissions in venusian dayglow. Icarus 217, 752 – 758. doi:\bibinfodoi10.1016/j.icarus.2011.05.026.
- Bhardwaj and Jain (2012b) Bhardwaj, A., Jain, S. K., 2012b. Production of N2 Vegard-Kaplan and other triplet band emissions in the dayglow of Titan. Icarus 218 (2), 989 – 1005. doi:\bibinfodoi10.1016/j.icarus.2012.01.019.
- Bhardwaj and Michael (1999) Bhardwaj, A., Michael, M., 1999. On the excitation of Io’s atmosphere by the photoelectrons: Application of the analytical yield spectrum of SO2. Geophys. Res. Lett. 26, 393 – 396. doi:\bibinfodoi10.1029/1998GL900320.
- Eastes (2000) Eastes, R. W., 2000. Modeling the N2 Lyman-Birge-Hopfield band in the dayglow: Including radiative and collisional cascading between the singlet states. J. Geophys. Res. 105, 557 – 573. doi:\bibinfodoi10.1029/1999JA000378.
- Eastes et al. (2011) Eastes, R. W., Murray, D. J., Aksnes, A., Budzien, S. A., Daniell, R. E., Krywonos, A., 2011. Modeled and observed N2 Lyman-Birge-Hopfield band emissions: A comparison. J. Geophys. Res. 116. doi:\bibinfodoi10.1029/2010JA016417.
- Elliot et al. (2007) Elliot, J. L., Person, M. J., Gulbis, A. A. S., Souza, S. P., Adams, E. R., Babcock, B. A., Gangestad, J. W., Jaskot, A. E., Kramer, E. A., Pasachoff, J. M., Pike, R. E., Zuluaga, C. A., Bosh, A. S., Dieters, S. W., Francis, P. J., Giles, A. B., Greenhill, J. G., Lade, B., Lucas, R., Ramm, D. J., 2007. Changes in pluto’s atmosphere: 1988–2006. Astron. J. 134, 1 – 13.
- Gilmore et al. (1992) Gilmore, F. R., Laher, R. R., Espy, P. J., 1992. Franck-Condon factors, r-centroids, electronic transition moments, and Einstein coefficients for many nitrogen and oxygen band systems. J. Phys. Chem. Ref. Data 21, 1005 – 1107. doi:\bibinfodoi10.1063/1.555910.
- Guo and Farquhar (2005) Guo, Y., Farquhar, R. W., 2005. New Horizons Pluto-Kuiper Belt mission: Design and simulation of the Pluto-Charon encounter. Acta Astronautica 56, 421 – 429. doi:\bibinfodoi10.1016/j.actaastro.2004.05.076.
- Hathaway et al. (1994) Hathaway, D. H., Wilson, R. M., Reichmann, E. J., 1994. The shape of the sunspot cycle. Solar Phys. 151, 177 – 190.
- Jain and Bhardwaj (2011) Jain, S. K., Bhardwaj, A., 2011. Model calculation of N2 Vegard-Kaplan band emissions in Martian dayglow. J. Geophys. Res. 116. doi:\bibinfodoi10.1029/2010JE003778.
- Johnson et al. (2005) Johnson, P. V., Malone, C. P., Kanik, I., Tran, K., Khakoo, M. A., 2005. Integral cross sections for the direct excitation of the A, B, W, B, a, a, w, and C electronic states in N2 by electron impact. J. Geophys. Res. 110. doi:\bibinfodoi10.1029/2005JA011295.
- Krasnopolsky and Cruikshank (1999) Krasnopolsky, V. A., Cruikshank, D. P., 1999. Photochemistry of Pluto’s atmosphere and ionosphere near perihelion. J. Geophys. Res. 104 (E9), 979 – 996.
- Lean et al. (2011) Lean, J. L., Woods, T. N., Eparvier, F. G., Meier, R. R., Strickland, D. J., Correira, J. T., Evans, J. S., 2011. Solar extreme ultraviolet irradiance: Present, past, and future. J. Geophys. Res. 116. doi:\bibinfodoi10.1029/2010JA015901.
- Schindhelm et al. (2014) Schindhelm, E., Stern, S. A., Gladstone, R., Zangari, A., 2014. Pluto and charon’s uv spectra from iue to new horizons. Icarus, In Press.
- Stern et al. (2008) Stern, S. A., Slater, D. C., Scherrer, J., Stone, J., Dirks, G., Versteeg, M., Davis, M., Gladstone, G. R., Parker, J. W., Young, L. A., Siegmund, O. H. W., 2008. ALICE: The Ultraviolet Imaging Spectrograph aboard the New Horizons Pluto-Kuiper Belt Mission. Space Sci. Rev. 140, 155 – 187. doi:\bibinfodoi10.1007/s11214-008-9407-3.
- Stevens et al. (2011) Stevens, M. H., Gustin, J., Ajello, J. M., Evans, J. S., Meier, R. R., Kochenash, A. J., Stephan, A. W., Stewart, A. I. F., Esposito, L. W., McClintock, W. E., Holsclaw, G., Bradley, E. T., Lewis, B. R., Heays, A. N., 2011. The production of Titan’s ultraviolet nitrogen airglow. J. Geophys. Res. 116. doi:\bibinfodoi10.1029/2010JA016284.
- Strobel (2008) Strobel, D. F., 2008. N2 escape rates from Pluto’s atmosphere. Icarus 193, 612 – 619. doi:\bibinfodoi10.1016/j.icarus.2007.08.021.
- Summers et al. (1997) Summers, M. E., Strobel, D. F., Gladstone, G. R., 1997. Chemical Models of Pluto’s Atmosphere. In: Stern, S. A., Tholen, D. J. (Eds.), Pluto and Charon. Arizona press, p. 391.
- Tozzi et al. (1998) Tozzi, G. P., Feldman, P. D., Festou, M. C., Feb. 1998. Origin and production of C(^1D) atoms in cometary comae. Astrophys. J. 330, 753–763.
- Woods et al. (2005) Woods, T. N., Eparvier, F. G., Bailey, S. M., Chamberlin, P. C., Lean, J., Rottman, G. J., Solomon, S. C., Tobiska, W. K., Woodraska, D. L., 2005. Solar EUV Experiment (SEE): Mission overview and first results. J. Geophys. Res. 110, A01312. doi:\bibinfodoi10.1029/2004JA010765.
- Young et al. (2008) Young, E. F., French, R. G., Young, L. A., Ruhland, C. R., Buie, M. W., Olkin, C. B., Regester, J., Shoemaker, K., Blow, G., Broughton, J., Christie, G., Gault, D., Lade, B., Natusch, T., 2008. Vertical structure in pluto’s atmosphere from the 2006 June 12 stellar occultation. Astron. J. 136, 1757 – 1769. doi:\bibinfodoi10.1088/0004-6256/136/5/1757.
- Young et al. (2010) Young, J. A., Malone, C. P., Johnson, P. V., Ajello, J. M., Liu, X., Kanik, I., 2010. Lyman–Birge–Hopfield emissions from electron-impact excited N2. J. Phys. B: At. Mol. Opt. Phys. 43. doi:\bibinfodoi10.1088/0953-4075/43/13/135201.
- Zalucha and Gulbis (2012) Zalucha, A. M., Gulbis, A. A. S., 2012. Comparison of a simple 2D Pluto general circulation model with stellar occultation light curves and implications for atmospheric circulation. J. Geophys. Res. 117. doi:\bibinfodoi10.1029/2011JE003957.