Mid-Infrared Variations of R Coronae Borealis Stars
Abstract
Mid-infrared photometry of R Coronae Borealis stars obtained from various satellites from IRAS to WISE has been utilized in studying the variations of the circumstellar dust’s contributions to the spectral energy distribution of these stars. The variation of the fractional coverage (R) of dust clouds and their blackbody temperatures (Td) have been used in trying to understand the dust cloud evolution over the three decades spanned by the satellite observations. In particular, it is shown that a prediction R developed in the paper is satisfied, especially by those stars for which a single collection of clouds dominates the IR fluxes.
keywords:
Star: individual: R CrB: variables: circumstellar matter :other1 Introduction
R Coronae Borealis stars (here, RCBs) are a rare class of peculiar variable stars. Currently known stars number about 68 in the Galaxy, 19 in Large Magellanic Cloud and three in the Small Magellanic Cloud (Clayton 2012). Two principal defining characteristics of RCBs are (i) a propensity to fade at unpredictable times by up to about 8 magnitudes as a result of clouds of soot intercepting the line of sight to the star, and (ii) a supergiant-like atmosphere that is very H-deficient and He and C-rich.
RCB stars manufacture and disperse soot from a formation site near the star (Loreta 1934, O’Keefe 1939). The soot particles absorb star light and reemit the energy in the infrared (e.g., Feast et al. 1997) . Often, soot particles are sufficiently close to the star that they achieve an equilibrium temperature of several hundred degrees and so emit in the mid-infrared bands. Such emission is measured with difficulty from the ground. Fortunately, several Earth-orbiting satellites built for infrared photometric surveys have now reported measurements on RCBs. Available data are too sparse and inhomogeneous to define the variation of RCB dust emission on a daily, monthly or even annual timescale but mean properties of the infrared emission should be extractable to enable searches for correlations between dust shell properties derived from the infrared emission and other RCB properties such as chemical compositions.
The Infrared Astronomical Satellite, IRAS provided the first systematic photometry of these stars (Walker 1986; Rao & Nandy 1986) to complement limited ground-based photometry carried out earlier (e.g., Feast & Glass 1973; Kilkenny & Whittet 1984). IRAS confirmed not only that warm (300–900K) dust was common around RCBs but also showed the presence of cold (i.e., distant from the star) dust for strong infrared emitting stars (Rao & Nandy 1986). IRAS was followed by the Infrared Space Observatory, ISO. Although ISO provided higher spectral resolution mid-infrared spectroscopy and SEDs, it observed only a few bright RCBs (Lambert et al. 2001). Clayton et al. (2011) recently discovered using the Herschel satellite that the cold dust shell around R CrB radiates up to at least a wavelength of 1000 m.
Major progress in infrared photometry of RCBs could occur only after the launch of Spitzer satellite which provided high-quality low-resolution 8-40 m spectra using IRS for a major sample of RCBs (García-Hernández et al. 2011, here Paper I). Spitzer spectra were combined with optical and near-infrared photometry at maximum light corrected for interstellar reddening to define a star’s spectral energy distribution (SED) from which characteristics of the infrared emitting dust shell were extracted (García-Hernández et al. 2011, 2013). Recently, it was realised that mid-infrared band colours could distinguish RCB stars from other types of variable stars rather uniquely (Tisserand 2012; Miller et al. 2013; Tisserand et al. 2013).
Following Spitzer, the satellites AKARI and WISE have provided photometric surveys from which observations of RCBs may be extracted. The AKARI infrared camera surveyed the sky at 9 and 18m between 2006 May 6 and 2007 August 28 (Ishihara et al. 2010). A few RCBs were also detected by AKARI at 65, 90 and 160 m. WISE’s survey was conducted at 3.0, 4.6, 12 and 22 m in 2010 (Wright et al. 2010). Tisserand (2012) used the available AKARI, WISE and other photometry to investigate the infrared colours and the spectral energy distributions from the optical to the mid-infrared and to characterize the circumstellar dust emission from a large sample of RCBs.
Here, we assemble and discuss the SEDs of our Spitzer sample and their dust emission as measured in the mid-infrared by the series of satellites from IRAS to AKARI and WISE and by published ground-based photometry.
| Star | |||||||||||||
| IRASa | AKARI | Spitzer | WISE | ||||||||||
| 1983 | 2006 | 2010.5 | |||||||||||
| 12m | 25m | 9bm | 18m | 9m | 12m | 18m | 12m | 22m | |||||
| XX Cam | 0.23 | 0.14 | 1.390.06 | 1.210.02 | 0.610.01 | ||||||||
| SU Tau | 9.500.76 | 4.140.29 | 14.720.50 | 6.160.05 | 7.520.08 | 4.880.06 | 7.120.07 | 3.350.04 | |||||
| UX Ant | 0.100.01 | 0.080.00 | 0.040.00 | ||||||||||
| UW Cen | 7.810.47 | 5.570.33 | 9.760.07 | 5.700.05 | 9.78 | 7.660.07 | 5.29 | 7.360.05 | 4.670.05 | ||||
| Y Mus | 0.830.07 | 0.290.03 | 0.230.02 | 0.18 | 0.180.01 | 0.140.01 | 0.130.00 | 0.120.00 | |||||
| DY Cen | 1.050.06 | 0.840.07 | 0.540.02 | 0.890.02 | 0.50 | 0.87c | 1.07 | 0.660.01 | 0.910.01 | ||||
| V854 Cen | 18.420.9 | 5.880.4 | 22.971.2 | 7.360.03 | 16.36 | 11.590.03 | 6.790.0 | 17.780.2 | 5.830.04 | ||||
| Z UMi | 1.790.11 | 0.620.04 | 1.720.03 | 0.760.02 | 1.54 | 1.180.02 | 0.690.05 | 1.230.01 | 0.560.01 | ||||
| S Aps | 2.710.11 | 1.020.07 | 1.970.02 | 1.000.02 | 3.14 | 2.300.02 | 1.310.04 | 0.910.01 | 0.600.01 | ||||
| R CrB | 33.831.4 | 13.810.6 | 52.992.4 | 21.480.03 | 23.720.3 | 13.660.4 | 45.950.8 | 17.520.1 | |||||
| RT Nor | 0.850.09 | 0.390.04 | 0.260.04 | 0.230.02 | 0.15 | 0.180.00 | 0.200.00 | 2.010.02 | 0.770.01 | ||||
| RZ Nor | 3.080.09 | 1.770.09 | 3.120.26 | 1.700.08 | 3.63 | 2.930.01 | 2.010.01 | 2.050.03 | 1.260.02 | ||||
| V517 Oph | 6.00.36 | 1.900.19 | 6.760.24 | 4.860.06 | 2.750.06 | 4.470.04 | 1.860.02 | ||||||
| V2552 Oph | 0.360.00 | 0.160.00 | |||||||||||
| V532 Oph | 0.520.04 | 0.470.06 | 0.600.01 | 0.300.01 | |||||||||
| V1783 Sgr | 2.840.14 | 1.000.09 | 3.920.25 | 1.900.03 | 2.97 | 2.500.02 | 1.660.04 | 1.620.02 | 0.790.02 | ||||
| WX CrA | 1.890.09 | 0.610.05 | 1.740.10 | 0.810.00 | 0.89 | 0.730.02 | 0.530.03 | 0.900.01 | 0.410.01 | ||||
| V739 Sgr | 1.100.09 | 0.280.04 | 1.640.06 | 0.840.00 | 1.45 | 1.200.01 | 0.790.02 | 0.860.01 | 0.420.01 | ||||
| V3795Sgr | 3.420.27 | 1.360.20 | 4.570.14 | 1.950.07 | 3.31 | 2.630.05 | 1.570.04 | 1.700.02 | 0.930.01 | ||||
| VZ Sgr | 1.130.08 | 0.60 | 0.280.10 | 1.30 | 1.080.02 | 0.860.04 | 0.300.00 | 0.160.00 | |||||
| RS Tel | 1.310.08 | 0.570.05 | 1.870.10 | 0.770.01 | 1.82 | 1.330.00 | 0.900.00 | 0.960.01 | 0.510.01 | ||||
| MACHOd | 0.54 | 0.45 | 0.32 | 0.270.00 | 0.170.00 | ||||||||
| GU Sgr | 0.970.07 | 0.660.14 | 1.290.14 | 0.750.1 | 1.740.02 | 0.760.01 | |||||||
| NSV11154 | 0.410.02 | 0.170.02 | 0.630.01 | 0.300.03 | 0.240.00 | 0.150.00 | |||||||
| MV Sgr | 0.860.19 | 1.480.13 | 0.330.02 | 1.010.01 | 0.32 | 0.560.01 | 1.060.03 | 0.380.01 | 1.060.02 | ||||
| FH Sct | 0.540.05 | 0.400.05 | 1.400.03 | 0.660.05 | 1.02 | 0.920.01 | 0.680.02 | 1.060.01 | 0.520.01 | ||||
| V CrA | 4.950.20 | 2.000.14 | 3.610.21 | 2.170.01 | 3.32 | 3.020.00 | 2.400.01 | 3.460.03 | 1.960.02 | ||||
| SV Sge | 3.290.23 | 1.660.10 | 3.850.44 | 2.290.10 | 2.15 | 2.100.02 | 1.690.03 | 1.360.01 | 1.100.02 | ||||
| V1157 Sgr | 2.630.21 | 0.890.08 | 2.570.00 | 1.140.02 | 2.29 | 1.740.02 | 1.080.03 | 1.64 | 0.79 | ||||
| RY Sgr | 63.884.5 | 20.800.8 | 48.003.7 | 20.181.0 | 26.770.4 | 17.250.3 | 33.160.9 | 13.890.2 | |||||
| ES Aql | 1.180.09 | 0.390.07 | 1.940.13 | 0.880.04 | 1.77 | 1.340.01 | 0.870.02 | 1.340.02 | 0.610.01 | ||||
| V482 Cyg | 0.850.05 | 0.350.07 | 1.130.04 | 0.460.02 | 0.58 | 0.490.00 | 0.380.00 | 0.720.01 | 0.330.01 | ||||
| U Aqr | 1.120.09 | 1.260.14 | 0.750.00 | 0.89 | 0.860.01 | 0.820.02 | 0.520.01 | 0.370.01 | |||||
| UV Cas | 3.810.15 | 1.280.09 | 1.130.05 | 0.800.03 | 0.87 | 0.830.01 | 0.650.02 | 0.600.01 | 0.490.01 |
a: Color corrected. Mainly from Walker (1986).
b: Uncertainties are less than 0.01 Jy for all stars. c: Emission features exist at 12m and 18m in the Spitzer spectrum of DY Cen (García-Hernández et al. 2011, 2013). d: MACHO135.27132.51
2 Spectral Energy Distributions
In Paper I, Spitzer satellite spectra of RCBs in the wavelength range of 5 to 40 m were paired with visual to near-infrared photometry of the star to obtain a comprehensive SED of the star. Observed fluxes were corrected for interstellar reddening. For details, please see Paper I. Comparisons were made with IRAS 10 and 25 m fluxes and, where available with ground-based infrared photometry. Here, we complement these Spitzer and IRAS observations with AKARI (Ishihara et al. 2010) and WISE (Wright et al. 2010) satellite band fluxes (Table 1). WISE observations were done in four bands 3.0, 4.6, 12 and 22 microns whereas AKARI observations in the two bands at 9.0 and 18.0 microns have been used. The flux calibration adopted was from Wright et al. (2010) for WISE magnitudes and Ishihara et al. (2010) for AKARI. The epochs of these observations have been taken as 2006.0 and 2010.5 for AKARI and WISE, respectively. Epochs of the Spitzer observations are given in Paper I: a majority were taken in about mid-2008. To compare the flux densities of Spitzer spectra with the other satellites bands we choose the the same effective wavelengths of these bands 9, 12 , 18 m and obtained monochromatic flux densities from the IRS spectra . We made a linear fit to the data points of three wavelengths on either side of these chosen band wavelengths and obtained the flux density listed in Table 1 at these central wavelengths. These flux densities are not band averaged flux densities as given by other satellites. Flux density uncertainties were taken from the following sources: IRAS Point Source Catalogue 2.0 via SIMBAD; AKARI and WISE from http://irsa.ipac.caltech.edu/cbi-bin/Gator/nph-query; Spitzer from the noise in the observed spectra. For the Spitzer 9 m flux density, the uncertainties are less than 0.01 Jy for all stars and are not indicated in Table 1. WISE measurements at 3.0 and 4.6 microns are not tabulated but are shown in the appropriate figures which follow. Except for the IRAS photometry, the ground-based and AKARI and WISE photometry have not been colour corrected. Apart from the 12 m WISE band, the other bands are sufficiently narrow not to require a significant colour correction for these spectra which span a narrow (500 – 900 K) temperature range.
Earlier, Tisserand (2012) used WISE as well as AKARI magnitudes to construct SEDs of RCBs. The recent release of the WISE catalogue contains more and fainter RCBs than dealt with by him and the magnitudes also were revised (IPAC website http://irsa.ipac.caltech.edu/cbi-bin/Gator/nph-query). It was mentioned by Tisserand (2012) that 4.6 micron band WISE magnitudes less that 4.0 have saturation problems. Some of the bright RCBs like R CrB, RY Sgr etc. were too bright for accurate photometry. Table 1 gives the flux density measurements from the four satellites and, where available, ground-based mid-IR photometry. We make limited use of the WISE flux densities at 3.0 and 4.6 m. These quantities are not tabulated in Table 1 but are provided by Tisserand (2012).
We have used the methodology described in Paper I for constructing the SED of the star and its dusty circumstellar shell. Interstellar reddening estimates listed in Paper I have been applied before constructing the SEDs; this correction for reddening primarily affects the stellar component of the combined SED. Blackbody fits have been made to the combined SEDs with the temperature of the stellar blackbody taken from Paper I.
| Ground/Other | IRAS | AKARI | Spitzer | WISE | Mean R | ||||||||
|---|---|---|---|---|---|---|---|---|---|---|---|---|---|
| Star | 1983 | 2006 | 2010.5 | ||||||||||
| Epoch | R | Td | R | Td | R | Td | Epoch | R | Td | R | Td | Rav | |
| XX Cam | 0.01 | 500 | 0.02 | 550 | 0.01 | 650 | 0.010.01 | ||||||
| SU Tau | 0.46 | 600 | 0.99 | 850 | 2008.4 | 0.44 | 635 | 0.54 | 750 | 0.610.23 | |||
| UX Ant | 0.14 | 650 | 0.14 | 650 | 0.14 | ||||||||
| UW Cen | 1984e | 0.35 | 620 | 0.44 | 630 | 0.44 | 600 | 2008.7 | 0.44 | 636 | 0.44 | 650 | 0.380.10 |
| Y Mus | 1984b | 0.14 | 980 | 0.08 | 655 | 0.01 | 420 | 2008.4 | 0.01 | 395 | 0.01 | 340 | 0.060.06 |
| V854 Cen | 1996.8a | 0.94 | 1100 | 0.57 | 920 | 0.54 | 900 | 2007.8 | 0.30 | 900 | 0.54 | 880 | 0.580.22 |
| Z UMi | 0.95 | 850 | 0.79 | 900 | 2008.9 | 0.41 | 695 | 0.79 | 900 | 0.740.20 | |||
| S Aps | 0.42 | 750 | 0.22 | 710 | 2008.4 | 0.37 | 730 | 0.14 | 950 | 0.290.11 | |||
| R CrB | 1998.0g | 0.30 | 810 | 0.20 | 680 | 0.30 | 810 | 2004.6 | 0.30 | 950 | 0.30 | 810 | 0.280.04 |
| RT Nor | 1984b | 0.11 | 920 | 0.08 | 500 | 0.02 | 400 | 2005.4 | 0.01 | 365 | 0.46 | 850 | 0.140.17 |
| RZ Nor | 1983.4c | 0.72 | 720 | 0.72 | 720 | 0.54 | 650 | 2006.3 | 0.64 | 640 | 0.37 | 610 | 0.570.13 |
| V517 Oph | 0.98 | 850 | 0.92 | 885 | 2008.4 | 0.92 | 885 | 0.83 | 880 | 0.910.05 | |||
| V2552 Oph | 0.09 | 800 | 0.09 | ||||||||||
| V532 Ophf | 0.03 | 400 | 0.07 | 720 | 0.050.02 | ||||||||
| V1783 Sgr | 0.53 | 770 | 0.65 | 790 | 2008.4 | 0.27 | 554 | 0.24 | 670 | 0.420.17 | |||
| WX CrA | 0.46 | 670 | 0.39 | 740 | 2008.9 | 0.14 | 570 | 0.35 | 870 | 0.330.12 | |||
| V739 Sgr | 0.98 | 900 | 0.71 | 700 | 2008.4 | 0.57 | 656 | 0.68 | 850 | 0.740.15 | |||
| V3795Sgr | 0.50 | 700 | 0.36 | 650 | 2008.4 | 0.29 | 600 | 0.17 | 580 | 0.330.12 | |||
| VZ Sgr | 0.21 | 700 | 0.11 | 780 | 2008.4 | 0.21 | 692 | 0.07 | 770 | 0.150.06 | |||
| RS Tel | 1984b | 0.26 | 790 | 0.28 | 700 | 0.36 | 850 | 2005.78 | 0.33 | 830 | 0.15 | 650 | 0.280.07 |
| MACHO135.27132.51 | |||||||||||||
| GU Sgr | 1977.6d | 0.45 | 910 | 0.06 | 400 | 0.12 | 600 | 0.45 | 910 | 0.270.18 | |||
| NSV 11154 | 0.63 | 720 | 0.92 | 800 | 0.40 | 750 | 0.650.21 | ||||||
| FH Sct | 0.04 | 393 | 0.17 | 740 | 2008.5 | 0.10 | 537 | 0.25 | 940 | 0.140.09 | |||
| V CrA | 1984b | 0.69 | 640 | 0.87 | 670 | 0.45 | 580 | 2005.4 | 0.38 | 550 | 0.65 | 700 | 0.610.18 |
| SV Sge | 0.17 | 730 | 0.11 | 600 | 2008.5 | 0.05 | 500 | 0.03 | 500 | 0.090.05 | |||
| V1157 Sgr | 0.89 | 880 | 0.60 | 820 | 2008.5 | 0.44 | 753 | 0.34 | 680 | 0.570.21 | |||
| RY Sgr | 1997.3h | 0.38 | 820 | 0.76 | 870 | 0.38 | 820 | 2004.89 | 0.20 | 675 | 0.38 | 820 | 0.420.18 |
| ES Aql | 0.70 | 830 | 0.70 | 830 | 2008.5 | 0.58 | 750 | 0.70 | 830 | 0.670.06 | |||
| V482 Cyg | 0.09 | 650 | 0.14 | 850 | 2004.96 | 0.04 | 580 | 0.20 | 970 | 0.120.06 | |||
| U Aqr | 0.37 | 560 | 0.37 | 560 | 2008.6 | 0.25 | 473 | 0.24 | 680 | 0.310.06 | |||
| UV Cas | 0.26 | 830 | 0.03 | 507 | 2008.5 | 0.03 | 507 | 0.02 | 510 | 0.080.10 | |||
a V854 Cen was observed by ISO on 1996 September (Lambert et al. 2001). The R and Td values refer to ISO observations. The AKARI and WISE photometry needed a combination of two black bodies to match the SED.
b The ground based observations come from Kilkenny & Whittet (1984). Their observations were obtained mainly in April 1983 .
c The KW’s and IRAS observation together defined the SED from which R and Td has been estimated.
d The ground based observations are from Glass (1978).
e Goldsmith et al. (1987) also observed the star on 1985.5 from which R and Td of 0.16 and 540K have been derived. They have been included in the average.
f Both IRAS 12m and AKARI 18m fluxes together defined a black body SED for the R and Td estimate.
g R CrB was observed by ISO on 1998 January 15. The ISO SED could be fit by a combination of blackbodies 810 K, 750K and 550K. The flux densities from AKARI and WISE match very well the ISO spectrum. All three observations have same value of R .
g RY Sgr was observed by ISO on 1997 March 25. The ISO spectrum could be fit with a single black body of 870K. The flux densities obtained with AKARI and WISE match the ISO spectrum very well. All three observations result in same R.
The blackbody fits provide the dust temperature Td and the fraction of the stellar energy radiated by the cool circumstellar shell R where refers to the integrated flux density. In general, the dust component for RCBs can be well represented by a single blackbody. In a few cases. a second and cooler blackbody is added to provide an adequate fit to the IR fluxes. With a more detailed coverage of the near-IR energy distribution, it might be possible to include a blackbody to represent emission by warmer dust near the star. The WISE observations at 3.0 and 4.6 m and ground-based L and M photometry sample warmer dust, if present. Our focus here is on the dust emitting at mid-IR wavelengths.
3 Discussion - the puff model
3.1 The concept
Our discussion of SEDs is framed in terms of the random dust-puff model for dust formation and ejection. In this scenario (Feast 1979, 1986, 1996, 1997; Feast et al. 1997; Herbig 1949; Payne-Gaposchkin 1963; Clayton et al. 1992), dust is ejected from points on or near the RCB surface in the form of puffs or clouds which then are expelled away from the stellar surface. Only those puffs formed on or very close to the Earth-facing hemisphere of the RCB will result in the characteristic fading. All puffs but those eclipsed by the star will contribute to the infrared signal from the dust. In a given circumstellar envelope, there may be one, several or many puffs. Puffs may be created at preferred parts of the stellar surface or uniformly over the surface. The rate of creation of fresh puffs will likely vary from star to star. Those RCBs prone to frequent formation of puffs will be expected to have nearly time-independent values. The amplitude of IR variations will depend on several factors such as the number of puffs and their mean contribution to the mid-IR flux: a star with many weak puffs is likely to show smaller variations than a star with a few strong puffs. On the other hand, RCBs producing puffs infrequently are likely to have smaller mean values with larger variations resulting as a puff moves away from the star and subsequently a fresh puff is ejected. In this simple picture, puffs are formed and expand away from the star, i.e., there is no mechanism for storing dust (and gas) near the star as in a circumstellar disk. Chesneau et al. (2014) from interferometric observations of V854 Cen show that this star’s dust is concentrated in an elongated structure which, as the authors note, may reflect a bipolar wind off the star. Quasi-stable dusty disks have been found as circumbinary features for some binary stars. It has yet to be shown that V854 Cen is a binary star. Evidence for bipolar outflows have been presented earlier by Rao & Lambert (1993) for V854 Cen and Clayton et al. (1997) for R CrB.
Information about the formation and evolution of the circumstellar dust shell for RCBs is, thus, provided by the temporal evolution of the infrared flux in terms of its spectral distribution and intensity which here are crudely represented by the covering factor and the blackbody temperature . Unfortunately, available infrared measurements are extremely sparse because the observations are difficult to obtain; ground-based mid-IR photometry is a rarely practiced art and infrared-capable satellites are launched infrequently. An exceptional database is the SAAO series of JHKL photometry of bright southern RCBs (Feast et al. 1997). And, in particular, Bogdanov et al. (2010) mounted a beautiful long-term campaign of JHKLM observations of UV Cas.
3.2 Variability
Here, we compare mid-IR fluxes obtained with the satellites IRAS, AKARI, Spitzer and WISE. The epochs of these surveys are 1983 for IRAS, 2006 for AKARI, 2005-2008 for Spitzer and 2010 for WISE. Long-term – two decades approximately – variations are estimated from comparison between IRAS and the other three surveys. Shorter term – one to a few years – variations are estimated by comparisons among the fluxes from the three most recent satellites. Our present comparisons are an extension of the IRAS – Spitzer comparison discussed in Paper I where the Spitzer 12 and 25 m fluxes for a large RCB sample were compared with their IRAS counterparts obtained about 25 years previously.
IRAS and Spitzer 12m flux densities are compared in Figure 1. When a few outliers are excluded, the mean relation provides a good fit to the data points and this linear relation is shown in the figure. A systematic offset of 24 per cent between Spitzer and IRAS observations may be due to the broad-band nature of the IRAS photometry and an imperfect color correction. Given that there is a roughly 10 per cent uncertainty affecting IRAS photometry, it would appear that many RCBs had similar 12 m flux densities in 1983 and 2005-2008 but this is not to suggest that they did not vary in the nearly 30 year interval. Outliers include RY Sgr, V854 Cen, UV Cas, Y Mus, RT Nor and WX CrA with an exceptionally large ratio of IRAS to Spitzer fluxes and FH Sct with an apparently small ratio of IRAS to Spitzer fluxes. The three stars – UV Cas, Y Mus, and RT Nor – showed a factor of five greater IRAS 12 m flux than recorded by Spitzer. A striking and expected characteristic of the trio is that their covering factors R as obtained from Spitzer were very small (0.01 to 0.03) and among the lowest of the sample. For their IRAS fluxes, the R values were 0.07 – 0.28. In the puff model, the trio are most likely examples where very few puffs inhabit the circumstellar environment at any given time because ejection of fresh puffs is an infrequent event. Other outliers –RY Sgr, V854 Cen and WX CrA – show a less extreme difference between IRAS and Spitzer fluxes. This trio have larger R covering factors but would appear to be still affected by a change in the dust in their circumstellar shell. FH Sct , another low R star, is the only star in the sample which was fainter when observed by IRAS than by Spitzer.
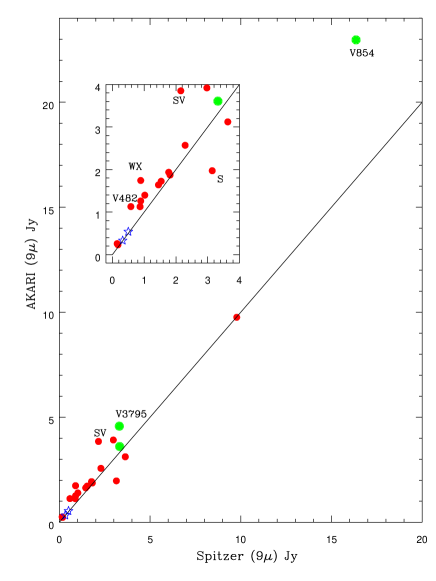
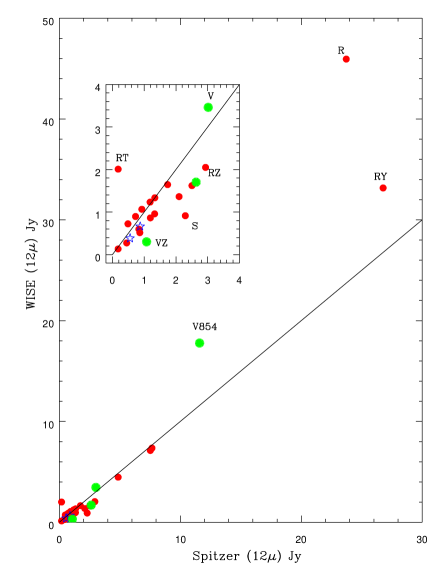
A comparison of Spitzer and AKARI flux densities at 9 m is shown in Figure 2 where the relation is plotted. Similarly, WISE and Spitzer 12 m fluxes are compared in Figure 3 where the line corresponds to . In both figures, a few outliers are marked. In Figure 3, RT Nor is the outstanding outlier with its WISE flux density raised by a fresh ejection of dust. V854 Cen is again brighter than expected from its Spitzer flux density and the mean for the sample. Two stars – VZ Sgr and S Aps – have faded noticeably between their observations by Spitzer and then by WISE. An overall impression from these comparisons is that the mid-IR fluxes of the majority of the sampled RCBs are not subject to major variations over the 1 to 25 year timeframe.
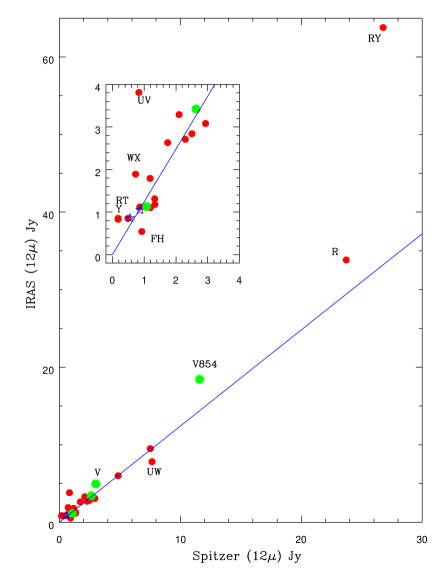
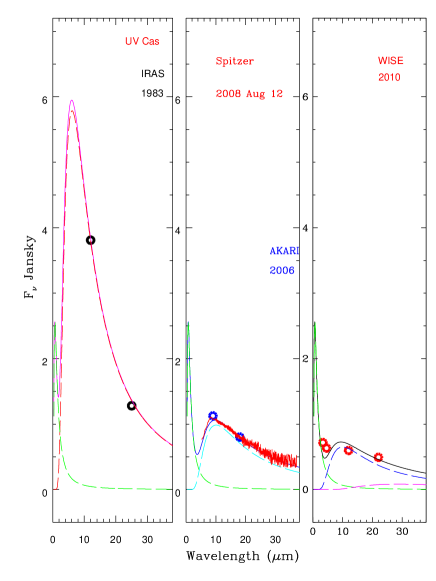
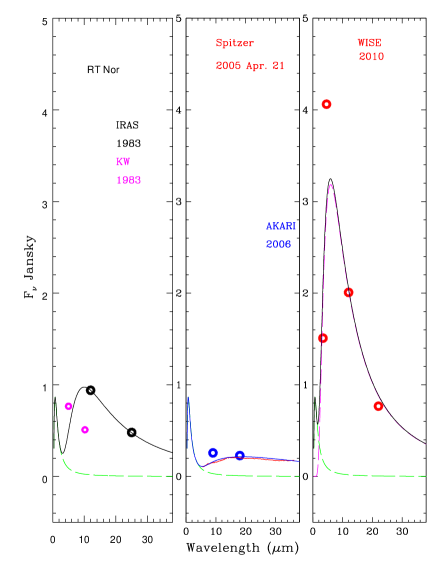
Qualitatively, the three extreme outliers in Figure 1 – UV Cas, Y Mus and RT Nor – with the small R-values from Spitzer may be identified as stars which at the time of the Spitzer observations had little warm dust – few dust puffs – in their circumstellar envelopes and, thus, large fractional changes in their mid-IR fluxes surely reflect fresh ejection of dust into the envelope and possibly a single ejection on or off the line of sight. We begin comparison of the SEDs constructed from IRAS, Spitzer and AKARI, and WISE observations with these three IRAS – Spitzer outliers – see Figure 4 for UV Cas , Figure 5 for Y Mus and Figure 6 for RT Nor.
For UV Cas, a valuable series of JHKLM photometry by Bogdanov et al. (2010) from 1984 (just following the IRAS observations) to 2009 (just following the Spitzer observations) suggests that a major episode of dust ejection occurred prior to the IRAS observations. This ejection did not cause a fading of the star. Following the ejection, UV Cas’s mid-IR flux decayed for about 2000 days with only two minor flux increases prior to 2009. Thus, the dust detected by AKARI, Spitzer and WISE was likely from the pre-IRAS ejection which had expanded away from the star in the intervening 25 years; the drop in dust temperature from 800 K to 510 K is consistent with this idea (Paper I). The dates of the AKARI and WISE observations generally bracket the Spitzer observations. Thus, it is not unexpected that for UV Cas that mid-IR fluxes from the three satellites are similar: Figure 4 shows that the AKARI and Spitzer fluxes are essentially identical but the WISE fluxes are lower suggesting that the expansion of the ‘1980’ dust ejection appears to have continued and may have accelerated. A more quantitative discussion of the series of flux density measurements is given below in Section 3.3. However, Clayton et al. (2013) suggest that there might be some evidence for hundreds of km/s dust motions in the star.
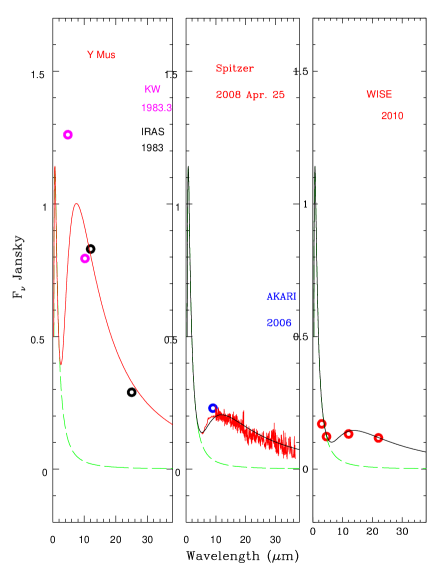
IRAS to WISE photometry shows that Y Mus behaved similarly to UV Cas (Figure 5): the IRAS fluxes and the N flux from Kilkenny & Whittet (1984) are much greater than the fluxes from AKARI, Spitzer and WISE. Kilkenny & Whittet’s M and N observations were made in 1983 April during the year-long IRAS mission. Thus, the agreement between their N flux and the IRAS 10 m flux is expected in the absence of rapid changes of the IR flux (see discussion of RT Nor below). Unfortunately, there is no long-term series of mid-IR photometry comparable to Bogdanov et al.’s (2010) observations of UV Cas but we presume that the dust detected by IRAS moved away from Y Mus and had cooled substantially when detected by the other satellites. AAVSO records show Y Mus has not experienced a fading over the duration of the records (i.e., since early 1982) but these records do not sense puffs ejected off the line of sight to the star.
In two respects, different circumstances are found for RT Nor (Figure 6). The AKARI and Spitzer mid-IR fluxes of RT Nor are in good agreement but the WISE fluxes are about an order of magnitude stronger and about twice the IRAS fluxes. The inference is that a fresh ejection of dust occurred after the 2005–2006 observations by Spitzer and AKARI and prior to the observation in 2010 by WISE. This sharp increase in mid-IR fluxes may be linked to a fading of the star: AAVSO records show that a minimum occurred between October 2008 when the star was at maximum and the next observation in mid-2009 when it was about five magnitudes below maximum, the first decline since 1990. A second aspect setting RT Nor apart from Y Mus is that Kilkenny & Whittet’s (1984) M flux is considerably less than the IRAS measurement even though the M measurement was made during the year-long IRAS mission. We conjecture that between the M and IRAS observations fresh dust was added to the circumstellar shell. The AAVSO observations show no dimming in this period so that dust replenishment must have occurred off the line of sight to the star. These few observations suggest that RT Nor is more active than either UV Cas or Y Mus.
Frequency of ejection of dust is likely related in some way to the occurrence of visual fadings characteristic of RCBs but, as the examples of UV Cas and Y Mus illustrate, not every ejection of dust results in a dimming of the star. Jurcsik (1996) estimated inter-fade intervals for RCBs from reported visual magnitudes. Her two longest intervals were for Y Mus (15300 days) and UV Cas (25500 days) with typical values of 1000-2000 days reported for many RCBs. Thus, the low R values, the large amplitude mid-IR flux variations, and the long inter-fade intervals are all consistent with the view that UV Cas and Y Mus are presently poor producers of dust. Jurscik’s inter-fade interval for RT Nor is listed as 1950 days. In Paper I, we noted that the last minimum of RT Nor occurred about 15 years before 2008 and intimated that this suggested that Jurcsik’s 1950 day estimate was an underestimate. However, recently two minima have been observed with onsets in about January 2009 and February 2013. One may conjecture, as noted above, that the January 2009 fading was responsible for the large increase in mid-IR flux between the AKARISpitzer and WISE observations.
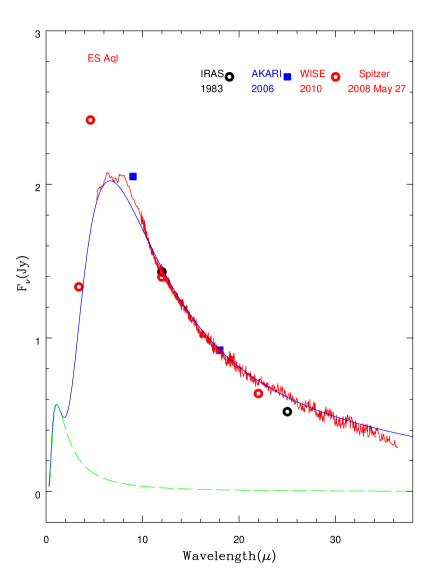
At the opposite end of the range of factors R to the above trio of outliers are RCBs with large R. Among this sample, there is a range of variation in the mid-IR fluxes from the four satellites. At one extreme is ES Aql (Figure 7) where the mid-IR fluxes are very similar from all four satellites. The mean R is 0.67 0.06. As noted in Paper I, the cool RCB ES Aql declines frequently with a major decline about every year. Unless these optical declines reflect a preferred plane for puff ejection, ES Aql’s circumstellar shell will be refreshed more frequently than once a year. Thus, ES Aql is likely an example where the shell hosts many puffs and conditions in the shell are essentially time invariant. A similar case may be the very active cool star V517 Oph which shows an average R of 0.91 0.05.
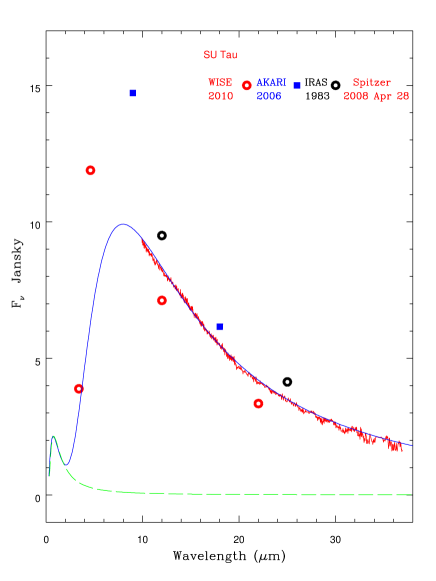
Other stars show modest variations in their mid-IR fluxes. One such example is SU Tau (Figure 8) where the shape of the mid-IR spectrum is very similar from epoch to epoch but the flux level varies by about 20-30%. SU Tau is a star which is frequently in decline: it ‘has been three or more magnitudes below maximum light for nearly half of the last 20 years’ (Paper I). With frequent known ejections of dust and quite possibly other ejections not causing fadings, it is not surprising that the shape of the mid-IR spectrum is almost invariant with modest changes in strength. In the language of the puff model, SU Tau may resemble ES Aql but have fewer puffs in its circumstellar shell such that a variation of one or two in the number of puffs emitting mid-IR radiation affects the total emitted flux.
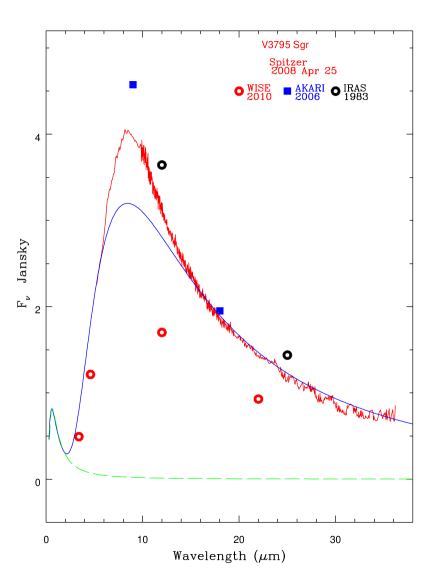
V3795 Sgr is a star for which IRAS, Spitzer and AKARI give very similar mid-IR fluxes but WISE found appreciably lower fluxes (Figure 9). V3795 Sgr, a minority RCB (Lambert & Rao 1994), has experienced just two declines in the last 20 years and during the period of the AKARI - WISE observations was in recovery from one of those declines. A speculation is that the high speed wind seen during a recovery was responsible for sweeping a lot of dust outwards and, thus, to cooler temperatures ( Rao et al. 1999; Clayton et al. 2013).
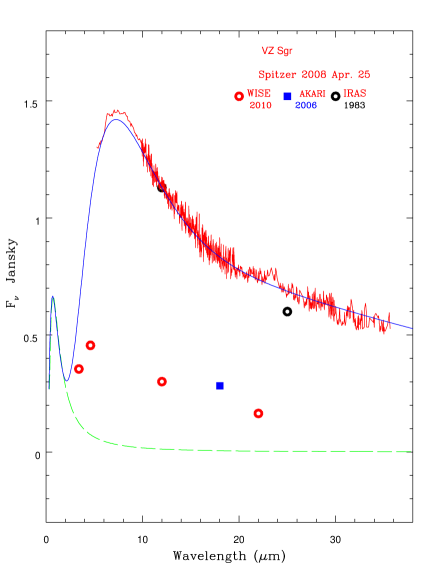
In the comparison with the Spitzer spectra obtained between the times of the AKARI and WISE observations, VZ Sgr (Figure 10), a minority RCB, stands out; both the AKARI and the WISE fluxes are about a factor of two to three less than the Spitzer and IRAS fluxes. At the time of the Spitzer observation and as noted in Paper I, VZ Sgr was in a deep minimum and several magnitudes below maximum light, but, at the time of the AKARI and WISE observations, the star was at maximum light. The high mid-IR flux seen by Spitzer is likely attributable to the fresh dust contributed by the on-going minimum but, in contrast to many other RCBs, the dust dispersed quickly; a high speed wind, as in V3795 Sgr, drove dust out to great distances?. One may conjecture that in cases such as V3795 Sgr and VZ Sgr puffs form and/or dissipate on timescales of a couple of years or less. This behaviour is in contrast to UV Cas, Y Mus and RT Nor where the timescale appears to be a couple of decades.
3.3 The run of R with
Simple implementations of the puff model suggest a correlation between the covering factor R and the blackbody dust temperature Td. The factor R is defined to be the ratio of integrated dust emission to the stellar flux: R = where corrections are applied for interstellar reddening. Consider the following scenario. Suppose that puffs occupy a volume at a distance from the central star and the dust in the puffs is at an equilibrium temperature Td. The thickness of a puff is assumed to be small relative to the radial distance . The integrated emission from the dust will be proportional to the product of and T. The dust temperature Td is taken to be the equilibrium temperature of a grey dust grain in an optically thin puff111 The ratio of absorption coefficients for carbonaceous grains at 5000Å to 20 m is about a factor of 50 (Colangeli et al. 1995) and, thus, all but the clouds causing the very deepest of declines will be optically thin at mid-IR wavelengths.,i.e., T (Kwok 2007, p.314, Equation 10.32). In this simple picture, the ratio of star’s integrated dust emission from a given set of puffs moving out from distance to is (T/T. Thus, if the puffs are optically thin at IR wavelengths and their dust content are not evolving, is expected to scale with T. Note that Td is determined from the wavelength-dependence of the IR emission and from the integrated IR emission and, thus, Td and are different measures of the IR emission.
For the sample of RCBs, one expects that for a given Td, there will be a spread in because the size and number of puffs and their distribution with radial distance will vary from star to star and time to time for a particular star. The temperature Td distance relation will depend also on the stellar temperature T⋆: T T⋆ – see Kwok above. Unfortunately, there is no observational way to determine the mean radial distance of the puffs at a given time or the distance travelled by puffs between two observations without assuming any expansion velocity for the dust. The covering factor involves the stellar flux which is set by the luminosity or the product .
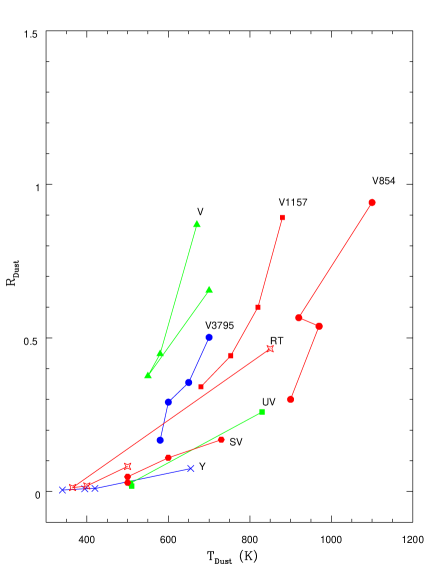
Observational pursuit of the above idea may be most instructive when applied to those stars in Table 2 for which R and Td both decrease with time. In such cases, the reasonable inference is that a set of puffs is expanding away from their formation site near the star and, thus, experiencing cooling as observations proceeded from IRAS to WISE. Six stars (Y Mus, UV Cas, V3795 Sgr, SV Sge, V1157 Sgr and RT Nor) meet our condition with an additional four satisfying the condition but for an increase in R and Td with the observation by WISE which we interpret as the signal of the formation of a new puff or cloud of puffs. In Figure 11, we show the R versus Td relations for seven of the ten stars and also for V854 Cen, a star with a near-constant R and Td. An evolutionary trend is indicated for each star. Note that for RT Nor and V CrA, the WISE result is disconnected from the indicated trend from earlier photometry because, we suppose, fresh puffs have appeared between the time of the Spitzer and WISE observations. Inspection of Figure 11 shows that the evolutionary trends comprise a very diverse set. This diversity is likely to reflect several factors including the variation from star to star of the dust content, the different stellar luminosities and temperatures across the sample. RCBs may evolve at approximately constant luminosity but with a finite luminosity range across the sample. Stellar temperatures (see Paper I) for the stars represented by Figure 11 run from 4200 K for V1157 Sgr and SV Sge to 8000 K for V3795 Sgr.
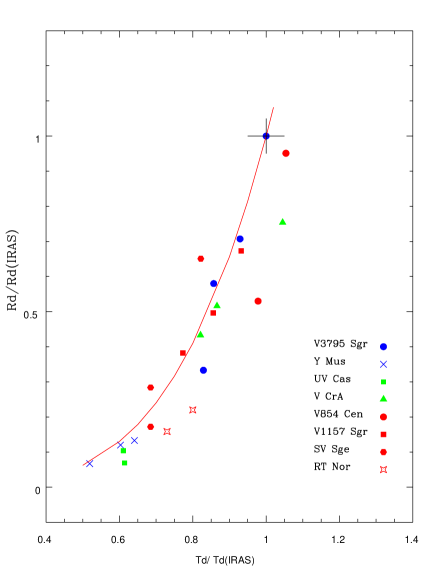
If the simple model leading to the prediction that T for a given star is applicable, the diversity exhibited in Figure 11 will be markedly reduced when data for the sample are displayed after scaling such that R/R is plotted versus , as in Figure 12. Moreover, the model predicts that the scaled R and Td should be related by . This prediction shown in Figure 12 is a fine fit to the observational results.
When the other RCBs are added to Figure 12, they generally confirm the predicted trend but with increased scatter which may be attributed to their cloud of puffs is changing over the time period covered by the observations. The fact that the majority of RCBs satisfy the predicted relation suggests that the evolution of puffs around follows a fairly common pattern. In three cases – RT Nor, GU Sgr and FH Sct – the R value and Td relative to their IRAS values exceed unity suggesting that puffs have formed close to the RCB star. These observations fall between the R vs T and T relations.
As pointed in Paper I, it is very puzzling that the IRAS flux densities (Table 1) and now the R values (Table 2) are almost without exception greater than all observations since 1983. The implication is that almost all RCBs were at their infrared brightest in 1983 when observed by IRAS. Two speculations of this surprising result suggest themselves in isolation or in cooperation: (i) there is a systematic difference between the determination of the parameters and from the IRAS 12 and 25 m flux densities and the three other satellites sources, and (ii) the dust shells (or, perhaps, the central stars) have evolved systematically over the thirty year interval since the IRAS observations. An explanation intrinsic to the RCBs is inconceivable. (point ii). It implies that the 1983 epoch was somehow a critical time of high and high for essentially each of the RCBs in our sample. This is most unlikely given that the RCB phase lasts several thousand years (Iben 1991).
3.4 Dust and Photospheric Composition
Photospheric composition should be one of the key variables influencing the formation of the carbon soot, a presumed principal component of a puff’s dust. Chemical compositions of warm RCBs come mainly from Asplund et al. (2000) with results for V854 Cen from Asplund et al. (1998), V532 Oph from Rao et al. (2014) and V2552 Oph from Rao & Lambert (2003). Two introductory points about these compositions. First, the analysis by Asplund et al. (2000) using modern H-poor He-rich model atmospheres (Asplund et al. 1997) revealed what was termed ‘the carbon problem’, i.e., the C abundance returned from the analysis of a spectrum was about 0.6 dex less than the C abundance adopted in the model atmosphere’s construction. This problem was discussed by Asplund et al. (2000) who suggested that an abundance ratio was most likely more reliable than the abundance of either element. Second, Lambert & Rao (1994) in their abundance analysis, a precursor of that reported by Asplund et al. (2000), noted that the warm RCBs could be divided by composition into a ‘majority’ and ‘minority’ group. The minority RCBs differed from the majority principally in having a lower Fe and higher Si abundance and, hence, an extraordinary Si/Fe ratio, a ratio far in excess of that seen in any other major class of star such as metal-poor halo stars. Table 1 includes the minority stars V854 Cen, V3795 Sgr, VZ Sgr and V CrA.
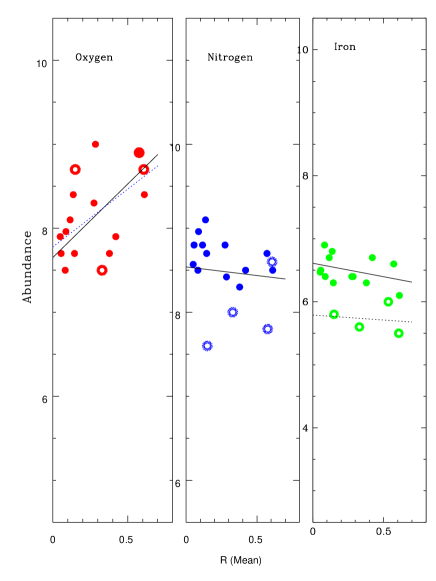
The mean R – the quantity Rav from Table 2 – is taken as a RCB’s propensity to shed puffs. The C abundances – see above remarks on the carbon problem – span a small range including both majority and minority RCBs and are uncorrelated with the mean R. The O abundances exhibit a range of about 1.5 dex. There appears to be a positive correlation between the O abundance and the mean (Figure 13) with barely a separation between majority and minority RCBs. The N abundances of majority RCB show a weak anti-correlation with the mean with three of the four minority RCBs having a far lower N abundance (Figure 13). Similarly, the Fe abundances of the majority are weakly anti-correlated with the mean with, of course, the Fe abundances of minority RCBs falling below those of the majority RCBs. A least squares solution of all the stars (both majority and minority) for O abundance with respect to the mean R suggests a slope of 1.24 and a correlation coefficient of 0.52 which would increase to 1.33 and a correlation coefficient of 0.70 if two outliers are dropped. For the N abundance with respect to the mean R, the slope is -0.5 with a correlation coefficient of -0.3 . For Fe abundance the majority RCBs suggest a slope of -0.4 with a correlation coefficient of -0.37. For minority RCBs the Fe abundances give the slope is -0.15 with a correlation coefficient of -0.14.
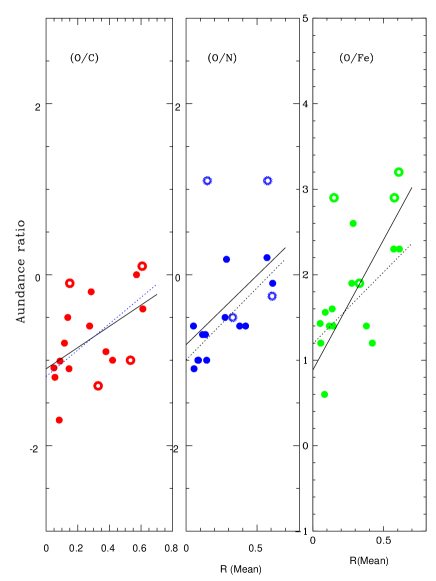
Correlations between abundance ratios and the mean R have also been looked for. Using the spectroscopic C abundance, the O/C ratio also shows a weak correlation with mean without a distinction between majority and minority RCBs. A least-squares solution of the majority RCBs shows a slope of 1.54 and a correlation coefficient of 0.65. The slope becomes 1.24 and correlation coefficient of 0.5 when majority and minority RCBs are considered together. The O/N and O/Fe ratios (Figure 14) show a rough tendency to increase with increasing mean with two of the four minority. RCBs falling amongst the majority RCBs; the exceptions among minority RCBs are VZ Sgr and V854 Cen with O/N and O/Fe ratios greater than those held by any majority RCB. The least-squares solution for O/N shows a slope of 1.7 and correlation coefficient of 0.77 for majority and 0.55 for combined sample with the same slope. The O/Fe also suggests a slope of 1.67 and a correlation coefficient of 0.60 for majority and combined sample has a slope of 2.17 . All three abundance ratios O/C, O/N,and O/Fe seem to show a positive slope with respect mean R.
Thus, it is possible that O abundance might have an influence in dust production in these stars. Woitke et al.’s (1996) models for dust formation in RCBs suggest that the CO molecule is the most dominant cooling agent which determines whether the gas can reach condensation temperatures or not after passage of a pulsation shock. As long as the C abundance exceeds the O abundance, the CO abundance is likely to be influenced by the O abundance. It is not quite clear how the CO abundance in these stars is controlled by oxygen abundance.
3.5 Dust and Luminosity
Is dust formation related to a star’s luminosity? In the absence of traditional (i.e., trigonometric) methods of estimating luminosity, we rely on the pulsation-period relation for RCBs. Pulsation is also of direct interest to the puzzle of dust formation in that a link, first suggested by Pugach (1977) and confirmed by Crause et al. (2007) ties onset of dust formation to a preferred phase in a RCBs radial pulsation. However, copious dust formation appears not to occur at every passage through the preferred phase. Also, it is unclear how dust formation is physically related to this phase. Although Woitke et al. (1996) developed a model for a shock-induced dust formation in a pulsating RCB, many details are still to be worked out, particularly in applying it to specific stars (however see Rao & Lambert 2010).
On the theoretical front, radial pulsations obey the relation where P is the period, the density and is a constant. Following Fadeyev (1996), P in days can be written as follows
| (1) |
where and are luminosity and mass, respectively.
| Star | Period | R(mean) | Period Ref. | Comment | |
|---|---|---|---|---|---|
| K | days | ||||
| UW Cen | 7500 | 42.79 | 0.38 | Crause et al (2007) | |
| Y Mus | 7250 | 35.0 | 0.06 | Marang et al (1990) | |
| XX Cam | 7250 | 36 | 0.01 | Weiss et al (1996) | |
| RY Sgr | 7250 | 37.79 | 0.42 | Crause et al (2007) | |
| UV Cas | 7250 | 40.16 | 0.08 | Weiss et al (1996) | |
| RT Nor | 7000 | 43 | 0.14 | Lawson et al (1990) | |
| VZ Sgr | 7000 | 40a | 0.15 | Lawson & Cottrell (1997) | |
| UX Ant | 7000 | 50 | 0.14 | Lawson et al (1994) | |
| RS Tel | 6750 | 45.8 | 0.28 | Lawson et al (1990) | |
| RZ Nor | 6750 | 42.4b | 0.57 | Lawson et al (1990) | |
| R CrB | 6750 | 42.7c | 0.28 | Rao et al (1999) | |
| V854 Cen | 6750 | 43.25 | 0.58 | Crause et al (2007) | |
| V532 Oph | 6750 | 50 | 0.05 | Clayton et al (2009) | |
| SU Tau | 6500 | 45.07 | 0.61 | Weiss et al (1996) | |
| V CrA | 6500 | 57.1 | 0.61 | Lawson et al (1990) | |
| FH Sct | 6250 | 41 | 0.14 | this paper | |
| U Aqr | 5000 | 81.3 | 0.31 | Lawson et al (1990) | |
| Z UMi | 5200 | 130 | 0.74 | Benson et al (1994) | |
| S Aps | 4200 | 120d | 0.29 | Kilkenny & Flanagan (1983) | |
| NSV11154 | 4200 | 114f | 0.65 | unpublished | |
| FQ Aqr | 8750 | 18 | Kilkenny et al (1999) | coolEHe | |
| LSIV-14 109 | 9500 | 25 | Lawson et al (1993) | coolEHe | |
| NO Ser | 11750 | 22 | Kilkenny et al (1999) | coolEHe | |
| V2244 Oph | 12750 | 10 | Lawson et al (1993) | coolEHe | |
| HD175893 | 5500 | 41.0 | 0.026 | Lawson et al (1990) | HdC |
| HD137613 | 5400e | 20 | Kilkenny et al (1988) | HdC | |
| HD148839 | 6500 | 20 | Kilkenny et al (1988) | HdC | |
| HD182040 | 5600 | 40 | Kilkenny et al (1988) | HdC | |
| HD173409 | 6100 | 20 | Kilkenny et al (1988) | HdC |
a - 47days according to Bateson (1978)
b - 68 days?
c - Photometric period changes 43-53 days according to Fernie & Lawson (1993), Lawson & Kilkenny (1997) and Percy et al (2005). We use the period determined from radial velocities obtained over several decades (Rao et al. 1999) .
d - see the discussion in Lawson et al (1990).The period changes occur. The period quoted here might be a fundamental mode as detected by Waters (1966) and Kilkenny & Flanagan (1983).
e - Kipper (2002) gives of 6000 K and log g of 1.3 for HD137613 (= HM Lib).
f - Period is variable. The mean period may be 114 days.
1414,1 98
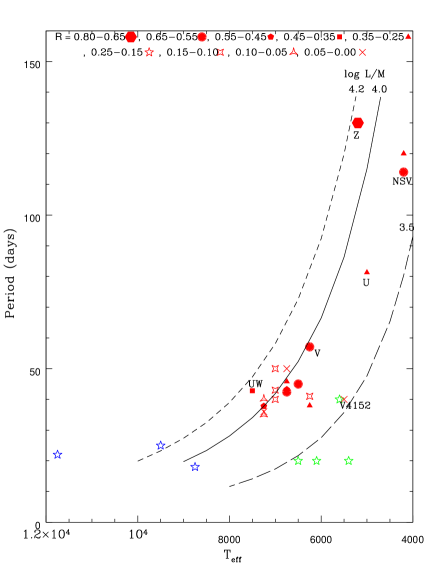
Pulsation periods for many RCBs have been estimated from optical photometry with measurements available in the literature for the majority of stars in Table 1 (see Table 3 and Lawson & Kilkenny 1996). Photometric amplitudes are small in most cases: less than several hundredths of a magnitude except for RY Sgr and a few others. Amplitudes may be variable and may vary too. With few exceptions, the period is in the range 30 – 50 days. Exceptions include U Aqr with days (Lawson et al. 1990), = 114 days for NSV 11154 (our unpublished estimate), =120 days for S Aps (Kilkenny & Flanagan 1983) and =130 days for Z UMi (Benson et al. 1994). Periods shorter than 30 days are found among the extreme hellum stars, the hydrogen-deficient carbon stars and the hot RCBs. The plane is shown in Figure 15. This plot is similar to Lawson et al.’s (1990) figure 32. Effective temperatures for most RCBs are spectroscopic values from Asplund et al. (2000). However for the cooler RCBs, except for Z UMi, no spectroscopic s are available and estimates are based on SED fits and photometry. Using Fadeyev’s formula, we find most of the RCB stars are distributed around the locus for M of 0.7 with the HdC stars located around .
Within the large sample with between 30 and 50 days, there is no correlation between the mean and or . Outside this period range, there are too few RCBs to search for connections with the mean . However as seen from Table 2, generally cooler RCBs (presumably with longer periods) have larger mean values. At periods shorter than about 20 days, dust formation either does not occur or is an infrequent occurrence. As noted above, the stars in this category are the EHes warmer than RCBs, the HdC stars at the cool end and the hot RCBs at the hot end of the range for RCBs. Only one HdC star that showed mild infrared excess, V4512 Sgr, is marked in Figure 15.
Better estimates of both periods as well as the mode of pulsation, particularly for cool RCBs, are required for a proper assessment of the pulsation- dust connection.
3.6 Dust Mass
It might be relevant to estimate the mass of dust that is hanging around these stars. The basic relation is
| (2) |
where is the dust mass, is the excess flux over the stellar flux, is the absorption coefficient of the grain in cm2gm-1, D is the distance to the object and is the Plank function .
This quantity also depends on the estimate of the distance to the object. We use the vs (V-I) colour established for LMC RCBs by Tisserand et al. (2009). As typical for F type stars UV Cas and Y Mus , we assume the to be -5 and estimate the distance. Also assuming the dust to be amorphous carbon of BE type (Colangeli et al. 1995) we estimate the dust mass at the time of IRAS observations as 2.9 x 10⁻⁹ m for both UV Cas and Y Mus. A similar estimate for cool RCB Z UMi is obtained, by assuming of -3.5 as consistent with the observed V-I colour, as 4.8 x 10⁻⁹ m at the time of IRAS observations.
Clayton et al. (2011) imaged R CrB and its environment during the prolonged deep minimum that started in 2007. They discovered several cometary knots around the star which are interpreted as past ejected dust puffs from the star. As they state ‘The puffs cause declines when they form directly in our line of sight and may be seen as cometary knots when they form to the side of or behind R CrB’. It is interesting to note that the dust mass estimated for these knots of 10-8 m to 10-9 m is about equal to dust mass estimated above for UV Cas, Y Mus and Z UMi from midIR excess at any given instant. It is of interest to note that Clayton et al. (2011) estimate total dust mass of 10-2 m for the R CrB shell including the cold dust from their observations into far infrared with Herschel.
4 Concluding remarks
Variations in the mid-IR flux densities measured by the different satellites reflect changes in the circumstellar shell’s mid-IR emission. Plots comparing flux densities from the four IR satellites are provided in Figures 1, 2 and 3. It is of interest to tease from such comparisons the intrinsic changes in mid-IR emission. Identification of intrinsic changes is certainly secure for the extreme outliers in the figures – most notably, UV Cas (Figure 4), S Aps (Figure 5) and RT Nor (Figure 6). These must arise from the varying contribution of puffs in the circumstellar shell; the scale of these variations far exceeds the measurement uncertainties. As discussed above, UV Cas’s high IRAS flux densities arise from puffs emitted somewhat prior to the IRAS observation and, as these puffs evolved away from the star and cooled, lower flux densities were measured by the later satellites and in the ground-based important series of measurements by Bogdanov et al. (2010). Somewhat similarly, RT Nor owes its position as an outlier to the appearance of fresh puffs between the Spitzer and WISE observations and some fraction of these puffs caused the deep optical decline recorded by AAVSO observers.
Extreme outliers are valuable because they provide a measure of the contribution to the mid-IR emission from an individual puff or a collection of associated puffs; RT Nor experiences a 0.4 increase in between the Spitzer and WISE observations. Other RCBs with a circumstellar shell occupied by several to many puffs will experience smaller variations in their mid-IR emission. One might suppose that variations will decrease in size as the number of puffs increases.
Stars where the mid-IR emission appears to be dominated by the slow evolution of the circumstellar dust offer the opportunity to test theoretical ideas. In particular, movement of a given family of puffs away from the star is predicted to lead to the relation R. As shown in Section 3.3 and, in particular by Figure 12, this prediction is well verified by stars where the mid-IR emission is thought to come from a single collection of puffs. In other cases, the observations scatter about the predicted relation in a plausible fashion.
Puff creation aside, evolution of the mid-IR emission from existing puffs is anticipated to be a slow process, as revealed by the case of UV Cas. Equilibrium temperatures of a gray grain (see Paper I and above) about a typical RCB are predicted to run from about 1300K at 10 stellar radii to 500K at 50 stellar radii to 250K at 200 stellar radii. If the dust grains are repelled from the star at about 10 km s-1, their path from their formation at (say) 10 stellar radii to about 200 stellar radii will take about 40 years. Thus, over the duration spanned by AKARI, Spitzer and WISE, the mid-IR emission from a given set of puffs will evolve very little, except for the formation of fresh puffs. Optical depth effects at visible and infrared wavelengths may complicate this simple expectation. Extending the time span to include IRAS should reveal a steady evolution, as indeed is shown in Figure 12. Toward the end of a deep decline, a high-velocity wind is seen as a blue-shifted absorption component to the Na D and other strong resonance lines: radial velocities attain about 200 km s-1 (Rao et al. 1999). This wind’s origin is unknown but, if it can sweep outward gas and dust ahead to it, it offers an explanation for some examples (e.g., V3795 Sgr) of evolution of mid-IR emission much more rapid than observed for UV Cas and similar cases. Of course, this high-speed wind can affect the mid-IR emission along any radius vector where puffs have accumulated. Evolutionary timescales for RCBs are several hundreds of years at least. One may suppose that a RCB’s propensity to form and eject dusty puffs evolves during this time. Some interesting insight that emerged from these midIR studies of RCBs are that the oxygen abundance has some influence on the dust production. It also appears that cool RCBs have more dust around them and higher luminosity at a given mass helps in dust production. Studies of pulsations, particularly in cool RCBs, would be a great help in future understanding of dust production in these stars.
Observational insights into the formation and evolution of dust around RCB stars are limited by the paucity of measurement at IR wavelengths. Campaigns extending Bogdanov et al.’s (2010) close scrutiny of UV Cas to other RCBs are to be encouraged. Such a campaign should extend to long wavelengths the valuable two decade long programme of JHKL photometry of a dozen southern RCBs by Feast et al. (1997; see also Feast 1997). Although, as shown here, the four IR satellites from IRAS to WISE have provided valuable insights into the evolution of circumstellar dust for a major sample of RCBs, it is most unlikely that a satellite will ever provide a thorough collection of IR photometry of these rare and fascinating stars.
5 Acknowledgements
We appreciate various comments made by the referee Geoff Clayton which improved the paper a great deal. We thank Anibal García-Hernández for his assistance with the preparation and analysis of the observations of RCBs with the Spitzer satellite. We acknowledge with thanks the variable star observations from the AAVSO database. This research has made use of the SIMBAD database, operated at CDS, Strasbourg, France. This research has been supported in part by the grant F-634 from the Robert A. Welch Foundation of Houston, Texas.
References
- [1] Asplund, M., Gustafsson, B., Kiselman, D., Eriksson, K. 1997, A&A, 323 , 286
- [2] Asplund, M., Gustafsson, B., Rao, N. K., Lambert, D.L. 1998, A&A, 332, 651
- [3] Asplund, M., Gustafsson, B., Lambert, D.L., Rao, N.L. 2000, A&A, 353, 287
- [4] Bateson, F.M. 1978, Publ. Var. Star Sec. R. Astr. Soc. New Zealand, 6, 39
- [5] Benson, P.J., Clayton, G.C., Garnavich, P., Szkody, P. 1994, AJ.,108, 247
- [6] Bogdanov, M.B., Taranova, O.G., Shenavrin, V.I. 2010, Astr. Rep., 54, 62 0
- [7] Chesneau, O., Millour, F., De Marco, O., Bright, S.N., Spang, A., Lagadec, E., Mékarnia, D., de Wit, W. J. 2014, A& A, 569, L4
- [8] Clayton, G.C., 2012, JAAVSO, 40, 539
- [9] Clayton, G.C., Geballe, T.R., Zhang, W., 2013, AJ, 146, 23
- [10] Clayton, G.C., Bjorkman, K.S., Nordsieck, K.H., Zellner, N.E.B., Schulte-Ladbeck, R.E., 1997, ApJ, 476, 870
- [11] Clayton, G.C.,Whitney, B.A., Stanford, S.A., Drilling, J.S., 1992, ApJ, 397, 652
- [12] Clayton, G.C., Kilkenny, D., Wils, P., Welch, D.L., 2009, PASP, 121, 461
- [13] Clayton, G.C et al., 2011, ApJ, 743, 44
- [14] Colangeli, L., Mennella, V., Palumbo, P., Rotundi, A., Bussoletti, E., 1995, A& AS, 113, 561
- [15] Crause, L.A., Lawson, W.A., Henden, A.A., 2007, MNRAS, 375, 301,
- [16] Fadeyev, Yu. A., 1996, in: Hydrogen deficient stars, Jeffery C.S., Heber U. (eds.). ASP conf. series vol. 96, p. 375
- [17] Feast, M.W., 1979, in: Changing Trends in Variable star research, Bateson, F.M, Smak, J., Urch, I.M. (eds.), Univ. of Waikato, Hamilton, N.Z., IAU. Coll. 46, p 246
- [18] Feast, M.W., 1986, in: Hydrogen deficient stars and Related Objects, Hunger, K., Schönberner,D., Kameswara Rao, N (eds.). Reidel, Dordrecht) p 151
- [19] Feast, M.W., 1996, in: Hydrogen deficient stars, Jeffery C.S., Heber U. (eds.). ASP conf. series vol. 96, p. 3
- [20] Feast, M.W., 1997, MNRAS, 285, 339
- [21] Feast, M.W., Glass,I., 1973, MNRAS, 161, 293
- [22] Feast, M.W., Carter, B.S., Roberts, G., Marang, F., Catchpole, R.M. 1997, MNRAS, 285, 317
- [23] Fernie, J.D., Lawson, W.A., 1993, MNRAS, 265, 899
- [24] García-Hernández, D.A., Kameswara Rao, N.,Lambert, D.L., 2011, ApJ, 739, 37 (paper I)
- [25] García-Hernández, D.A., Kameswara Rao, N.,Lambert, D.L., 2013, ApJ, 773, 107 (paper II)
- [26] Glass, I.S., 1978, MNRAS, 185, 23
- [27] Goldsmith, M.J., Evans, A., Albinson, J.S., Bode, M.F., 1990, MNRAS, 245, 119
- [28] Herbig, G.H., 1949, ApJ, 110, 143
- [29] Iben, I., Jr. 1991, ApJS, 76, 55
- [30] Ishihara, D. et al. 2010., A& A, 514, 1
- [31] Jurcsik, J., 1996, AcA, 46, 325
- [32] Kilkenny, D., Flanagan, C ., 1983, MNRAS, 203, 19
- [33] Kilkenny, D., Whittet, D.C.B., 1984, MNRAS, 208, 25
- [34] Kilkenny, D., Marang, F., Menzies, J.W., 1988, MNRAS, 233, 209
- [35] Kilkenny, D., et al., 1999, MNRAS, 305, 103
- [36] Kipper, T., 2002, Bal.Astr., 11, 249
- [37] Kwok. S. 2007, Physics and Chemistry of the Insterstellar Medium, (Sausalito: Univ. ScienceBooks)
- [38] Lambert, D. L., Rao, N. K., 1994, JAA, 15, 47
- [39] Lambert, D.L., Rao., N.K., Pandey., G., Ivans, I., 2001, Ap.J., 555, 925
- [40] Lawson, W. A., Cottrell, P.L. 1997, MNRAS, 285, 266
- [41] Lawson, W. A., Cottrell, P. L., Kilmartin, P.M., Gilmore, A.C., 1990, MNRAS, 247, 91
- [42] Lawson, W. A., et al., 1993, MNRAS, 265, 351
- [43] Lawson, W. A., Cottrell, P. L., Clark, M., 1991, MNRAS, 251, 687
- [44] Lawson, W.A., Kilkenny, D., 1996, in: Hydrogen deficient stars, Jeffery C.S., Heber U. (eds.). ASP conf. series vol. 96, p. 349
- [45] Lawson, W. A., et. al., 1994, MNRAS, 271, 919
- [46] Loreta, E., 1934, AN., 254, 151
- [47] Marang, F., Kilkenny, D., Menzies, J.W., Jones, J.H. Spencer., 1990, SAAOC, 14, 1
- [48] Miller et al. 2012, ApJ, 755, 98
- [49] O’Keefe, J.A., 1939, ApJ, 90, 294
- [50] Payne-Gaposchkin, C., 1963, ApJ, 138, 320
- [51] Percy, J.R., Bandara, K., Cottrell, P. L., Skuljan, L. 2004, JAVSO, 33, 27
- [52] Pugach, 1977, IBVS 1277
- [53] Rao, N.K., Nandy, K., 1986, MNRAS, 222, 357;
- [54] Rao, N.K., Lambert D.L., 1993, AJ, 105, 1915
- [55] Rao, N.K., Lambert D.L., 2003, PASP, 115, 1304
- [56] Rao, N.K., Lambert D.L., 2010, in: Recent Advances in Spectroscopy, Chaudhuri, R.K., Mekkaden, M.V., Raveendran, A.V., Narayanan, A.S. (eds). ASSP:Springer, p 177
- [57] Rao, N.K., Lambert D.L., Adams, M.T., Doss, D.R., Gonzalez, G., Hatzes, A.P., James, R., Johns-Krull, C.M., Luck, R.E., Pandey, G., Reinsch, K., Tomkin, J., Woolf, V.M. 1999, MNRAS, 310, 717
- [58] Rao, N.K., Lambert, D.L., Woolf, V., Hema, B.P., 2014, PASP, 126, 813
- [59] Tisserand, P., 2012, A&A , 539, 51
- [60] Tisserand, P., et al., 2009, A& A, 501, 985
- [61] Tisserand, P., et al., 2011, A& A, 529, 118
- [62] Tisserand, P., et al., 2013, A& A, 551, 77
- [63] Walker,H., 1986, in: Hydrogen deficient stars and Related Objects, Hunger, K., Schonberner,D., Kameswara Rao, N (eds.). Reidel, Dordrecht, p 407
- [64] Waters, B.H.J., 1966, R. astr. soc. N. Zealand Circulars, 119
- [65] Weiss, A., Fried, R., Olson, E.C., 1996, A& AS, 116, 31
- [66] Woitke, P., Goeres, A., Sedlmayr, E., 1996, A& A, 313, 217
- [67] Wright, E.L., et al., 2010, A.J., 140, 1868