Temperature controlled motion of an antiferromagnet-ferromagnet interface within a dopant-graded FeRh epilayer
Abstract
Chemically ordered B2 FeRh exhibits a remarkable antiferromagnetic-ferromagnetic phase transition that is first order. It thus shows phase coexistence, usually by proceeding though nucleation at random defect sites followed by propagation of phase boundary domain walls. The transition occurs at a temperature that can be varied by doping other metals onto the Rh site. We have taken advantage of this to yield control over the transition process by preparing an epilayer with oppositely directed doping gradients of Pd and Ir throughout its height, yielding a gradual transition that occurs between 350 K and 500 K. As the sample is heated, a horizontal antiferromagnetic-ferromagnetic phase boundary domain wall moves gradually up through the layer, its position controlled by the temperature. This mobile magnetic domain wall affects the magnetisation and resistivity of the layer in a way that can be controlled, and hence exploited, for novel device applications.
The chemically ordered alloy FeRh has the B2 structure and has long been known to undergo a magnetostructural phase transition from an antiferromagnetic (AF) to a ferromagnetic (FM) state at a transition temperature K.Fallot (1938); Kouvel and Hartelius (1962) Studies of bulk samples have revealed that the transition is accompanied by an isotropic 1% volume expansion,de Bergevin and Muldawer (1961); Zakharov et al. (1964) a significant reduction in resistivity,Kouvel and Hartelius (1962) and a substantial release of entropy.Annaorazov et al. (1996) The metamagnetic transition temperature is highly sensitive to the composition in FexRh1-xShirane et al. (1963); van Driel et al. (1999) and to chemical doping.Walter (1964); Schinkel, Hartog, and Hochstenbach (1974); Barua, Jiménez-Villacorta, and Lewis (2013) decreases with increased applied magnetic fieldBaranov and Barabanova (1995) and increases with the application of pressure.Kamenev et al. (1997) Thin film samples of FeRh also undergo such a transition,Lommel and Kouvel (1967); Ohtani and Hatakeyama (1993); van Driel et al. (1999); Maat, Thiele, and Fullerton (2005); Stamm et al. (2008); Sharma et al. (2011); de Vries et al. (2013); Bordel et al. (2012) and are of interest since they may find technological application in the fields of heat-assisted magnetic recording mediaThiele, Maat, and Fullerton (2003) or resistive memory cells.Marti et al. (2014) Thus, the study of such films is a very active area of research at present, with the aim of developing films suitable for specific applications by growing epitaxially on a variety of substrates and in heterostructures.Maat, Thiele, and Fullerton (2005); Ding et al. (2008); Fan et al. (2010); Loving et al. (2012); Baldasseroni et al. (2014); Suzuki, Itoh, and Taniyama (2014); Cherifi et al. (2014)
The magnetostructural phase transition is well-known to be of first order in this material, and as a result shows hysteresis and phase coexistence. The coexistence of the two phases has been inferred from transport measurements,Sharma et al. (2011) x-ray diffraction experiments,Kim et al. (2009); Loving et al. (2013); Mariager et al. (2012); de Vries et al. (2014) x-ray magnetic circular dichroism spectroscopy,Radu et al. (2010) and directly imaged using photoemission electron microscopy.Baldasseroni et al. (2012); Mariager et al. (2013); Kinane et al. (2014); Baldasseroni et al. (2014); Cherifi et al. (2014) The co-existing phases are separated by phase-boundary domain walls. In a nominally homogeneous sample these domain walls form around randomly nucleated regions of the different phases. Nevertheless, the very different physical properties of the two different phases suggest that bringing the creation and motion of these phase boundary domain walls under control could be exploited in novel nanomagnetic or spintronic devices. Here we show how a single phase boundary domain wall (DW) may be nucleated and moved in a controllable manner by preparing a film with a vertical gradient of chemical doping density.
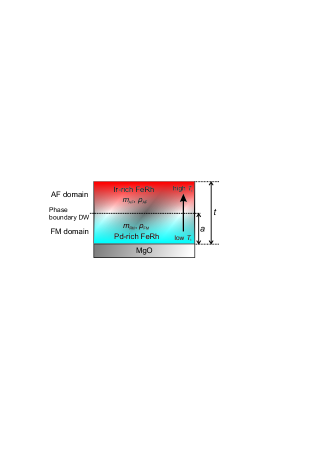
It is well known that doping onto the Rh site can produce large changes in , related to the modification of the density of () valence electrons (see Ref. Barua, Jiménez-Villacorta, and Lewis, 2013 and references therein). Here we select two dopants that are well-known to modify in opposite directions: Pd, which suppresses ,Kushwaha et al. (2009) and Ir which enhances it.Yuasa et al. (1994) The sample design is such that the layer is Pd-rich at the bottom and Ir-rich at the top, and thus has a gradient of throughout its height. At intermediate temperatures the sample will phase separate into two slabs of different magnetic order, AF or FM. We define the co-ordinate normal to the sample plane as . The sample is of thickness and the phase boundary domain will be at a height , such that for the material is anticipated to be FM and for AF. As is varied, the phase boundary domain wall can be expected to move up and down, tracking the gradient in . The concept is illustrated in Fig. 1.
The growth of our doping gradient film was based on the recipe presented in Ref. Le Graët et al., 2013, the main features of which are that the layer is sputtered onto an MgO single crystal substrate held at high temperature (in this case 600 ∘C) at a low rate (of order 0.1 Å/s) from an alloy target using conventional dc magnetron deposition. In this case a co-sputtering method was used, with targets containing a 3 per cent doping of Pd and 4 per cent doping of Ir by atomic number. Thin (sub-nm) layers, deposited sequentially from these two targets, were interleaved to form the desired doping profile. The high substrate temperature means that the dopants can be expected to diffuse, forming a smooth density gradient. The nominal total thickness was 500 Å. A thin ( Å) Al cap was deposited before breaking vacuum once the sample had cooled.
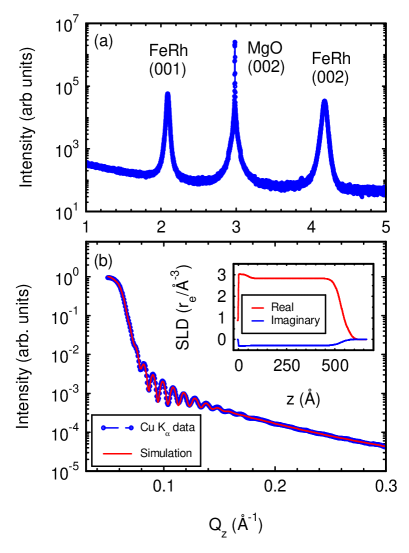
The sample was characterized using x-ray diffraction and reflectometry in a conventional Bragg-Brentano geometry using Cu radiation. The x-ray diffraction results are shown in Fig. 2(a), plotted against the out-of-plane component of the wavevector transfer, . It is clear that the layer has grown epitaxially on the MgO substrate. An analysis of the relative integrated intensities of the and Bragg reflections for the FeRhWarren (1969); Le Graët et al. (2013) indicates that the degree of chemical order of the B2 structure is for this sample. The x-ray reflectometry spectrum is shown in Fig. 2(b). Clear Kiessig fringes can be seen, and the reflectivity persists to large values of indicating a flat, smooth film. The data were fitted using the GenX code,Björck and Andersson (2007) returning a total FeRh alloy layer thickness of Å.111The full set of fitting parameters are available in the Supplementary Material, available at [insert URL] The scattering length density (SLD) depth profile corresponding to the best fit model is displayed as an inset to Fig 2(b).
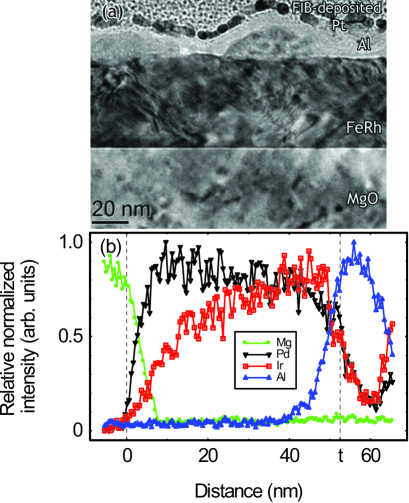
The sample was prepared into a cross-section using a focused ion beam method with a Ga ion source. A layer of Pt was deposited to protect the film from damage. Transmission electron microscope (TEM) characterization was performed using an FEI Tecnai TF20 operating at 200 kV. Fig. 3(a) shows a typical example of a bright field image of the FeRh film. The interface it makes with the MgO substrate is sharp while the surface of the FeRh is seen to be smooth as well, although the top surface of the Al cap is rather wavy. Scanning TEM-energy dispersive x-ray spectroscopy (STEM-EDX) line profiles measuring the relative intensity change of the doping elements and the adjacent layers through the height of the film are shown in Fig. 3(b) and confirm the presence of a gradient between Ir and Pd-rich within the FeRh. The Fe and Rh profiles are flat within this region (see Fig. S1 in the supplementary information). The TEM probe size was determined to be nm from the decay of intensity across the sharp MgO/FeRh interface.
The temperature dependence of the magnetization of the sample was measured using superconducting quantum interference device (SQUID) magnetometry. These data, measured at a field of 5 kOe, are shown in Fig. 4. (This field is enough to suppress the transition temperature by only about 4 K,Maat, Thiele, and Fullerton (2005) a negligible amount in the context of this experiment.) As expected, there is a broad transition that spans the range from K to K, typical transition temperatures for Pd and Ir doping respectively. The kink at about 440 K indicates a slight discontinuity in the doping gradient. There is some retained ferromagnetism at low temperatures, which we can associate with the top and bottom surfaces of the sample.Fan et al. (2010) This provides a magnetization in the nominally AF state e.m.u./cm3, which for simplicity we assume to be temperature-independent, represented by the long-dashed line in Fig. 4.
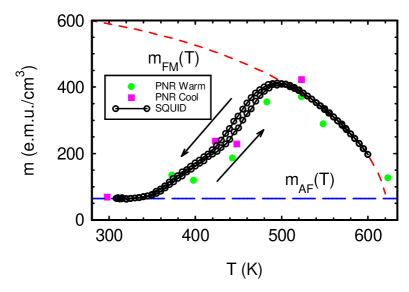
The magnetization in the FM phase ( K) was fitted with the phenomenological formulaAharoni (1981)
| (1) |
where and . The fit returned the values e.m.u./cm3, , , and K. This expression can then be extrapolated across the whole measurement temperature range, as shown by the short-dashed line in Fig. 4, to give an estimate of what the magnetisation would be at each temperature if the material did not undergo its phase transition. The actual data vary smoothly between these two limits as the gradual phase transition takes place, with modest hysteresis of up to about 10 K.
As well has having different magnetizations the two phases have very different resistivities,Kouvel and Hartelius (1962); de Vries et al. (2013) and so the phase separation can also be tracked using resistance measurements. The temperature dependence of the sample resistance , as measured by four point probe, and at zero field, is plotted in Fig. 5. The resistance is found to depend linearly on temperature deep in the AF and FM phases, and so it is straightforward to fit straight lines to these data and then extrapolate over the whole temperature range. The results of doing so are shown in Fig. 5, where in the AF phase the fit yields the long-dashed line described by the parameters m/K and , whilst in the FM phase the fit provides the short-dashed line given by m/K and . Again the actual data for vary smoothly between these two limits.
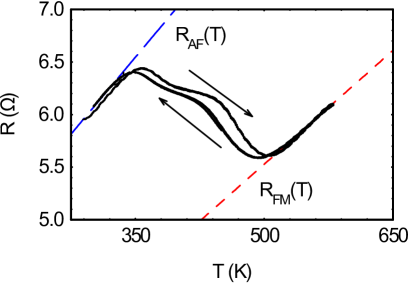
The position of the phase boundary DW separating the AF and FM regions can be inferred from these data. In order to do so from the data for , we assume that the material below the phase boundary DW is fully magnetised with and the material above that point has . Thus we may write
| (2) |
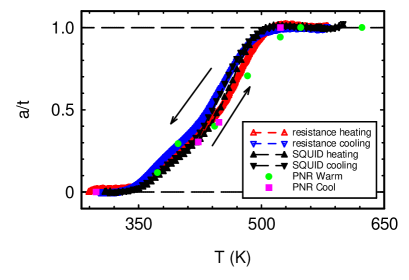
where is used as an offset. This yields the data for phase boundary DW position shown as solid triangles in Fig. 6.
Similarly, by assuming that the sample breaks into two slabs of differing resistivity that conduct the in-plane current in parallel, it is possible to estimate the wall position from the data for , using the expression
| (3) |
where is the resistance of the sample in the fully AF state and that in the fully FM state. The results of this procedure are also plotted in Fig. 6 using open triangles. There is a close agreement with the SQUID-derived data, particularly at higher temperatures.
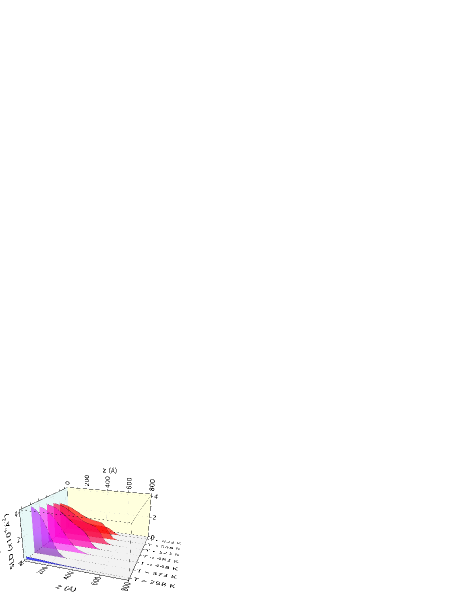
Nevertheless, the measurements of and average over the sample and lack spatial resolution. In order to check our assumption that the sample really has phase separated into discrete slabs, we performed polarized neutron reflectometry (PNR) at the PolRef instrument at ISIS. Data obtained from this technique can be fitted to determine the magnetic depth profile of a thin film or multilayer system.Marrows, Chapon, and Langridge (2009) Our sample was measured under an applied field of 8 kOe (expected to depress by only K) at a series of increasing temperatures.222The PNR spectra and the full set of fitting parameters are available in the Supplementary Material, available at [insert URL] These data were fitted with the Refl1D codeKienzle et al. , constraining the structural parameters to be those returned by the fit to the x-ray reflectometry, and the fitted magnetic SLD at each temperature during a warming cycle is shown in Fig. 7. We see that, as expected, the sample is essentially non-magnetic at the lowest measured temperature of 298 K (but for the small interface-induced magnetism close to the substrate that has been previously observedFan et al. (2010)), and that as the temperature is increased magnetization appears at the bottom substrate-epilayer interface and gradually spreads upwards through the film as is raised. The position of the wall obtained from the fits is plotted as solid circles for this warming process in Fig. 6. The match to the DW position inferred from the SQUID and resistance measurements is excellent. At the highest temperatures the layer starts to depolarize preferentially starting at the film-substrate interface and is consistent with the SQUID measurements. The fitted magnetic SLD can be integrated to return the average magnetization in the sample, which is plotted as solid circles in Fig. 4. Again, the PNR fits correspond closely to the magnetization measured by SQUID. Thus, the PNR experiments quantitatively confirm the picture of a phase boundary DW moving up through the layer during heating, controlled by the doping gradient.
AF/FM boundaries within a single material were studied by Saerback et al., where ordered and disordered phases of FePt3, which is AF when taking up the L structure, but ferromagnetic when antisite disorder is present.Saerbeck et al. (2010) Growing epilayers where the deposition temperature is modulated leads to a fully epitaxial structure with modulated antisite defect density and thus a stratification into AF and FM regions. However, the AF/FM domain walls in that case are tied to the boundaries between the layers of different degrees of chemical order, and are not mobile, as in the present case. This mobility could be exploited with more complex inhomogeneous doping profiles, perhaps in two or three dimensions, to yield fine control over the phase transition in terms of both the range of temperatures and distribution in space of the transforming regions. This could be taken advantage of in a wide range of nanomagnetic and–due to the coupling to the electrical resistivity–spintronic applications.
Acknowledgements.
This work was supported by a linked grant through the Materials World Network scheme by the National Science Foundation under Grant No. DMR-0908767 and the UK Engineering and Physical Sciences Research Council, Grant No. EP/G065640/1. Experiments at the ISIS Pulsed Neutron and Muon Source were supported by a beamtime allocation from the Science and Technology Facilities Council. We would like to thank D. Heiman for the use of the SQUID magnetometer.References
- Fallot (1938) M. Fallot, “Les alliages du fer avec les métaux de la famille du platine,” Ann. Phys. 10, 291 (1938).
- Kouvel and Hartelius (1962) J. S. Kouvel and C. C. Hartelius, “Anomalous magnetic moments and transformations in the ordered alloy FeRh,” J. Appl. Phys. 33, 1343 (1962).
- de Bergevin and Muldawer (1961) F. de Bergevin and L. Muldawer, “Crystallographic study of an iron-rhodium alloy,” Compt. Rend. Acad. Sci. 252, 1347 (1961).
- Zakharov et al. (1964) A. I. Zakharov, A. Kadomtseva, R. Levitin, and E. Ponyatovskii, “Magnetic and magnetoelastic properties of a metamagnetic Fe-Rh alloy,” J. Exp. Theor. Phys. (USSR) 46, 1348 (1964).
- Annaorazov et al. (1996) M. P. Annaorazov, S. A. Nikitin, A. L. Tyurin, K. A. Asatryan, and A. K. Dovletov, “Anomalously high entropy change in FeRh alloy,” J. Appl. Phys 79, 1689 (1996).
- Shirane et al. (1963) G. Shirane, C. W. Chen, P. A. Flinn, and R. Nathans, “Mössbauer study of hyperfine fields and isomer shifts in the Fe-Rh alloys,” Phys. Rev. 131, 183 (1963).
- van Driel et al. (1999) J. van Driel, R. Coehoorn, G. J. Strijkers, E. Bruck, and F. R. de Boer, “Compositional dependence of the giant magnetoresistance in FexRh1-x thin films,” J. Appl. Phys. 85, 1026 (1999).
- Walter (1964) P. H. L. Walter, “Exchange inversion in ternary modifications of iron rhodium,” J. Appl. Phys. 35, 938 (1964).
- Schinkel, Hartog, and Hochstenbach (1974) C. J. Schinkel, R. Hartog, and F. H. A. M. Hochstenbach, “On the magnetic and electrical properties of nearly equiatomic ordered FeRh alloys,” J. Phys. F Met. Phys. 4, 1412 (1974).
- Barua, Jiménez-Villacorta, and Lewis (2013) R. Barua, F. Jiménez-Villacorta, and L. H. Lewis, “Predicting magnetostructural trends in FeRh-based ternary systems,” Appl. Phys. Lett. 103, 102407 (2013).
- Baranov and Barabanova (1995) N. V. Baranov and E. A. Barabanova, “Electrical resistivity and magnetic phase transitions in modified FeRh compounds,” Journal of Alloys and Compounds 219, 139 (1995).
- Kamenev et al. (1997) K. Kamenev, Z. Arnold, J. Kamarad, and N. V. Baranov, “Pressure induced giant volume magnetostriction in the (Fe1-xNix)49Rh51 alloys,” J. Appl. Phys. 81, 5680 (1997).
- Lommel and Kouvel (1967) J. M. Lommel and J. S. Kouvel, “Effects of mechanical and thermal treatment on the structure and magnetic transitions in FeRh,” J. Appl. Phys. 38, 1263 (1967).
- Ohtani and Hatakeyama (1993) Y. Ohtani and I. Hatakeyama, “Antiferro-ferromagnetic transition and microstructural properties in a sputter deposited FeRh thin film system,” J. Appl. Phys. 74, 3328 (1993).
- Maat, Thiele, and Fullerton (2005) S. Maat, J.-U. Thiele, and E. E. Fullerton, “Temperature and field hysteresis of the antiferromagnetic-to-ferromagnetic phase transition in epitaxial FeRh films,” Phys. Rev. B 72, 214432 (2005).
- Stamm et al. (2008) C. Stamm, J.-U. Thiele, T. Kachel, I. Radu, P. Ramm, M. Kosuth, J. Minár, H. Ebert, H. A. Dürr, W. Eberhardt, and C. H. Back, “Antiferromagnetic-ferromagnetic phase transition in FeRh probed by x-ray magnetic circular dichroism,” Phys. Rev. B 77, 184401 (2008).
- Sharma et al. (2011) M. Sharma, H. M. Aarbogh, J. U. Thiele, S. Maat, E. E. Fullerton, and C. Leighton, “Magnetotransport properties of epitaxial MgO(001)/FeRh films across the antiferromagnet to ferromagnet transition,” J. Appl. Phys. 109, 083913 (2011).
- de Vries et al. (2013) M. A. de Vries, M. Loving, A. P. Mihai, L. H. Lewis, D. Heiman, and C. H. Marrows, “Hall effect characterisation of electronic transition behind the metamagnetic transition in FeRh,” New J. Phys. 15, 013008 (2013).
- Bordel et al. (2012) C. Bordel, J. Juraszek, D. W. Cooke, C. Baldasseroni, S. Mankovsky, J. Minár, H. Ebert, S. Moyerman, E. E. Fullerton, and F. Hellman, “Fe Spin Reorientation across the Metamagnetic Transition in Strained FeRh Thin Films,” Phys. Rev. Lett. 109, 117201 (2012).
- Thiele, Maat, and Fullerton (2003) J.-U. Thiele, S. Maat, and E. E. Fullerton, “FeRh/FePt exchange spring films for thermally assisted magnetic recording media,” Appl. Phys. Lett. 82, 2859 (2003).
- Marti et al. (2014) X. Marti, I. Fina, C. Frontera, J. Liu, P. Wadley, Q. He, R. J. Paull, J. D. Clarkson, J. Kudrnovský, I. Turek, J. Kuneš, D. Yi, J.-H. Chu, C. T. Nelson, L. You, E. Arenholz, S. Salahuddin, J. Fontcuberta, T. Jungwirth, and R. Ramesh, “Room-temperature antiferromagnetic memory resistor,” Nat. Mater. 13, 367 (2014).
- Ding et al. (2008) Y. Ding, D. A. Arena, J. Dvorak, M. Ali, C. J. Kinane, C. H. Marrows, B. J. Hickey, and L. H. Lewis, “Bulk and near-surface magnetic properties of FeRh thin films,” J. Appl. Phys. 103, 07B515 (2008).
- Fan et al. (2010) R. Fan, C. J. Kinane, T. R. Charlton, R. Dorner, M. Ali, M. A. de Vries, R. Brydson, C. H. Marrows, B. J. Hickey, D. A. Arena, B. K. Tanner, G. Nisbet, and S. Langridge, “Ferromagnetism at the interfaces of antiferromagnetic FeRh epilayers,” Phys. Rev. B 82, 184418 (2010).
- Loving et al. (2012) M. Loving, M. A. de Vries, F. Jimenez-Villacorta, C. Le Graët, X. Liu, R. Fan, S. Langridge, D. Heiman, C. H. Marrows, and L. H. Lewis, “Tailoring the FeRh magnetostructural response with Au diffusion,” J. Appl. Phys. 112, 043512 (2012).
- Baldasseroni et al. (2014) C. Baldasseroni, G. K. Pálsson, C. Bordel, S. Valencia, A. A. Unal, F. Kronast, S. Nemsak, C. S. Fadley, J. A. Borchers, B. B. Maranville, and F. Hellman, “Effect of capping material on interfacial ferromagnetism in FeRh thin films,” J. Appl. Phys. 115, 043919 (2014).
- Suzuki, Itoh, and Taniyama (2014) I. Suzuki, M. Itoh, and T. Taniyama, “Elastically concontrol magnetic phase transition in Ga-FeRh/BaTiO3(001) heterostructure,” Appl. Phys. Lett. 104, 022401 (2014).
- Cherifi et al. (2014) R. O. Cherifi, V. Ivanovskaya, L. C. Phillips, A. Zobelli, I. C. Infante, E. Jacquet, V. Garcia, S. Fusil, P. R. Briddon, N. Guiblin, A. Mougin, A. A. Ünal, F. Kronast, S. Valencia, B. Dkhil, A. Barthélémy, and M. Bibes, “Electric-field control of magnetic order above room temperature,” Nat. Mater. 13, 345 (2014).
- Kim et al. (2009) J. W. Kim, P. J. Ryan, Y. Ding, L. H. Lewis, M. Ali, C. J. Kinane, B. J. Hickey, C. H. Marrows, and D. A. Arena, “Surface influenced magnetostructural transition in FeRh films,” Appl. Phys. Lett. 95, 222515 (2009).
- Loving et al. (2013) M. Loving, F. Jimenez-Villacorta, B. Kaeswurm, D. A. Arena, C. H. Marrows, and L. H. Lewis, “Structural evidence for stabilised ferromagnetism in epitaxial FeRh nanoislands,” J. Phys. D: Appl. Phys. 46, 162002 (2013).
- Mariager et al. (2012) S. O. Mariager, F. Pressacco, G. Ingold, A. Caviezel, E. Möhr-Vorobeva, P. Beaud, S. L. Johnson, C. J. Milne, E. Mancini, S. Moyerman, E. E. Fullerton, R. Feidenhans’l, C. H. Back, and C. Quitmann, “Structural and magnetic dynamics of a laser induced phase transition in FeRh,” Phys. Rev. Lett. 108, 087201 (2012).
- de Vries et al. (2014) M. A. de Vries, M. Loving, M. McLaren, R. M. D. Brydson, X. Liu, S. Langridge, L. H. Lewis, and C. H. Marrows, “Asymmetric “melting” and “freezing” kinetics of the magnetostructural phase transition in B2-ordered FeRh epilayers,” Appl. Phys. Lett. 104, 232407 (2014).
- Radu et al. (2010) I. Radu, C. Stamm, N. Pontius, T. Kachel, P. Ramm, J.-U. Thiele, H. A. Dürr, and C. H. Back, “Laser-induced generation and quenching of magnetization on FeRh studied with time-resolved x-ray magnetic circular dichroism,” Phys. Rev. B 81, 104415 (2010).
- Baldasseroni et al. (2012) C. Baldasseroni, C. Bordel, A. X. Gray, A. M. Kaiser, F. Kronast, J. Herrero-Albillos, C. M. Schneider, C. S. Fadley, and F. Hellman, “Temperature-driven nucleation of ferromagnetic domains in FeRh thin films,” Appl. Phys. Lett. 100, 262401 –262401–5 (2012).
- Mariager et al. (2013) S. O. Mariager, L. Le Guyader, M. Buzzi, G. Ingold, and C. Quitmann, “Imaging the antiferromagnetic to ferromagnetic first order phase transition of FeRh,” (2013), arXiv:1301.4164v1 [cond-mat.mtrl-sci] .
- Kinane et al. (2014) C. J. Kinane, M. Loving, M. A. de Vries, R. Fan, T. R. Charlton, J. S. Claydon, D. A. Arena, F. Maccherozzi, S. S. Dhesi, D. Heiman, C. H. Marrows, L. H. Lewis, and S. Langridge, “Observation of a temperature dependent asymmetry in the domain structure of a Pd doped FeRh epilayer,” New J. Phys. 16, 113073 (2014).
- Kushwaha et al. (2009) P. Kushwaha, A. Lakhani, R. Rawat, and P. Chaddah, “Low-temperature study of field-induced antiferromagnetic-ferromagnetic transition in Pd-doped Fe-Rh,” Phys. Rev. B 80, 174413 (2009).
- Yuasa et al. (1994) S. Yuasa, H. Miyajima, Y. Otani, K. Tsuji, Y. Katayama, K. Kusumi, H. Yokoyama, K. Yaoita, and O. Shimomura, “First-order magnetic phase transition in bcc FeRh–Ir alloy under high pressures up to 6.2 GPa,” J. Phys. Soc. Japan 63, 855 (1994).
- Le Graët et al. (2013) C. Le Graët, M. A. de Vries, M. McLaren, R. M. D. Brydson, M. Loving, D. Heiman, L. H. Lewis, and C. H. Marrows, “Sputter growth and characterisation of metamagnetic B2-ordered FeRh epilayers,” J. Vis. Exp. 80, e50603 (2013).
- Warren (1969) B. E. Warren, X-Ray Diffraction (Addison-Wesley, Reading, Mass, 1969).
- Björck and Andersson (2007) M. Björck and G. Andersson, “GenX: an extensible X-ray reflectivity refinement program utilizing differential evolution,” J. Appl. Cryst. 40, 1174 (2007).
- Note (1) The full set of fitting parameters are available in the Supplementary Material, available at [insert URL].
- Aharoni (1981) A. Aharoni, Bull. Amer. Phys. Soc. 26, 1218 (1981).
- Marrows, Chapon, and Langridge (2009) C. H. Marrows, L. C. Chapon, and S. Langridge, “Spintronics and functional materials,” Materials Today 12, 70 (2009).
- Note (2) The PNR spectra and the full set of fitting parameters are available in the Supplementary Material, available at [insert URL].
- (45) P. A. Kienzle, J. Krycka, N. Patel, and I. Sahin, (2011). Refl1D (Version 0.7.6) [Computer Software]. College Park, MD: University of Maryland. Retrieved October 2014. Available from http://reflectometry.org/danse.
- Saerbeck et al. (2010) T. Saerbeck, F. Klose, D. Lott, G. J. Mankey, Z. Lu, P. R. LeClair, W. Schmidt, A. P. J. Stampfl, S. Danilkin, M. Yethiraj, and A. Schreyer, “Artificially modulated chemical order in thin films: A different approach to create ferro/antiferromagnetic interfaces,” Phys. Rev. B 82, 134409 (2010).