Submitted to Proceedings of the National Academy of Sciences of the United States of America \urlwww.pnas.org/cgi/doi/10.1073/pnas.0709640104 \issuedateIssue Date \issuenumberIssue Number
Submitted to Proceedings of the National Academy of Sciences of the United States of America
Heat transport in boiling turbulent Rayleigh-Bénard convection
Abstract
Boiling is an extremely effective way to promote heat transfer from a hot surface to a liquid due to several mechanisms many of which are not understood in quantitative detail. An important component of the overall process is that the buoyancy of the bubbles compounds with that of the liquid to give rise to a much enhanced natural convection. In this paper we focus specifically on this enhancement and present a numerical study of the resulting two-phase Rayleigh-Bénard convection process. We make no attempt to model other aspects of the boiling process such as bubble nucleation and detachment. We consider a cylindrical cell with a diameter equal to its height. The cell base and top are held at temperatures above and below the boiling point of the liquid, respectively. By keeping the temperature difference constant and changing the liquid pressure we study the effect of the liquid superheat in a Rayleigh number range that, in the absence of boiling, would be between and . We find a considerable enhancement of the heat transfer and study its dependence on the bubble number, the degree of superheat of the hot cell bottom and the Rayleigh number. The increased buoyancy provided by the bubbles leads to more energetic hot plumes detaching from the hot cell bottom and, as a consequence, the strength of the circulation in the cell is significantly increased. Our results are in general agreement with recent experimental results of Zhong et al., Phys. Rev. Lett. 102, 124501 (2009) for boiling Rayleigh-Bénard convection.
keywords:
convection — heat transport — bubbles — plumes — boundary-layersThe greatly enhanced heat transfer brought about by the boiling process is believed to be due to several interacting components, see, e.g., [1, 2, 3]. With their growth the bubbles cause a micro-convective motion on the heating surface and, as they detach by buoyancy, the volume they vacate tends to be replaced by cooler liquid. Especially in subcooled conditions, the liquid in the relatively stagnant microlayer under the bubbles can evaporate and condense on the cooler bubble top. This process provides for the direct transport of latent heat, which is thus able to bypass the low-velocity liquid region adjacent to the heated surface due by the no-slip condition. The bubble growth process itself requires latent heat and, therefore, also removes heat from the heated surface and the neighboring hot liquid. Finally, with their buoyancy, the bubbles enhance the convective motion in the liquid beyond the level caused by the well-known single-phase Rayleigh-Bénard convection mechanisms, see e.g., [1, 2, 3]. This last process is the aspect on which we focus in the present paper.
In classical single-phase Rayleigh-Bénard (RB) convection, the dimensionless heat transport, , the Nusselt number, is defined as the ratio of the total heat transported through the cell to the heat that would be transported by pure conduction with a quiescent fluid. This ratio increases well above 1 as the Rayleigh number is increased due to the onset of circulatory motion in the cell. Here is the acceleration of gravity, the isobaric thermal expansion coefficient, the difference between the temperature of the hot bottom plate and the temperature of the cold top plate, the height of the cell, the kinematic viscosity and the thermal diffusivity. Further, depends on the shape of the cell, its aspect ratio (defined for a cylindrical cell of diameter as ) and the Prandtl number of the liquid. For in the range and in the range , the heat transport satisfies an approximate scaling relation [6, 7].
How is this scaling modified if the hot plate temperature is above the fluid saturation temperature , so that phase change can occur? The present paper addresses this question focusing on the enhanced convection caused by the bubble buoyancy, rather than attempting a comprehensive modeling of the actual boiling process in all its complexity. We carry out numerical simulations in the range for a cylindrical cell with aspect ratio for , which is appropriate for water at 100 oC under normal conditions.
This work differs in two major respects from our earlier studies of the problem. In the first place, we are now able to reach a much higher Rayleigh number, 5 as opposed to 2 as in[9], and to include three times as many bubbles. Secondly, we now study the effect of the liquid superheat which was held fixed before.
The extensive literature on boiling leads to the expectation that the appearance of bubbles would cause a substantial increase in with respect to single-phase convection, see e.g., Ref. [1]. For RB convection, the effect of phase change has recently been studied in Ref. [8] for the case of ethane near the critical point, and indeed a major increase of the heat transport has been found.
1 Model
The present paper is based on the same mathematical model and numerical method that we have used in Ref. [9] and several other recent papers [10, 11, 12] to which the reader is referred for details. Briefly, for the purposes of their interaction with the liquid, the bubbles are modelled as point sources of momentum and heat for the liquid treated in the Boussinesq approximation. The motion of each bubble, envisaged as a sphere, is followed in a Lagrangian way by means of an equation which, in addition to buoyancy, includes drag, added mass and lift. In its mechanical aspects, therefore, the model is similar to existing ones which have been extensively used in the literature to simulate dilute disperse flows with bubbles and particles (see e.g. Refs. [4, 5]). The novelty of our model lies in the addition of the thermal component. The heat exchange between the bubble and the liquid in its vicinity is modelled by means of a heat transfer coefficient dependent on the Peclet number of the bubble-liquid relative motion and on the Prandtl number of the liquid. The radial motion of the bubbles is slow enough that the vapor pressure remains essentially equal to the ambient pressure, which implies that the bubble surface temperature can be assumed to remain at the saturation value. The bubble volume, on which the enhanced buoyancy effect depends, is calculated by assuming that the entire heat absorbed by a bubble is used to generate vapor at the saturation density and pressure.
The calculation is carried out on a finite-difference grid based on cylindrical coordinates. The standard staggered-grid arrangement is used for the flow variables and the projection method for the calculation of the pressure and time stepping. No-slip conditions are applied on the bottom and top of the cell and free-slip is allowed on the lateral boundary. The Lagrangian treatment of the bubbles proceeds by means of a third-order Runge-Kutta method. The energy and force imparted by each bubble to the liquid are interpolated to the grid points of the cell containing the bubble in such a way as to preserve the total energy and the resultant and moment of the force.
Simulations are carried out on computational grids with the angular, radial, and axial directions discretized by means of , , , and nodes for , , , and . The simulations are therefore well resolved according to the requirements specified in Refs. [13, 12]. We have also checked the global balances of appendix B in Ref. [9] finding that they were satisfied to within .
When a bubble reaches the top cold plate it is removed from the calculation to model condensation and a new bubble is introduced at a random positions on the bottom hot plate so that the total number of bubbles in the calculation remains constant. We do not attempt to model the nucleation process which, with the present state of knowledge, cannot be done on the basis of first principles and which would require addressing extremely complex multi-scale issues. For our limited purpose of studying the bubble-induced increased buoyancy it is sufficient to simply generate a new bubble at the hot plate. We do not model the process by which the bubble detaches from the plate but assume that it is free to rise immediately as it is introduced. The initial bubble radius is arbitrarily set at 38 m. As shown in Ref. [11], the initial bubble size is immaterial provided it is in the range of a few tens of microns. In view of their smallness, the latent heat necessary for their generation is very small and is neglected. We show results for three values of the total number of bubbles , namely , 50000, and 150000. Another parameter we vary is the degree of superheat, , which we express in the dimensionless form .
The Nusselt number shown in the following is defined as a , where is the liquid thermal conductivity and is the heat flux into the bottom plate. This quantity differs from , the heat flux at the upper plate, due to the removal of the bubbles that reach the top boundary111The Nusselt number shown in our previous papers [9, 10, 11] are based on the average between and ..
An important new parameter introduced by the bubbles is the Jakob number , where and are the densities of liquid and vapor, is the liquid specific heat, and is the latent heat for vaporization. Physically, expresses the balance between the available thermal energy and the energy required for vaporization. With oC, varies between 0 and 1.68 as varies between 0 and 1/2. For , the bubbles introduced at the hot plate can only encounter liquid at saturation temperature or colder, and therefore they cannot grow but will mostly collapse. On the other hand, for , they have significant potential for growth.
To give an impression of the physical situation corresponding to our parameter choices, we may mention that 100 oC water in a 15 cm-high cylinder with an imposed temperature difference oC would correspond to . The Kolmogorov length scale based on the volume- and time-averaged kinetic energy dissipation in single-phase RB convection is 3 mm for and 0.5 mm for , see e.g., Ref. [7], and is therefore always much larger than the initial size of the injected bubbles (i.e., times larger for the highest Rayleigh number).
2 Observations on heat transport and flow organization
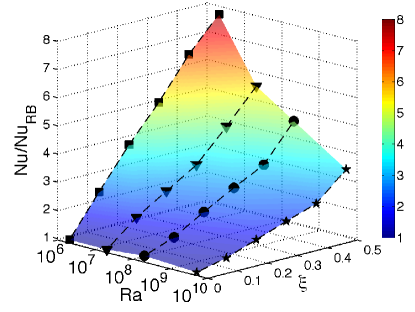
In Figure 1, the dependence of on the Rayleigh number and the dimensionless superheat is shown for bubbles. Here is normalized by , the single-phase Nusselt number corresponding to the same value of . Each symbol shows the result of a separate simulation carried out for the corresponding values of and . A colored surface is interpolated through the computed results with the color red corresponding to and the color blue .
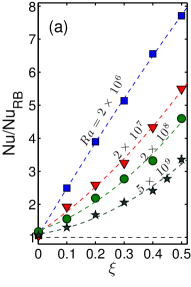
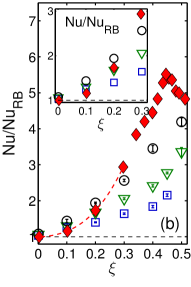
The same data are shown on a two-dimensional plot of vs. in Figure 2a for four different Rayleigh numbers in descending order; here the dashed lines are drawn as guides to the eye. It is evident that the relative enhancement of the heat transport is a decreasing function . This statement, however, does not apply to the absolute heat transport shown in Figure 2b, where is not normalized by the single-phase value. Here increases in ascending order, which shows that the bubbles always have a beneficial effect on the heat transport. For very small superheat the heat transport approaches the single-phase value as shown in the inset of Figure 2b.
Figures 1 and 2 show results calculated keeping the bubble number fixed. This procedure, therefore, does not faithfully reflect physical reality as it is well known that the number of bubbles is an increasing function of superheat. The dependence is actually quite strong, with the number of bubbles proportional to raised to a power between 3 and 4 [1]. However, varying independently and permits us to investigate separately the effect of these quantities.
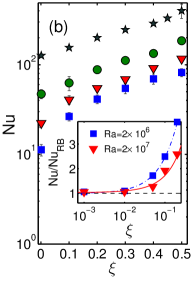
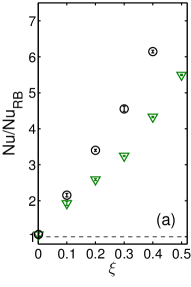
The effect of changing the bubble number from 50000 to 150000 at the same is shown in Figures 3a and 3b for and , respectively. In the latter case we also include results for . For small the heat transfer enhancement is small as the bubbles will mostly encounter colder liquid, condense and add very little to the system buoyancy. As the superheat increases, however, the effect of the bubbles become stronger and stronger, and larger the larger their number.
In Figure 3b, the solid symbols are the data of Ref. [8] taken at a higher Rayleigh number, 222This paper reports data for both increasing and decreasing superheat. We show here only the latter data because, for increasing superheat, there is a threshold for fully developed boiling conditions which pushes the onset of bubble appearance beyond . For decreasing on the other hand fully developed boiling conditions prevail all the way to small values of . The inset in the figure shows our computed results and the experimental data for . A major difference between our simulations and the experiment is that, in the latter, the number of bubbles increases with the superheat, while it remains constant with in the simulations. We can nevertheless attempt a comparison as follows. Quadratic interpolation using our results for the three values of suggests that, in order to match the experimental values, we would need 63000 for 0.2 and 250000 for 0.3. If, as suggested by experiment, the actual physical process results in a relation of the form , we find 3.4 which falls in the experimental range mentioned before. With this value of , we can estimate the number of bubbles necessary to account for the measured at . Using we find 5968 for and 6000 for . These values are in agreement and consistent with the fact that our computed result at 10000 is somewhat higher than the measured value for . The picture that emerges from these considerations is therefore in reasonable agreement with experiment. A similar exercise cannot be carried out for larger values of as in the experiment bubbles then become so large that they coalesce and form slugs with non-negligible dimensions. Our model, in which the vapor volume fraction is assumed to be so small as to be negligible, clearly cannot be applied to this situation.
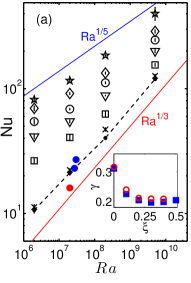
The heat transport in single-phase RB convection can be approximated by an effective scaling law . In the present range the experimental data are well represented with the choices and 0.120. How does the effective scaling law change for boiling convection? Figure 4a shows the Nusselt number vs. Rayleigh number for different values of for bubbles. The two solid lines have slopes and , while the dashed line shows the single-phase values. If we fit for the boiling case again with an effective scaling law , we obtain the effective exponents shown in the inset of the figure (as blue squares). Of course, and, as increases, decreases to a value close to 0.20. In the range the numerical results for are well represented by , which monotonically increases from 1 to 33.15 for . How strongly do the pre-factor and the effective scaling exponent depend on ? In the inset of the same figure, we show for bubbles (see red-circles), in order to compare with the case. The functional dependence is very close for the two cases. Further, we find for 150000 bubbles, i.e., a stronger dependence as compared to the case, reflecting the enhanced number of bubbles.
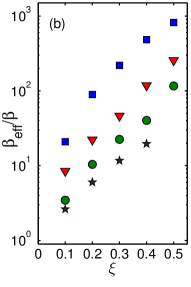
It is tempting to regard the increased heat transport as due to the additional buoyancy provided by the bubbles. In this view, the Rayleigh number should be based on an effective buoyancy in place of the pure liquid buoyancy . An expression for can then be found by equating to with the result
| (1) |
The quantity as given by this relation is shown in Figure 4b as function of and for . For the same , decreases as increases as expected on the basis of Figures 1 and 2. For fixed , increases with , also as expected. It is quite striking that can exceed by nearly 3 orders of magnitude for and small Rayleigh number. Note that one cannot directly compare the numerical values for shown in figure 4b with an experiment in which is increased in a given cell, as in our plot is fixed, whereas in the experiment with as discussed above.
A recent Lattice-Boltzmann (LB) simulation of finite-size bubbles also found heat transport enhancement [15]. The results of this study for are shown by filled circles in Figure 4a. The heat transfer enhancements achieved are much smaller than ours, most likely due to the significantly smaller number of bubbles (only a few hundreds), as well as other differences (the values of , etc.) of lesser importance.
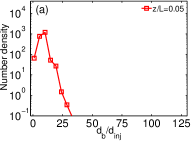
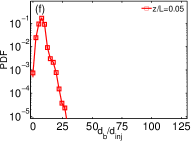
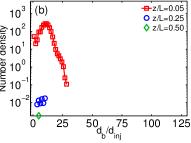
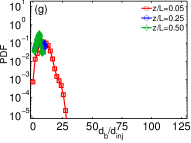
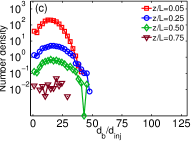
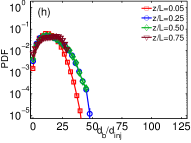
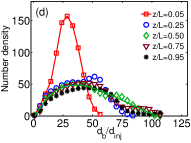
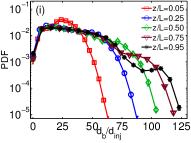
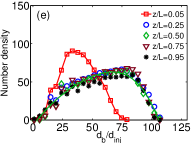
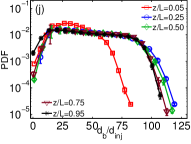
Where are the bubbles in the flow and how are they distributed in size, depending on their location? In Figure 5, the statistics on the bubble diameter computed at different vertical heights in the cylinder are shown. To get an immediate impression on how large the bubbles have grown, we have normalized the bubble diameter () with the initial injection diameter . We calculate the time averaged bubble density in thin horizontal slices positioned at 5 different vertical heights in the cylinder for various diameter ranges, see Figure 5 (a-e). For small superheat the bubble nuclei do not grow much: Most of them only up to a diameter 12 times the injection size and only very few towards 25 times the injection diameter (see a). Moreover, they do not make it up to one quarter of the cell height, as they encounter cold liquid and condense. As we increase , the bubbles grow to larger sizes and can even reach the top plate (see Figs. 5b to 5e). Though the number density at a given cross-section decreases a wide range of bubble size emerges, leading to poly-dispersity. The bubbles can grow up to a size of even 100 times the initial injection diameter. Note that for large and even more at , at any plane away from the boundary layers the number density shows a similar trend for bubble size distribution, reflecting the homogeneously boiling situation. In the right column of Figure 5 (see f-j), we show the corresponding probability density functions (PDFs) vs. the bubble diameter, now all in log-linear form. Again we see that both the bubble maximum and the most probable diameter increase as we increase .
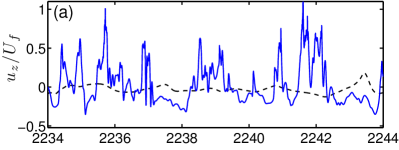
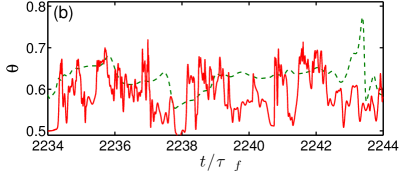
We now come to the local flow organization. As well known the boundary layers formed on the bottom (and top) plate are marginally stable and occasional intermittent eruptions of hot (or cold) liquid occur at their edges. Vapor bubbles subject these boundary layers to intense fluctuations which enhance the convective effects. As an example, Figure 6 shows sample time records of the dimensionless vertical velocity (top panel), and temperature (bottom panel) vs. normalized time near the axis at , i.e., just outside the hot thermal boundary layer. The velocity scale is defined by and . The dashed lines are results for the single-phase case. The immediate observation is that the small-scale fluctuations are much stronger in the two-phase case. As expected, the positive and negative velocity fluctuations are correlated with warm and cold temperature fluctuations, respectively.
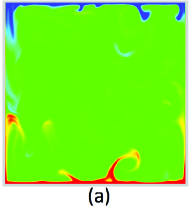
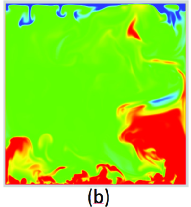
To give an impression of the difference brought about by the presence of bubbles on the convective motions in the cell, we show in Figure 7 snapshots of the dimensionless temperature in a vertical plane through the axis of the cell for in the single-phase (a) and two-phase (b) cases, the latter for and . We notice that bubbles considerably thicken the layer of hot fluid near the base and make it more energetic compared to the single-phase situation. Chunks of hot liquid can be seen all the way up near the cold plate, presumably caused by the latent heat deposited by condensing bubbles in the bulk liquid. The up-down symmetry of the single-phase case that can be seen in the left panel is markedly absent in the two-phase case because of the tendentially upward motion of the bubbles which condense on encountering liquid colder than . This mechanism is evidently quite different from the symmetry-breaking process observed in non-Boussinesq systems which is due to the temperature dependence of viscosity, see e.g., Ref. [16].
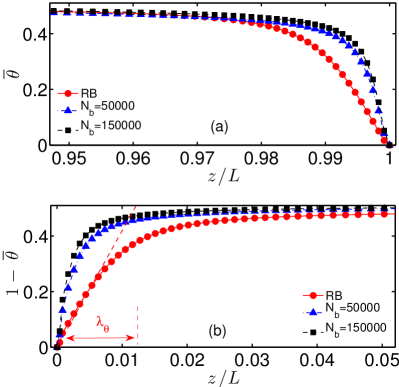
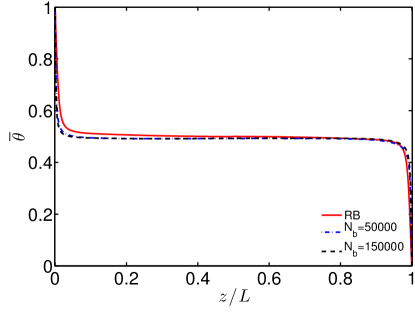
Figure 8 shows the time and area-averaged mean temperature in the cell as a function of height. The red line is the single-phase case, while the dashed line is for the two-phase cases with ; the results for the different bubble numbers superpose within the resolution of this figure. For both cases the dimensionless bulk mean temperature is close to 0.5, i.e., . A close inspection of the figure shows that this tendency is enhanced in the two-phase case because the bubble surface temperature is fixed at the same value . It may be expected that, in this situation, not many bubbles will grow or condense in the bulk and only condense once they reach the neighborhood of the top plate. The figure also shows that, in the two-phase case, the boundary layers near the top and bottom plates are not symmetric. This feature can be seen more clearly in Figure 9 where details of the mean temperature near the upper and lower plates are shown. The lack of symmetry between the two is more evident here together with the thinning of the boundary layers with increasing numbers of bubbles. This latter result is a clear manifestation of the enhanced convective circulation inside the cell promoted by increasing the number of bubbles.
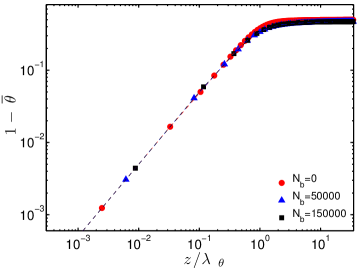
For the hot plate, one can define the thermal boundary layer thickness as where is the mean temperature gradient at the hot plate. Replotting the data of the bottom panel in Figure 9 as functions of , we find the results shown in Figure 10. The three sets of data now collapse on a single line in the range . The small differences farther away from the wall reflect differences in the shape factor of the boundary layers.
3 Summary and Conclusions
In summary, our investigation of a simple model of Rayleigh-Bénard convection with boiling has demonstrated the effect of the degree of superheat and of the bubble number on heat transport. Comparison with existing data suggests a basic conformity of our results with some physical features of a real systems. Vapor bubbles significantly enhance the heat transport primarily by increasing the strength of the circulatory motion in the cell. The velocity and thermal fluctuations of the boundary layers are increased and, by releasing their latent heat upon condensation in the bulk fluid, the bubbles also act as direct carriers of energy. We have shown that the heat transfer enhancement can be interpreted in terms of an enhanced buoyancy which is shown in Eq. (1) and Figure 4b. The relative effect of the bubbles diminishes as increases.
Acknowledgements.
We are thankful to G. Ahlers and F. Toschi for providing their valuable data and numerical results and to L. Biferale and C. Sun for helpful discussions. We acknowledge financial support by the Foundation for Fundamental Research on Matter (FOM) and the National Computing Facilities (NCF) sponsored by NWO. Computations have been performed on the Huygens cluster of SARA in Amsterdam. This research is part of the FOM Industrial Partnership Program on Fundamentals of Heterogeneous Bubbly Flows. P.O. gratefully acknowledges support from FIRB under grant RBFR08QIP5_001.References
- [1] V. K. Dhir, Boiling heat transfer, Annu. Rev. Fluid Mech. 30, 365 (1998).
- [2] V. P. Carey (1992), Liquid-vapor phase-change phenomena, (Hemisphere, New York, United States).
- [3] John H. Lienhard IV, and John H. Lienhard V A Heat Transfer Textbook, (Dover Publications, New York, United States).
- [4] (Eds.) S. Balachandar, and Andrea Prosperetti, IUTAM Symposium on Computational Approaches to Multiphase Flow, (Springer 2004).
- [5] (Eds.) Andrea Prosperetti, and Grétar Tryggvasson Computational Methods For Multiphase Flow, (Cambridge University Press 2007).
- [6] G. Ahlers, S. Grossmann, and D. Lohse, Heat transfer and large scale dynamics in turbulent Rayleigh-Bénard convection, Rev. Mod. Phys. 81, 503 (2009).
- [7] D. Lohse and K. Q. Xia, Small-scale properties of turbulent Rayleigh-Bénard convection, Ann. Rev. Fluid Mech. 42, 335 (2010).
- [8] J. Q. Zhong, D. Funfschilling, and G. Ahlers, Enhanced heat transport by turbulent two-phase Rayleigh-Bénard convection, Phys. Rev. Lett. 102, 124501 (2009).
- [9] P. Oresta, R. Verzicco, D. Lohse, and A. Prosperetti, Heat transfer mechanisms in bubbly Rayleigh-Bénard convection, Phys. Rev. E 80, 026304 (2009).
- [10] L. E. Schmidt, P. Oresta, F. Toschi, R. Verzicco, D. Lohse, and A. Prosperetti, Modification of turbulence in Rayleigh-Bénard convection by phase change, New Journal of Physics 13, 025002 (2011).
- [11] R. Lakkaraju, L. E. Schmidt, P. Oresta, F. Toschi, R. Verzicco, D. Lohse, and A. Prosperetti, Effect of vapor bubbles on velocity fluctuations and dissipation rates in bubbly Rayleigh-Bénard convection, Phys. Rev. E 84, 036312 (2011).
- [12] R. Lakkaraju, R. J. A. M. Stevens, R. Verzicco, S. Grossman, A. Prosperetti, C. Sun, and D. Lohse, Spatial dependence of fluctuations and flux in turbulent Rayleigh-Bénard convection, Physical Review E, 86, 056315 (2012)
- [13] R. J. A. M. Stevens, R. Verzicco, and D. Lohse, Radial boundary layer structure and Nusselt number in Rayleigh-Bénard convection, J. Fluid Mech. 643, 495 (2010).
- [14] R. Verzicco and R. Camussi, Numerical experiments on strongly turbulent thermal convection in a slender cylindrical cell, J. Fluid Mech. 477, 19 (2003).
- [15] L. Biferale, P. Perlekar, M. Sbragaglia, and F. Toschi, Convection in multiphase fluid flows using lattice boltzmann methods, Phys. Rev. Lett. 108, 104502 (2012).
- [16] G. Ahlers, E. Brown, F. F. Araujo, D. Funfschilling, S. Grossmann, and D. Lohse, Non-Oberbeck-Boussinesq effects in strongly turbulent Rayleigh-Bénard convection, J. Fluid Mech. 569, 409-445 (2006).