Wyrm, A Pythonic Toolbox for Brain-Computer Interfacing
Abstract
A Brain-Computer Interface (BCI) is a system that measures central nervous system activity and translates the recorded data into an output suitable for a computer to use as an input signal. Such a BCI system consists of three parts, the signal acquisition, the signal processing and the feedback/stimulus presentation.
In this paper we present Wyrm, a signal processing toolbox for BCI in Python. Wyrm is applicable to a broad range of neuroscientific problems and capable for running online experiments in real time and off-line data analysis and visualisation.
Index Terms:
Brain-Computer Interfacing, BCI, Toolbox, Python1 Introduction
In the last years Python has gained more and more traction in the scientific community. Projects like Numpy [Numpy], SciPy [SciPy], and Matplotlib [Matplotlib] have created a strong foundation for scientific computing in Python and machine learning packages like Scikit-learn [Scikit-learn] or packages for data analysis like Pandas [Pandas] are building on top of it. Although in recent years Python toolboxes like SCoT for EEG source connectivity [Billinger], or MNE-Python for MEG and EEG data analysis [Gramfort] were published, Matlab seems still to be the dominant programming language in the brain-computer interface (BCI) community.
A BCI is a system that measures central nervous system activity and translates the recorded data into an output suitable for a computer to use as an input signal. Or slightly less abstract: A BCI is a communication channel that allows for direct control of a computer by the power of thoughts.
A BCI system consists of three parts (Figure 1): a signal acquisition part that is connected to the measuring hardware (e.g. EEG) and provides the raw data to the rest of the BCI system. The signal processing part receives the data from the signal acquisition and translates the data into the intent. The feedback/stimulus presentation part translates the intent into an action.

In this paper we present Wyrm, an open source BCI toolbox in Python. Wyrm corresponds to the signal processing part of the aforementioned BCI system. Wyrm is applicable to a wide range of neuroscientific problems. It can be used as a toolbox for analysis and visualization of neurophysiological data (e.g. EEG, ECoG, fMRI, or NIRS) and it is suitable for real-time online experiments. In Wyrm we implemented dozens of methods, covering a broad range of aspects for off-line analysis and online experiments.
In the following sections we will explain Wyrm’s fundamental data structure, its design principles and give an overview of the available methods of the toolbox. We’ll show you where to find the documentation as well as some extensive examples.
2 Design
All methods in the toolbox revolve around a data structure that is used throughout the toolbox to store various kinds of data. The data structure dubbed Data, is an object containing an n-dimensional numpy array that represents the actual data to be stored and some meta data. The meta data describes for each dimension of the numpy array, the name of the dimension, the names of the single columns and the unit of the data.
Let’s assume we have a record of previously recorded EEG data. The data was recorded with 20 channels and consists of 30 samples. The data itself can be represented as a 2-dimensional array with the shape (30, 20). The names for the dimensions are ’time’ and ’channels’, the units are ’ms’ and ’#’ (we use ’#’ as a pseudo unit for enumeration of things), and the description of the columns would be two arrays: one array of length 30 containing the time stamps for each sample and another array of length 20 containing the channel names. This data structure can hold all kinds of BCI related data: continuous data, epoched data, spectrograms, feature vectors, etc.
We purposely kept the meta data at a minimum, as each operation that modifies the data also has to check if the meta data is still consistent. While it might be desirable to have more meta data, this would also lead to more housekeeping code which makes the code less readable and more error prone. The data structure, however, can be extended as needed by adding new attributes dynamically at runtime. All toolbox methods are written in a way that they ignore unknown attributes and never throw them away.
We tried very hard to to keep the syntax and semantics of the toolbox methods consistent. Each method obeys a small set of rules: (1) Methods never modify their input arguments. This allows for a functional style of programming which is in our opinion well suited when diving into the data. (2) A Method never modifies attributes of Data objects which are unrelated to the functioning of that method. Especially does it never remove additional or unknown attributes. (3) If a method operates on a specific axis of a Data object, it by default obeys a convention about the default ordering of the axis but allows for changing the index of the axis by means of a default arguments.
3 Toolbox Methods
The toolbox contains a few data structures (Data, RingBuffer and BlockBuffer), I/O-methods for loading and storing data in foreign formats and off course the actual toolbox algorithms. The list of algorithms includes: channel selection, IIR filters, sub-sampling, spectrograms, spectra, baseline removal for signal processing; Common Spatial Patterns (CSP) [Ramoser], Source Power Co-modulation (SPoC) [Dähne], classwise average, jumping means, signed -values for feature extraction; Linear Discriminant Analyis (LDA) with and without shrinkage for machine learning [Blankertz], and many more. It is worth mentioning that with scikit-learn you have a wide range of machine learning algorithms readily at your disposal. Our data format is very compatible with scikit-learn and one can usually apply the algorithms without any data conversion step at all.
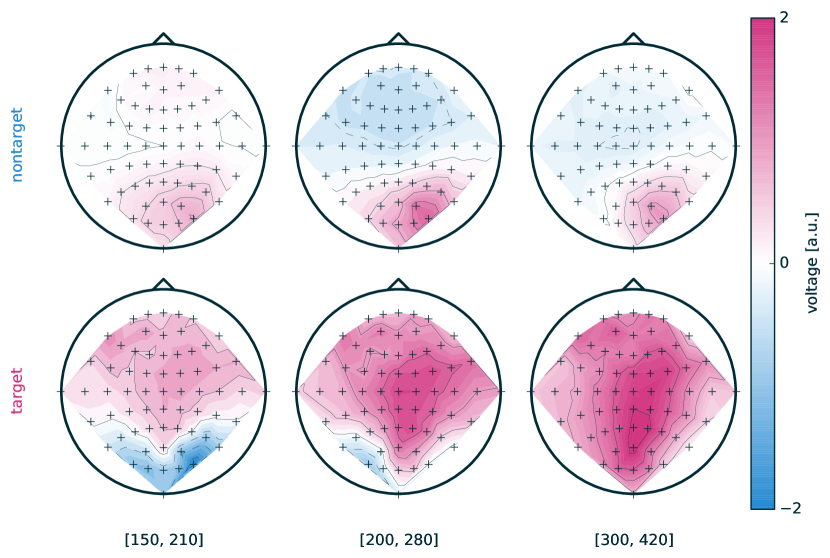
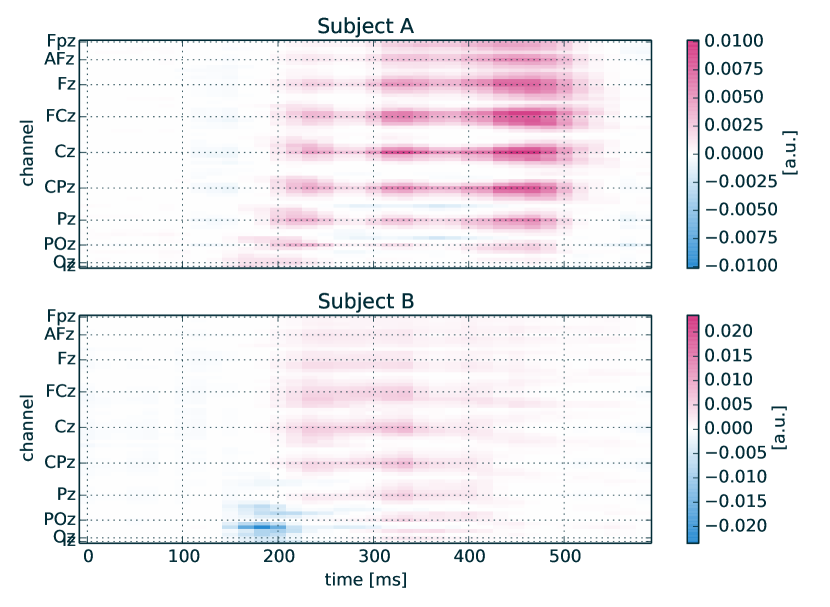
The toolbox also includes plotting facilities that make it easy to quickly generate useful plots out of neurophysiological data. Those methods include scalp plots (Figure 2), time courses (Figure 3), signed plots (Figure 4), and more.

4 Unit Testing
Since the correctness of its methods is crucial for a toolbox, we used unit testing to ensure all methods work as intended. In our toolbox each method is tested respectively by at least a handful of test cases to ensure that the methods calculate the correct results, throw the expected errors if necessary, etc. The total amount of code for all tests is roughly 2-3 times bigger than the amount code for the toolbox methods.
5 Documentation
As a software toolbox would be hard to use without proper documentation, we provide documentation that consists of readable prose and extensive API documentation (http://venthur.github.io/wyrm/). Each method of the toolbox is thoroughly documented and has usually a short summary, a detailed description of the algorithm, a list of expected inputs, return values and exceptions, as well as cross references to related methods in- or outside the toolbox and example code to demonstrate how to use the method.
6 Examples
To show how to use the toolbox realistic scenarios we provide two off-line analysis scripts, where we demonstrate how to use the toolbox to complete two tasks from the BCI Competition III [BCIComp3]. The first example uses Electrocorticography (ECoG) recordings provided by the Eberhard-Karls-Universität Tübingen. The time series where picked up by a 8x8 ECoG platinum grid which was placed on the contralateral, right motor cortex.
During the experiment the subject had to perform imagined movements of either the left small finger or the tongue. Each trial consisted of either an imagined finger- or tongue movement and was recorded for a duration of 3 seconds. The recordings in the data set start at 0.5 seconds after the visual cue had ended to avoid visual evoked potentials, being reflected by the data. It is worth noting that the training- and test data were recorded on the same subject but with roughly one week between both recordings. The data set consists of 278 trials of training data and 100 trials of test data. During the BCI Competition only the labels (finger or tongue movement) for the training data were available. The task for the competition was to use the training data and its labels to predict the 100 labels of the test data. Since the competition is over, we also had the true labels for the test data, so we could calculate and compare the accuracy of our results. For this experiment our classification accuracy was 92% which is comparable with the winners of the competition whose accuracy was: 91%, 87%, and 86%.
The second data set uses Electroencephalography (EEG) recordings, provided by the Wadsworth Center, NYS Department of Health, USA. The data were acquired using BCI2000’s Matrix Speller paradigm, originally described in [Donchin]. The subject had to focus on one out of 36 different characters, arranged in a 6x6 matrix. The rows and columns were successively and randomly intensified. Two out of 12 intensifications contained the desired character (i.e., one row and one column). The event-related potential (ERP) components evoked by these target stimuli are different from those ERPs evoked by stimuli that did not contain the desired character. The ERPs are composed of a combination of visual and cognitive components. The subject’s task was to focus her/his attention on characters (i.e. one at a time) in a word that was prescribed by the investigator. For each character of the word, the 12 intensifications were repeated 15 times before moving on to the next character. Any specific row or column was intensified 15 times per character and there were in total 180 intensifications per character. The data was recorded using 64 channel EEG. The 64 channels covered the whole scalp of the subject and were aligned according to the 10-20 system. The collected signals were bandpass filtered from 0.1-60Hz and digitized at 240Hz. The data set consists of a training set of 85 characters and a test set of 100 characters for each of the two subjects. For the trainings sets the labels of the characters were available. The task for this data set was to predict the labels of the test sets using the training sets and the labels. In this experiment we reached a classification accuracy for single letters of 93,5%, the winners of the competition reached 96,5%, 90,5%, and 90%.
We also provide an example online experiment where we use the ERP data set with an pseudo amplifier that feeds the data in real-time to the toolbox, to show how to do the classification task in an online setting.
The data sets from the competition are freely available and one can reproduce our results using the scripts and the data.
7 Python 2 vs Python 3
The ongoing transition from Python 2 to Python 3 was also considered and we decided to support both Python versions. Wyrm is mainly developed under Python 2.7, but written in a forward compatible way to support Python 3 as well. Our unit tests ensure that the methods provide the expected results in Python 2 and Python 3.
8 Summary and Conclusion
In this paper we presented Wyrm, a free and open source BCI toolbox in Python. We introduced Wyrm’s main data structure and explained the design ideas behind the current implementation. We gave a short overview of the existing methods in the toolbox and showed how we utilized unit testing to make sure the toolbox works as specified, where to find the extensive documentation and some detailed examples.
Together with Mushu [Mushu] our signal acquisition library and Pyff [Pyff] our Framework for Feedback and Stimulus Presentation, Wyrm adds the final piece to our ongoing effort to provide a complete, free and open source BCI system in Python.
Wyrm is available under the terms of the MIT license, its repository can be found at http://github.com/venthur/wyrm.
9 Acknowledgements
This work was supported in part by grants of the BMBF: 01GQ0850 and 16SV5839. The research leading to this results has received funding from the European Union Seventh Framework Programme (FP7/2007-2013) under grant agreements 611570 and 609593.
References
- [Blankertz] Blankertz B, Lemm S, Treder MS, Haufe S, Müller KR (2011) Single-trial analysis and classification of ERP components – a tutorial. NeuroImage 56:814– 825, http://dx.doi.org/10.1016/j.neuroimage.2010.06.048
- [Dähne] Dähne S, Meinecke FC, Haufe S, Höhne J, Tangermann M, Müller KR, Nikulin VV (2014) SPoC: a novel framework for relating the amplitude of neuronal oscillations to behaviorally relevant parameters. NeuroImage 86(0):111–122, http:://dx.doi.org/10.1016/j.neuroimage.2013.07.079
- [Mushu] Bastian Venthur and Benjamin Blankertz. Mushu, a Free and Open Source BCI Signal Acquisition, Written in Python. Engineering in Medicine and Biology Society (EMBC). doi: http://dx.doi.org/10.1109/EMBC.2012.6346296 San Diego, 2012.
- [Pyff] Bastian Venthur, Simon Scholler, John Williamson, Sven Dähne, Matthias S Treder, Maria T Kramarek, Klaus-Robert Müller and Benjamin Blankertz. Pyff—A Pythonic Framework for Feedback Applications and Stimulus Presentation in Neuroscience. Frontiers in Neuroscience. 2010. http://dx.doi.org/10.3389/fnins.2010.00179.
- [Ramoser] Ramoser H, Muller-Gerking J, Pfurtscheller G (2000) Optimal spatial filtering of single trial eeg during imagined hand movement. Rehabilitation Engineering, IEEE Transactions on 8(4):441–446
- [Donchin] E. Donchin, K. Spencer, and R. Wijesinghe. The mental prosthesis: assessing the speed of a p300-based brain-computer interface. Rehabilitation Engineering, IEEE Transactions on, 8(2):174–179, Jun 2000.
- [Gramfort] Gramfort, A., Luessi, M., Larson, E., Engemann, D. A., Strohmeier, D., Brodbeck, C., … & Hämäläinen, M. (2013). MEG and EEG data analysis with MNE-Python. Frontiers in neuroscience, 7.
- [Billinger] Billinger, M., Brunner, C., & Müller-Putz, G. R. (2014). SCoT: a Python toolbox for EEG source connectivity. Frontiers in neuroinformatics, 8. ISO 690
- [Numpy] http://numpy.org
- [SciPy] http://scipy.org
- [Matplotlib] http://matplotlib.org
- [Scikit-learn] http://scikit-learn.org
- [Pandas] http://pandas.pydata.org
- [BCIComp3] https://www.bbci.de/competition/iii/