A Search for Pulsations from Geminga Above 100 GeV with VERITAS
Abstract
We present the results of 71.6 hours of observations of the Geminga pulsar (PSR J0633+1746) with the VERITAS very-high-energy gamma-ray telescope array. Data taken with VERITAS between November 2007 and February 2013 were phase-folded using a Geminga pulsar timing solution derived from data recorded by the XMM-Newton and Fermi-LAT space telescopes. No significant pulsed emission above 100 GeV is observed, and we report upper limits at the 95% confidence level on the integral flux above 135 GeV (spectral analysis threshold) of 4.0 s-1 cm-2 and 1.7 s-1 cm-2 for the two principal peaks in the emission profile. These upper limits, placed in context with phase-resolved spectral energy distributions determined from five years of data from the Fermi-LAT, constrain possible hardening of the Geminga pulsar emission spectra above 50 GeV.
Subject headings:
Pulsars, VHE gamma-rays, Geminga Pulsar, PSR J0633+17461. Introduction
Following the completion of the Compton Gamma Ray Observatory (CGRO) mission in 2000, seven gamma-ray pulsars were known to exist. A combined total of 37 photons with energies exceeding 10 GeV were observed from five of these pulsars by the EGRET instrument on-board CGRO (Thompson et al., 2005). The Fermi Large Area Telescope (LAT) has now detected over 160 gamma-ray pulsars111https://confluence.slac.stanford.edu/display/GLAMCOG/Public+List+of+LAT-Detected+Gamma-Ray+Pulsars (see Caraveo 2014 for a review) and pulsar studies presented in the Fermi-LAT catalog of sources above 10 GeV (1FHL) have shown that 20 of these pulsars have Fermi-LAT detections above 10 GeV, with 12 also seen at energies above 25 GeV (Saz Parkinson et al., 2012; Ackermann et al., 2013). One common feature exhibited by all known gamma-ray pulsars is the shape of the spectral energy distribution (SED), which can be described by a power law followed by a spectral break occurring between 1 and 10 GeV (Abdo et al., 2013). The 12 pulsars observed above 25 GeV are largely drawn from the brightest of the Fermi pulsars (Fs-1cm-2) and thus are sufficiently bright to be detected by Fermi at these energies even as their spectrum falls rapidly above the break. The most favored general description of gamma-ray emission from pulsars in the Fermi era postulates that electrons are accelerated in the outer magnetosphere. This acceleration is limited by the radiation of synchrotron and curvature photons, leading to spectral cut-offs. Outer-magnetospheric models (outer-gap or slot-gap models) that implement this emission framework can, in general, reproduce the pulsar light curves and SEDs measured by the Fermi-LAT.
Recently the Vela pulsar - the brightest known gamma-ray pulsar - has been detected at energies above 30 GeV by H.E.S.S.222http://www.mpg.de/8287998/velar-pulsar and above 50 GeV in the Fermi-LAT data (Leung et al., 2014). The Crab pulsar, however, remains the only pulsar known to emit above 100 GeV. The power-law extension of the Crab pulsar SED measured above the GeV break by VERITAS (Aliu et al., 2011) and MAGIC (Aleksić et al., 2011, 2012) cannot be easily explained by curvature emission from the outer magnetosphere (Aliu et al., 2011; Lyutikov et al., 2012) unless the radius of curvature of the magnetic field line is larger than the radius of the light cylinder (Bednarek, 2012). Some recent models attribute the pulsed very-high-energy (VHE; 100 GeV) emission from the Crab pulsar to inverse-Compton (IC) scattering originating in the outer magnetosphere (Lyutikov et al., 2012; Du et al., 2012; Lyutikov, 2012) or to IC scattering from beyond the light cylinder (Aharonian et al., 2012; Pétri, 2012). The question of whether Crab-pulsar-like non-exponentially-suppressed VHE spectra are common in other gamma-ray pulsars, such as Geminga, has meaningful implications for our understanding of the physics of particle acceleration and emission from pulsars.
Located at a distance of 200 pc (Caraveo et al., 1996; Faherty et al., 2007), the Geminga pulsar is the second-brightest steady GeV source in the gamma-ray sky and is the original “radio-quiet” pulsar. It has a period of 237 ms, a spin-down age of 3 yr and a spin-down luminosity of 3.26 erg s-1 (Bignami & Caraveo, 1996). Originally detected as an unidentified source of 100 MeV gamma-ray emission by the SAS-2 and COS-B instruments (Fichtel et al., 1975; Bennett et al., 1977), its nature as a pulsar was established following the detection of pulsed X-ray emission in data recorded by the ROSAT satellite (Halpern & Holt, 1992). Reanalysis of the COS-B and SAS-2 data, using the pulsar timing solution determined from the ROSAT data, confirmed the MeV source to be a gamma-ray pulsar (Bignami & Caraveo, 1992; Mattox et al., 1992). Analysis of the available EGRET data further confirmed the identification (Bertsch et al., 1992). The pulsed X-ray source is composed of thermal radiation from hot-spots on the surface of the neutron star and non-thermal magnetospheric emission (Caraveo et al., 2004). Detailed gamma-ray observations of the Geminga pulsar have been made with the EGRET, AGILE and Fermi space telescopes (Mayer-Hasselwander et al., 1994; Fierro et al., 1998; Pellizzoni et al., 2009; Abdo et al., 2010b). Repeated radio searches have failed to find a radio-pulsar counterpart (Ramachandran et al., 1998; McLaughlin et al., 1999) while optical and UV pulsations have been reported at the 3.5 and 5 level, respectively (Shearer et al., 1998; Kargaltsev et al., 2005).
The Geminga pulsar has been a target for ground-based very-high-energy gamma-ray detectors for over two decades. Limits on the pulsed gamma-ray flux in the TeV regime at the 10% Crab Nebula level have been reported by the Whipple, HEGRA and PACT collaborations (Akerlof et al., 1993; Aharonian et al., 1999; Singh et al., 2009), while the Ootacamund, Durham and Crimean groups have reported weak evidence (3 level) for pulsed emission at the 50-100% Crab Nebula level (Vishwanath et al., 1993; Bowden et al., 1993; Neshpor et al., 2001). Given the far higher sensitivity of current ground-based gamma-ray arrays, it seems likely that these reported excesses are due to statistical fluctuations. At multi-TeV energies, an unpulsed and spatially extended source attributed to the Geminga pulsar wind nebula (Caraveo et al., 2003) has been detected at the 20% Crab Nebula level by the Milagro water-Cherenkov telescope (Abdo et al., 2007, 2009). Weak evidence (2.2) for this unpulsed source has also been reported at TeV energies by the Tibet air-shower array (Amenomori et al., 2010).
The phase-averaged differential photon flux of the Geminga pulsar, as measured by the Fermi-LAT in the range 0.1-50 GeV, is well described by a power law with an index of 1.30.01 at low energies, followed by a spectral break at 2.5 GeV (Abdo et al., 2010b). Above the break energy, a sub-exponential cut-off in the spectrum is favored over a pure exponential or super-exponential shape, as is commonly seen in the bright Fermi pulsars (Abdo et al., 2013). Lyutikov (2012) argues that above the spectral break, the spectrum can be described by a power law, a behavior similar to what has been measured by VERITAS and MAGIC in the Crab pulsar above the spectral break. Geminga is one of the 12 pulsars detected above 25 GeV in the 1FHL with the highest-energy photon attributed to the Geminga pulsar with a 95% confidence level having an energy of 33 GeV (Ackermann et al., 2013).
The remainder of this paper is structured in the following way. In Section 2 we describe our observations of the Geminga pulsar with the VERITAS gamma-ray telescope array and the Fermi-LAT data analyzed in this work. In Section 3 we discuss the temporal analysis of the Fermi-LAT data and describe the maximum-likelihood fitting procedures used to derive spectral energy distributions. In this section we also describe the VERITAS event processing and timing analysis. Section 4 details the results of the VERITAS and Fermi-LAT analyses, and in Section 5 we provide some discussion and concluding remarks.
2. Observations
VERITAS is a ground-based gamma-ray telescope array located at the Fred Lawrence Whipple Observatory at the base of Mount Hopkins in southern Arizona (Holder et al., 2006). The array consists of four imaging atmospheric-Cherenkov telescopes, each employing a tessellated 12 m Davies-Cotton reflector (Davies & Cotton, 1957) instrumented with a photomultiplier-tube camera with a 3.5 field of view. The VERITAS array is sensitive to gamma rays with energies between 80 GeV and 30 TeV, with a nominal sensitivity sufficient to detect, at the 5 level, a steady point-like source with 1% of the Crab Nebula flux in approximately 25 hrs. The VERITAS observations of Geminga presented here were made under clear, moonless skies between 2007 November and 2013 February. After data-quality selection, the resulting observations span a total of 71.6 hours performed at an average elevation of 72. The data set spans three different configurations of the VERITAS array: 2007 March to 2009 July, the original array layout; 2009 August to 2012 July, the layout following the relocation of one telescope; and 2012 August to present, following the upgrade of the VERITAS cameras and trigger system (see Kieda et al. 2011 for further details). The data were acquired in a mixture of ON and wobble (also known as false source) observation modes (Fomin et al., 1994).
The Fermi Large Area Telescope is a space-based electron-positron pair-conversion gamma-ray telescope composed of a silicon-strip particle tracker interleaved with tungsten foil conversion layers coupled to a cesium iodide calorimeter. It is sensitive to gamma rays in the energy range between 20 MeV and 300 GeV. The LAT has a field of view of 2.4 sr and operates primarily in an all-sky survey mode, covering the entire sky approximately every three hours (see Atwood et al. 2009 for further details). The Fermi-LAT analysis of the Geminga pulsar presented here uses 5.2 years of Pass-7 reprocessed photon data recorded by the Fermi-LAT between 2008 August 8th and 2013 October 18. The data were analyzed using the Fermi Science Tools version v9r33p0-fssc-20140520.
3. Data Analysis
3.1. Fermi-LAT Analysis
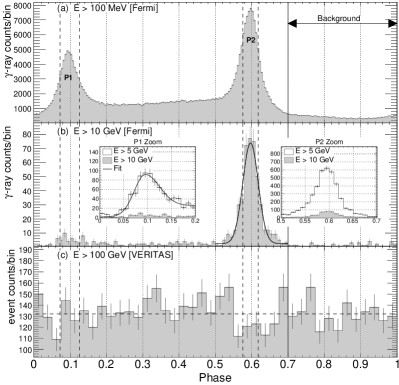
The Fermi-LAT analysis presented here follows the exact procedures and analysis choices described in the second LAT catalog of gamma-ray pulsars (Abdo et al., 2013). Source-class photon events within a 20 region-of-interest (ROI) around the location of the Geminga pulsar are selected, and time intervals when the edge of the ROI extended beyond 100 of the telescope zenith are removed to prevent contamination by gamma rays from the Earth’s limb. Events are barycentered and phase-folded using the Tempo2 package (Hobbs et al., 2006) with the Fermi Tempo2 plugin. The event times are folded using a timing model for Geminga derived from Fermi-LAT data provided by Matthew Kerr333www.slac.stanford.edu/~kerrm/fermi_pulsar_timing/ (Kerr et al., 2014). The resulting pulsar light curve, which is dominated by two emission peaks, labeled P1 and P2, connected by a “bridge” of enhanced emission, is plotted in Figure 1. The P1 and P2 peaks are fitted with asymmetric Gaussian functions above 5 GeV and 10 GeV, respectively. These energy cuts enable us to measure the width of the emission peaks at high energies while maintaining good statistics in each phase region. The regions around each peak (phases [0.072 - 0.125] for P1 and phases [0.575 - 0.617] for P2) are then used as gates for phase-resolved Fermi-LAT spectra and as signal regions for pulsed searches in the VERITAS data. To generate the LAT spectra, binned maximum-likelihood analyses are performed in 12 logarithmically spaced energy bands between 100 MeV and 100 GeV. In each energy band, a source model derived from the LAT 2-year point-source catalog (Nolan et al., 2012) is fitted to binned counts maps in a 1414 region centered at the location of the Geminga pulsar. The normalization of the galactic diffuse model and the normalization of all sources within 4 of Geminga are allowed to float, while all other parameters are fixed to the 2-year point-source catalog values. In each energy band, Geminga is modeled as a point source with a power-law spectrum, floating normalization, and a differential photon flux index fixed to the value 2. In addition, binned likelihood analyses are performed across the entire 100 MeV to 100 GeV energy range with the same prescription as above, with the differential photon flux of Geminga modeled as a power law multiplied by an exponential cut-off:
| (1) |
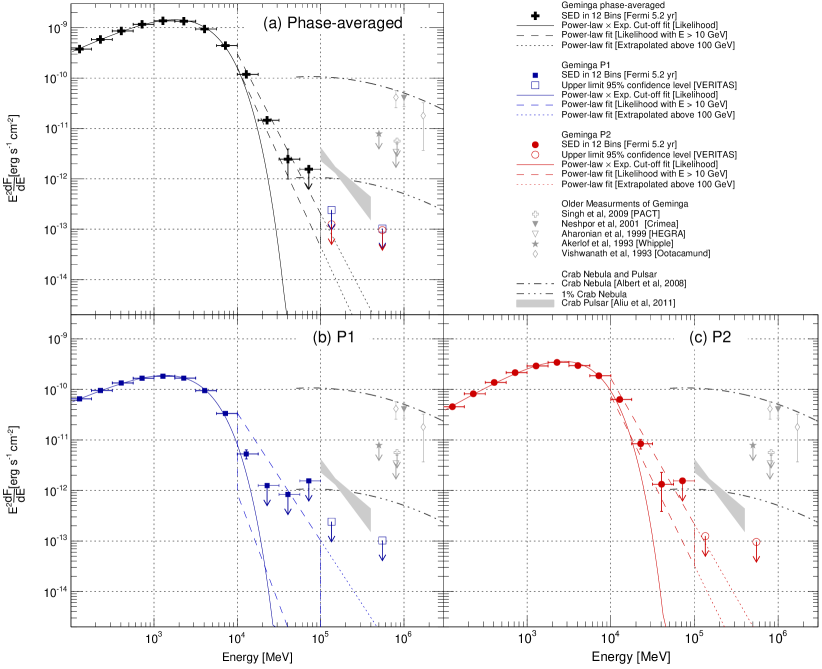
where the normalization (), index () and break energy () values allowed to float. The parameter is fixed to the value 615.7 MeV, which is the decorrelation energy value for Geminga reported in the LAT 2-year point-source catalog (Nolan et al., 2012). Finally, and in order to probe a possible power-law shape of the emission above the break, binned likelihood analyses are performed between 10 and 100 GeV, modeling the Geminga spectrum as a power law with floating normalization and index. The SEDs for P1 and P2 derived from these likelihood analyses, where the relevant cut on phase is applied to all events prior to performing the likelihood fits, are plotted alongside the phase-averaged SED (where no phase cut is applied) in Figure 2. For each likelihood fit, residual maps are generated between the measured counts map and corresponding best-fit model map, and are found to show good agreement between the data and model.
3.2. VERITAS Analysis
VERITAS data are passed through an analysis pipeline that reconstructs the arrival direction and the energy of each gamma-ray candidate from the Cherenkov images recorded by the telescopes. The images are parametrized with the standard Hillas moment-analysis method (Hillas, 1985). Event arrival directions and impact distances are calculated from the stereoscopic images of the air showers from multiple telescopes (Hofmann et al., 1999). Background suppression, i.e. cosmic ray rejection, and energy estimation are performed by comparing measured event parameters to Monte Carlo gamma-ray simulations with selection parameters combined in multidimensional energy-dependent look-up tables (Krawczynski et al., 2006). The optimal cut values for a 1% Crab Nebula strength source with a spectral index of 4 are determined a priori from the analysis of VERITAS data on the BL Lac object PG 1553113, which has this spectral index value (Aharonian et al., 2006; Orr et al., 2011).
After event selection, the event GPS times are converted to barycentric dynamical time and phase-folded using Tempo2. VERITAS events recorded prior to the launch of Fermi are folded using a timing solution derived from XMM-Newton observations of the Geminga pulsar (Gotthelf, 2014). VERITAS events recorded after the launch of Fermi are folded using the Fermi-LAT timing solution described in Section 3.1. The value of the timing parameter TZRMJD in the XMM-Newton model is adjusted to ensure the definition of phase zero is consistent between the two timing solutions.
VERITAS events that fall within the P1 and P2 phase gates are counted as signal-plus-background events, with background-only events selected from the phase region [0.7 - 1.0]444We note that, in this framework, VERITAS is not sensitive to the absolute flux level of the Geminga pulsar but to the difference in the flux level between the peak phase regions and the chosen background phase region. In contrast, the likelihood fitting employed in the Fermi-LAT analysis is sensitive to constant emission components. The Geminga pulsar flux above 100 MeV in the 0.7 to 1.0 phase range is 10% of the flux level measured during the peak phases (Abdo et al., 2010b), thus any constant emission component is constrained to be at or below this level. Therefore any mismatch between the Fermi-LAT and VERITAS flux scales arising from the difference in background-estimation methods is within the systematic uncertainty on the absolute flux scale of both instruments.. In addition, an H-Test for periodicity (de Jager et al., 1989) is also performed on the VERITAS events. All steps in the VERITAS analysis chain are cross checked and verified with an independent analysis pipeline555Both analysis pipelines were used for the Crab pulsar data analysis presented in Aliu et al. (2011).. Due to the method of background estimation, the VERITAS analysis presented here is not sensitive to unpulsed gamma-ray emission that might originate from the pulsar magnetosphere or the pulsar wind nebula. An analysis tuned for this type of unpulsed and possibly spatially extended emission is ongoing and will be presented in a future publication.
4. Results
4.1. Light curve
Our results from the analysis of 5.2 years of Fermi-LAT data (see Figure 1) are consistent with those previously reported by Abdo et al. (2010b), Saz Parkinson et al. (2012) and Ackermann et al. (2013). The light curve clearly evolves with energy, with the P2 peak remaining visible at energies above 10 GeV, while the P1 peak and the “bridge” are diminished. Above 100 GeV, there is no evidence for pulsed emission. The VERITAS phase data plotted in Figure 1c have an H-Test value of 1.8, which has a probability of randomly occurring equal to 0.49. A -fit of the binned phase data for constant counts has a /n.d.f value of 45.95/39 and a fit probability of 0.2, indicating that the phase distribution is entirely consistent with a random distribution.
4.2. Spectrum
The spectral analysis of 5.2 years of Fermi-LAT data (see Figure 2) are consistent with those previously reported by the Fermi-LAT team (Abdo et al., 2010b, 2013). The phase-averaged SED, and the SEDs for P1 and P2, are all well described by power laws with spectral breaks occurring between 1.8 and 2.8 GeV (see Table 1 for the best-fit values returned from the maximum-likelihood analysis). Above the break, the SED data points lie above the best-fit exponential cut-off function derived from the likelihood analysis and appear more compatible with a pure power-law function, as was previously noted by Lyutikov (2012) (see the dashed lines in Figure 2). The last bin in the P1 SED with a significant detection (likelihood test statistic 12) is between 10 GeV and 17 GeV, while the P2 and phase-averaged SEDs have significant flux detected up to 56 GeV. We report upper limits on the Geminga flux at the 1% Crab Nebula level from the Fermi-LAT data in the 50-100 GeV energy range.
In the VERITAS data above 100 GeV, the number of events falling in the P1 and P2 signal regions is fully consistent with background only (see Table 2). Using the method of Helene (1983), the upper limit on the number of excess counts at the 95% confidence level is calculated. This upper limit divided by the duration of the observation and effective area of VERITAS yields the upper limit on the integral flux from the Geminga pulsar. For the integral flux upper limit calculation, a power law with a spectral index of 3.8 is assumed, which is the same index value measured by VERITAS in the Crab pulsar above 100 GeV (Aliu et al., 2011). The resulting 95% confidence level upper limits are 4.0 s-1 cm-2 and 1.7 s-1 cm-2 on the integrated flux above 135 GeV666While this VERITAS analysis is sensitive to photons above 100 GeV in a search for pulsations, the threshold for spectral analysis is 135 GeV, and therefore upper limits are quoted above this energy. for P1 and P2, respectively. Above 550 GeV, the 95% confidence level upper limits are 5.1 s-1 cm-2 and 3.9 s-1 cm-2 for P1 and P2, respectively. The corresponding energy fluxes, expressed in erg s-1 cm-2, are plotted in Figure 2.
| Peak | 100 MeV100 GeV | 10 GeV100 GeV | |||
|---|---|---|---|---|---|
| [cm-2 | [cm-2 | ||||
| s-1MeV-1] | [GeV] | s-1MeV-1] | |||
| P1 | 3.600.04 | 1.270.01 | 1.870.03 | 0.270.22 | 5.440.92 |
| P2 | 3.720.02 | 1.030.10 | 2.780.04 | 2.510.56 | 5.130.24 |
| Phase-averaged | 22.600.07 | 1.230.01 | 2.330.02 | 5.831.02 | 5.370.19 |
| Peak | #Signal | #Background | #Scaled Background | #Excess | Significance | |
|---|---|---|---|---|---|---|
| P1 | 284 | 1578 | 0.176 | 278.9 | 5.0 | 0.28 |
| P2 | 211 | 1578 | 0.141 | 223.7 | -12.7 | -0.80 |
| P1P2 | 495 | 1578 | 0.318 | 502.6 | -7.6 | -0.29 |
5. Discussion and Conclusion
Following a 71.6 hour exposure, we observe no significant pulsed emission from the Geminga pulsar above 100 GeV. The VERITAS 95% confidence level integral flux limits on the emission from the P1 and P2 phase ranges limit any putative hard emission component above 135 GeV to be at or below the 0.25% Crab Nebula level. These limits represent the most constraining limits set to date on the gamma-ray emission from the pulsar in this energy regime, surpassing previous limits by over an order of magnitude. The spectral data points derived from the analysis of 5.2 years of Fermi-LAT observations are compatible with a power law up to the break energy, but fall more slowly than what would be expected from a simple exponential cut-off. It can be shown that the rounder, sub-exponential shape, seen above the break in the phase-averaged SED, can be reproduced by a superposition of several exponential cut-off functions with different break energy (Abdo et al., 2010a; Leung et al., 2014). Such a shape is expected in multizone curvature-radiation models, when multiple acceleration regions with different break energies combine to produce the observed emission. Only at energies sufficiently above the maximum break energy will the emission clearly fall exponentially.
Non-exponentially-suppressed emission above the GeV break energy, expected in inverse-Compton emission pulsar models, has yet to be conclusively observed with high significance in any pulsar other than the Crab pulsar. In Geminga above 10 GeV, we see that pure power laws with indices between 5.1 and 5.5 are compatible with the differential photon flux points and predict a level of emission below the VERITAS limits (see Table 1 and Figure 2 for more details). Similar results were found by Lyutikov (2012). A cursory inspection of the Vela SED in Leung et al. (2014) suggests that a power law with an index of 2.4 (4.4 for the differential photon flux spectrum) is compatible with the data points between 10 and 100 GeV, though the authors show the SED is well fit by a multizone curvature emission model. Given this is the case for the two brightest gamma-ray pulsars, and given the low fluxes from most pulsars above a few tens of GeV777Only 4 of the 117 pulsars described in the second Fermi-LAT catalog of gamma-ray pulsars (Abdo et al., 2013) have a measured flux point above 30 GeV with an average flux in the 30-50 GeV range of 7.6 s-1 cm-2. For the remaining pulsars undetected in this energy range, the average 95% confidence level flux upper limit is 4.9 s-1 cm-2., we conclude that power-law-type emission cannot be distinguished from the rounded exponential cut-off shape expected in multizone curvature-emission models with the available spectral data.
In the case of the Crab pulsar, and in several other cases where the GeV break energy requires an acceleration efficiency close to or exceeding unity (Lyutikov et al., 2012), canonical curvature-radiation scenarios at the light cylinder are stressed. In the case of Geminga, applying Formula 1 from Lyutikov (2012) and using the Geminga parameters from the ATNF Pulsar Catalog (Manchester et al., 1995), we find that the maximal break energy for curvature radiation from the outer magnetosphere is = 2.53 GeV. The phase-averaged break-energy value reported here, 2.330.02 GeV, is consistent with this . The P2 break energy, 2.780.04 GeV, does exceed the maximal curvature break energy within the adopted outer-magnetospheric emission framework. We note, however, that is a function of the assumed neutron-star radius and surface -field strength to the powers of and , respectively. Changes in either of these parameters at the 5-10% level bring the derived into agreement with our measured value. However, the measured break energies in Geminga do require the acceleration efficiency to approach unity at the light cylinder in this radiation-reaction-limited curvature-emission framework. This, in addition to the compatibility of the power law shape with the high energy data, positions Geminga as a viable candidate for inverse-Compton emission. Assuming the Cherenkov Telescope Array (CTA) performs as expected (Bernlöhr et al., 2013), future observations with CTA should be able to firmly detect the steep power law extrapolated from the Fermi-LAT data at energies above 100 GeV in roughly one hundred hours.
References
- Abdo et al. (2007) Abdo, A. A., Allen, B., Berley, D., et al. 2007, ApJ, 664, L91
- Abdo et al. (2009) Abdo, A. A., Allen, B. T., Aune, T., et al. 2009, ApJ, 700, L127
- Abdo et al. (2010a) Abdo, A. A., Ackermann, M., Ajello, M., et al. 2010, ApJ, 713, 154
- Abdo et al. (2010b) Abdo, A. A., Ackermann, M., Ajello, M., et al. 2010, ApJ, 720, 272
- Abdo et al. (2013) Abdo, A. A., Ajello, M., Allafort, A., et al. 2013, ApJS, 208, 17
- Ackermann et al. (2013) Ackermann, M., Ajello, M., Allafort, A., et al. 2013, ApJS, 209, 34
- Aharonian et al. (1999) Aharonian, F., Akhperjanian, A. G., Barrio, J. A., et al. 1999, A&A, 346, 913
- Aharonian et al. (2006) Aharonian, F., Akhperjanian, A. G., Bazer-Bachi, A. R., et al. 2006, A&A, 448, L19
- Aharonian et al. (2012) Aharonian, F. A., Bogovalov, S. V., & Khangulyan, D. 2012, Nature, 482, 507
- Akerlof et al. (1993) Akerlof, C. W., Breslin, A. C., Cawley, M. F., et al. 1993, A&A, 274, L17
- Albert et al. (2008) Albert, J., Aliu, E., Anderhub, H., et al. 2008, ApJ, 674, 1037
- Aleksić et al. (2011) Aleksić, J., Alvarez, E. A., Antonelli, L. A., et al. 2011, ApJ, 742, 43
- Aleksić et al. (2012) Aleksić, J., Alvarez, E. A., Antonelli, L. A., et al. 2012, A&A, 540, A69
- Aliu et al. (2011) Aliu, E., The VERITAS Collaboration et al. 2011, Science, 334, 69
- Atwood et al. (2009) Atwood, W. B., Abdo, A. A., Ackermann, M., et al. 2009, ApJ, 697, 1071
- Amenomori et al. (2010) Amenomori, M., Bi, X. J., Chen, D., et al. 2010, ApJ, 709, L6
- Bednarek (2012) Bednarek, W. 2012, MNRAS, 424, 2079
- Bennett et al. (1977) Bennett, K., Lichti, G. G., Bignami, G. F., et al. 1977, A&A, 56, 469
- Bernlöhr et al. (2013) Bernlöhr, K., Barnacka, A., Becherini, Y., et al. 2013, Astroparticle Physics, 43, 171
- Bertsch et al. (1992) Bertsch, D. L., Brazier, K. T. S., Fichtel, C. E., et al. 1992, Nature, 357, 306
- Bignami & Caraveo (1992) Bignami, G. F., & Caraveo, P. A. 1992, Nature, 357, 287
- Bignami & Caraveo (1996) Bignami, G. F., & Caraveo, P. A. 1996, ARA&A, 34, 331
- Bowden et al. (1993) Bowden, C. C. G., Bradbury, S. M., Chadwick, P. M., et al. 1993, Journal of Physics G Nuclear Physics, 19, L29
- Caraveo et al. (1996) Caraveo, P. A., Bignami, G. F., Mignani, R., & Taff, L. G. 1996, ApJ, 461, L91
- Caraveo et al. (2003) Caraveo, P. A., Bignami, G. F., De Luca, A., et al. 2003, Science, 301, 1345
- Caraveo et al. (2004) Caraveo, P. A., De Luca, A., Mereghetti, S., Pellizzoni, A., & Bignami, G. F. 2004, Science, 305, 376
- Caraveo (2014) Caraveo, P. A. 2014, ARA&A, 52, 211
- Davies & Cotton (1957) Davies, J. M., & Cotton, E. S. 1957, Solar Energy, 1, 16
- Du et al. (2012) Du, Y. J., Qiao, G. J., & Wang, W. 2012, ApJ, 748, 84
- Faherty et al. (2007) Faherty, J., Walter, F. M., & Anderson, J. 2007, Ap&SS, 308, 225
- Fichtel et al. (1975) Fichtel, C. E., Hartman, R. C., Kniffen, D. A., et al. 1975, ApJ, 198, 163
- Fierro et al. (1998) Fierro, J. M., Michelson, P. F., Nolan, P. L., & Thompson, D. J. 1998, ApJ, 494, 734
- Fomin et al. (1994) Fomin, V. P., Stepanian, A. A., Lamb, R. C., et al. 1994, Astroparticle Physics, 2, 137
- Gotthelf (2014) Gotthelf, E. 2014, Private Communication.
- Halpern & Holt (1992) Halpern, J. P., & Holt, S. S. 1992, Nature, 357, 222
- Helene (1983) Helene, O. 1983, Nuclear Instruments and Methods in Physics Research, 212, 319
- Hillas (1985) Hillas, A. M. 1985, 19th International Cosmic Ray Conference, La Jolla, 3, 445
- Hobbs et al. (2006) Hobbs, G. B., Edwards, R. T., & Manchester, R. N. 2006, MNRAS, 369, 655
- Hofmann et al. (1999) Hofmann, W., Jung, I., Konopelko, A., et al. 1999, Astroparticle Physics, 12, 135
- Holder et al. (2006) Holder, J., Atkins, R. W., Badran, H. M., et al. 2006, Astroparticle Physics, 25, 391
- de Jager et al. (1989) de Jager, O. C., Raubenheimer, B. C., & Swanepoel, J. W. H. 1989, A&A, 221, 180
- Kargaltsev et al. (2005) Kargaltsev, O. Y., Pavlov, G. G., Zavlin, V. E., & Romani, R. W. 2005, ApJ, 625, 307
- Kerr et al. (2014) Kerr, M., et al. 2014, in prep.
- Kieda et al. (2011) Kieda, D., et al. 2011, 32nd International Cosmic Ray Conference, Beijing, 9, 14
- Krawczynski et al. (2006) Krawczynski, H., Carter-Lewis, D. A., Duke, C., et al. 2006, Astroparticle Physics, 25, 380
- Leung et al. (2014) Leung, G. C. K., Takata, J., Ng, C. W., et al. 2014, arXiv:1410.5208
- Li & Ma (1983) Li, T.-P., & Ma, Y.-Q. 1983, ApJ, 272, 317
- Lyutikov et al. (2012) Lyutikov, M., Otte, N., & McCann, A. 2012, ApJ, 754,
- Lyutikov (2012) Lyutikov, M. 2012, ApJ, 757, 88
- Manchester et al. (1995) Manchester, R. N., Hobbs, G. B., Teoh, A., & Hobbs, M. 2005, AJ, 129, 1993
- Mattox et al. (1992) Mattox, J. R., Bertsch, D. L., Fichtel, C. E., et al. 1992, ApJ, 401, L23
- Mayer-Hasselwander et al. (1994) Mayer-Hasselwander, H. A., Bertsch, D. L., Brazier, K. T. S., et al. 1994, ApJ, 421, 276
- McLaughlin et al. (1999) McLaughlin, M. A., Cordes, J. M., Hankins, T. H., & Moffett, D. A. 1999, ApJ, 512, 929
- Neshpor et al. (2001) Neshpor, Y. I., Stepanyan, A. A., Zyskin, Y. L., et al. 2001, Astronomy Letters, 27, 228
- Nolan et al. (2012) Nolan, P. L., Abdo, A. A., Ackermann, M., et al. 2012, ApJS, 199, 31
- Orr et al. (2011) Orr, M., et al. 2011, 32nd International Cosmic Ray Conference, Beijing, 8, 121
- Pellizzoni et al. (2009) Pellizzoni, A., Pilia, M., Possenti, A., et al. 2009, ApJ, 691, 1618
- Pétri (2012) Pétri, J. 2012, MNRAS, 424, 2023
- Ramachandran et al. (1998) Ramachandran, R., Deshpande, A. A., & Indrani, C. 1998, A&A, 339, 787
- Saz Parkinson et al. (2012) Saz Parkinson, P. M., & Fermi-LAT Collaboration 2012, American Institute of Physics Conference Series, 1505, 293
- Shearer et al. (1998) Shearer, A., Golden, A., Harfst, S., et al. 1998, A&A, 335, L21
- Singh et al. (2009) Singh, B. B., Chitnis, V. R., Bose, D., et al. 2009, Astroparticle Physics, 32, 120
- Thompson et al. (2005) Thompson, D. J., Bertsch, D. L., & O’Neal, R. H., Jr. 2005, ApJS, 157, 324
- Vishwanath et al. (1993) Vishwanath, P. R., Sathyanarayana, G. P., Ramanamurthy, P. V., & Bhat, P. N. 1993, A&A, 267, L5