On the asymmetry of the OH ro-vibrational lines in HD 100546⋆
Abstract
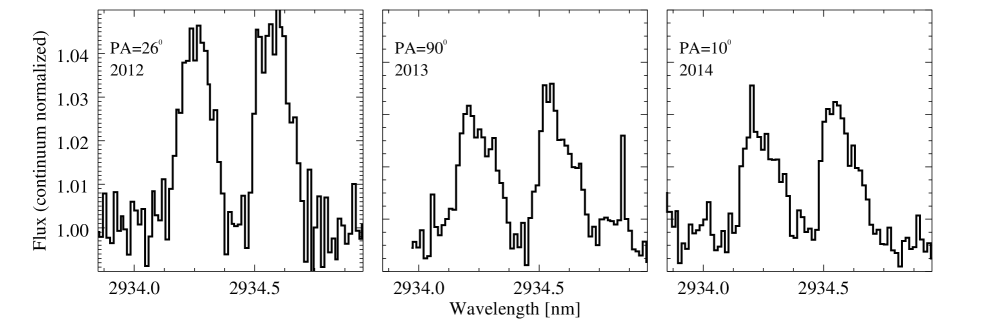
We present multi-epoch high-spectral resolution observations with VLT/CRIRES of the OH doublet P4.5 (1+,1-) (2.934 µm) towards the protoplanetary disk around HD 100546. The OH doublet is detected at all epochs and is spectrally resolved while nearby H2O lines remains undetected. The OH line velocity profile is different in the three datasets: in the first epoch (April 2012, PA=26∘) the OH lines are symmetric and line broadening is consistent with the gas being in Keplerian rotation around the star. No OH emission is detected within a radius of au from the star: the line emitting region is similar in size and extent to that of the CO ro-vibrational lines. In the other two epochs (March 2013 and April 2014, PA= and 10∘, respectively) the OH lines appear asymmetric and fainter compared to April 2012. We investigate the origin of these line asymmetries which were taken by previous authors as evidence for tidal interaction between an (unseen) massive planet and the disk. We show that the observed asymmetries can be fully explained by a misalignment of the slit of order 004-020 with respect to the stellar position. The disk is spatially resolved and the slit misalignment is likely caused by the extended dust emission which is brighter than the stellar photosphere at near-infrared wavelengths which is the wavelength used for the pointing. This can cause the photo-center of HD 100546 to be mis-aligned with the stellar position at near-infrared wavelengths.
Subject headings:
Protoplanetary disks1. Introduction
HD 100546 is a 2.4 pre-main-sequence star (PMSs) surrounded by a gas- and dust-rich protoplanetary disk. The inner region of the disk (au) is devoid of molecular gas (van der Plas et al., 2009; Brittain et al., 2009) while atomic gas is still present in this gap (Acke & van den Ancker, 2006). Emission by small dust grains is detected in the vicinity of the star ( Benisty et al., 2010) while no small grains are detected outwards up to au from the star (e.g., Bouwman et al., 2003; Tatulli et al., 2011; Panić et al., 2014). The lack of molecular gas is likely due to photo-dissociation of molecules which, given the reduced amount of small dust grains, are not shielded from the dissociative radiation of the star (e.g. Bruderer, 2013). Liskowsky et al. (2012) and Brittain et al. (2014) detect OH ro-vibrational emission (doublets P10.5 and P9.5) toward this source using PHOENIX at the Gemini South telescope. The OH lines show a highly asymmetric velocity profile deviating from the characteristic symmetric double-peaked Keplerian profile: the blue-shifted peak is stronger than the red-shifted one. Liskowsky et al. (2012) and Brittain et al. (2014) interpret the asymmetric OH profile as due to gas emission in a highly eccentric orbit () from the tidal interaction between a massive planet and the disk. Theoretical calculations (e.g., Lubow, 1991) and hydro-dynamical simulations (e.g. Kley & Dirksen, 2006) show indeed that a stellar companion or massive planet is able to perturb the orbital motion of the gas and this produces an asymmetric velocity profile of the molecular gas orbiting around the star (Regály et al., 2010). Observationally, this effect was detected, e.g., toward the protoplanetary disk around V380 Ori (Fedele et al., 2011), where the OH P4.5 line profile is asymmetric. The origin of this asymmetry is most likely the stellar companion of V380 Ori which perturbs the gas motion in the inner disk.
In the case of HD 100546 however, no stellar companion has been detected so far inside the dust gap (e.g. Grady et al., 2005), and the disk eccentricity must be caused by a massive (unseen) planetary companion inside the dust gap. No line asymmetry has been reported for the CO ro-vibrational lines (which trace similar radial distances as the OH ro- vibrational lines) toward the same disk by several authors (van der Plas et al., 2009; Brittain et al., 2009; Goto et al., 2012; Liskowsky et al., 2012; Brittain et al., 2013). Hein Bertelsen et al. (2014) re-observed HD 100546 with CRIRES and they found that the line profile of CO ro- vibrational transitions vary (become asymmetric) with the slit position angle (PA) and with time (timescale of 2 nights). According to Hein Bertelsen et al. (2014) , this is due to a small ( 01) offset of the slit with respect to the barycenter of the system; note that at a distance of 97 pc (van Leeuwen, 2007), the inner disk of HD 100546 is spatially resolved with an 8-m class telescope at near-infrared wavelengths (e.g. Goto et al., 2012).
This paper presents multi-epoch high-spectral resolution observations with VLT /CRIRES of the OH ro-vibrational lines P4.5 (1+,1-) at 2.934 µm towards HD 100546. The goal is to investigate the origin of the asymmetry in the OH ro-vibrational lines as reported by Liskowsky et al. (2012); Brittain et al. (2014).
2. Observations and data reduction
HD 100546 was observed in the L-band at three different epochs with VLT/ CRIRES spanning two years (April 2012, March 2013, April 2014). Each observation of HD 100546 is followed by that of a standard star of early spectral type for the removal of telluric absorption features. The 2012 and 2014 spectra were taken with a 02 slit width and are supported by the CRIRES adaptive optics system using the target as AO wavefront sensor and slit viewer guide star. The slit was oriented along the parallactic angle to minimize slit losses due to atmospheric refraction. The spectral resolution, measured on the OH sky emission lines is 3.5 km s-1and the full-width-half-maximum (FWHM) of the target is 017. The FWHM of the telluric standard star is 013, thus HD 100546 is spatially resolved. The 2013 spectrum (also presented in Brittain et al. 2013) was taken with a slit width of 04 at a position angle of PA= (different from the parallactic angle) without adaptive optics. In this case the spectral resolution is 5.3 km s-1 and the FWHM (the seeing) is 065, thus the spectrum is affected by slit losses. At all epochs the centering of the target in the slit is done through the slit-viewer camera in the Ks band. The observation log is reported in Table 1.
The spectra are reduced with the CRIRES data reduction pipeline using a standard procedure: bad-pixel and cosmic rays subtraction, flat-fielding, wavelength calibration (using the sky emission lines as reference) and spectrum extraction. The telluric absorption lines are removed by dividing the spectrum of HD 100546 with that of the telluric standard after applying small correction to account for the slightly different optical depth of the telluric lines between the two spectra.
2.1. Pointing and guiding accuracy
For CRIRES, the centering of point-sources within the slit is known to be accurate to a small fraction of the slit width: according to the CRIRES User Manual111http://www.eso.org/sci/facilities/paranal/instruments/crires/doc.html the pointing and guiding accuracy is, on average of the order of 0.2 pixels (for the 02 slit with adaptive optics) which corresponds to 0017 at a pixel scale of 0086. We estimated the pointing accuracy directly from the offset applied to the telescope during the guiding (log files provided by J. Smoker and the ESO user support department). We find an accuracy of 003 for the two AO-fed observations and 014 for the no-AO one. Thus, as expected, the pointing and guiding accuracy is more accurate in the AO-supported observations.
2.2. Flux calibration
The telluric standard stars are also used to calibrate the continuum flux of HD 100546 in a region free of telluric absorptions. The spectra extracted from the CRIRES data reduction pipeline are divided by the DIT of the exposure (Table 1). For each telluric standard we estimate the absolute spectrophotometric flux () by scaling the corresponding Kurucz stellar atmosphere model to the 2MASS J, H and K magnitude of the star. The transmission function (instrument + atmosphere) is given by the ratio of the observed (in units of ADU/s) and absolute flux ()
| (1) |
The science spectrum is then flux calibrated as follow:
| (2) |
where is the observed flux after normalization for exposure time (ADU/s). The continuum flux of HD 100546 is then measured at nm, next to the OH doublet, in a region free on telluric absorption. Results are listed in Table 2 for the three epochs.
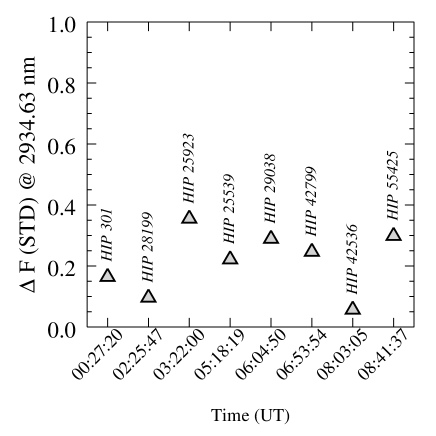
The accuracy of the method was tested using the CRIRES spectra of telluric standard stars observed on a different night (Dec 5th 2008). Multiple (9) standard stars were observed during the night allowing us to estimate the validity and precision of the flux calibration method. The spectra are presented in Fedele et al. (2011).
Following the same procedure, the absolute flux of each star is estimated by scaling the Kurucz atmosphere model to the J,H and K magnitudes (). The transmission function is measured as in eq. 1 using one of the 9 star. The remaining 8 stars are flux calibrated using eq. 2, yielding . For each star, we measure the flux difference at nm as the difference:
| (3) |
The result is shown in Figure 2 for the different standard stars as a function of observing time (the airmass varies between 1.03 and 1.46). The flux difference ranges between % with an average value of 20%. Thus the flux calibration method of the CRIRES spectra performed using the telluric standard stars has, on average, an accuracy of 20%.
| Date | Time | Slit | Slit | PSF | DIT | NDIT | STD | PSF (STD) | ||
|---|---|---|---|---|---|---|---|---|---|---|
| [UT] | [nm] | Width [″] | PA [∘] | [″] | [km s-1] | [s] | [″] | |||
| 2012-04-02 | 04:54:05 | 2911.5 | 02 | 26∘ | 017$\ddagger$$\ddagger$Adaptive optics supported. PA equal to the parallactic angle | 3.5 | 30 | 2 | HIP 57936 | 0.14 |
| 2013-03-18 | 23:38:37 | 2947.0 | 04 | 90∘ | 065 | 5.3 | 30 | 4 | HIP 60718 | 0.63 |
| 2014-04-17 | 03:05:23 | 2950.0 | 02 | 10∘ | 017$\ddagger$$\ddagger$Adaptive optics supported. PA equal to the parallactic angle | 3.5 | 60 | 1 | HIP 57851 | 0.15 |
| Epoch | Fν | Reference | |
|---|---|---|---|
| [Jy] | [micron] | ||
| 1989-92 | 5.5 | 3.7 | Malfait et al. (1998a, L-band photometry) |
| 1998 | 5.44 0.06 | 2.934 | Malfait et al. (1998b, ISO spectrum) |
| 2010 | 6.2 0.6 | 3.353 | WISE W1 photometry |
| 2012 | 4.5 1.0 | 2.934 | this work |
| 2013 | 5.0 1.0 | 2.934 | this work |
| 2014 | 5.0 1.0 | 2.934 | this work |
| Epoch | W(OH)$\star$$\star$The value of equivalent width is the average of the two transitions and the error is given by the difference of the two. | F(OH) |
|---|---|---|
| [µm] | [] | |
| 2012-04-02 | 11.1 0.6$\dagger$$\dagger$The error does not include the 20% flux calibration uncertainty | |
| 2013-03-18 | 7.4 0.5$\dagger$$\dagger$The error does not include the 20% flux calibration uncertainty | |
| 2014-04-17 | 6.7 0.5$\dagger$$\dagger$The error does not include the 20% flux calibration uncertainty |
3. Results
3.1. Line detection
The OH P4.5 doublet is detected in all three epochs while H2O is undetected confirming the trend of high OH/H2O abundance ratio in the atmosphere of the inner disk of Herbig AeBe systems (Mandell et al., 2008; Pontoppidan et al., 2010; Fedele et al., 2011). Figure 1 shows the spectrum of the OH doublet at the three epochs. In all cases the lines are spectrally resolved. In April 2012 the two OH lines are symmetric contrary to what found by Liskowsky et al. (2012) in their PHOENIX spectrum (from 2010). In the other two epochs, the lines are asymmetric.
The equivalent width () is measured by integrating over the velocity range between -20 km s-1and +20 km s-1. The values of reported in Table 3 refer to the average value of the two transitions and the error is measured as the difference between the two. The line flux is measured multiplying by the continuum flux next to the line at nm. The equivalent width (hence the line flux) varies considerably among the three epochs with the OH line being the strongest in 2012 when the velocity profile is symmetric.
3.2. Continuum emission
The continuum flux next to the line is constant among the three epochs (Table 3). Multi-epoch 3 micron flux measurements of HD 100546 are listed in Table 2. Our estimates are in good agreement with the ISO spectrum (e.g., Malfait et al., 1998b) which shows a flux density of 5.45 Jy ( 0.06 Jy) at the same reference wavelength (nm). The L-band magnitude reported by Malfait et al. (1998a) is 4.15 mag (no error given) which corresponds to a flux density of 5.5 Jy at µm(adopting a zero magnitude star flux FJy, Le Bertre & Winters, 1998). The WISE W1 magnitude is 4.2 0.1 mag Cutri & et al. (2012) which yields FJy (after color correction using the ISO spectrum) at micron. We note that the WISE photometry is likely affected by the strong PAH feature between 3-3.5 µm (see e.g., Malfait et al., 1998b). Indeed, the WISE W1 synthetic photometry computed by convolving the ISO spectrum with the W1 bandbass (Wright et al., 2010) gives a flux density of Fν= 5.75 Jy, closer to the photometric measurement.
In conclusion, our estimate of the continuum flux is in good agreement with the ISO spectrum and with the broad-band photometry measured by (Malfait et al., 1998a) and more recently with WISE. These results do not confirm the 50% decrease of the L-band flux found by Brittain et al. (2013) between 1990 and 2010.
4. Analysis
The following analysis is divided in two parts: first we analyze the OH line to derive the line emitting region and to search for similarities/differences with respect to other gas tracers. Then, we investigate the origin of the asymmetric OH line profiles seen in some but not all datasets.
4.1. OH emitting region
To estimate the line emitting region, we create a synthetic profile assuming a power-law intensity profile222The formalism is described in Fedele et al. (2011).:
| (4) |
where is the distance from the star and is the intensity at the inner radius. Eq. 4 is converted into a line velocity profile: assuming Keplerian rotation the projected velocity is
| (5) |
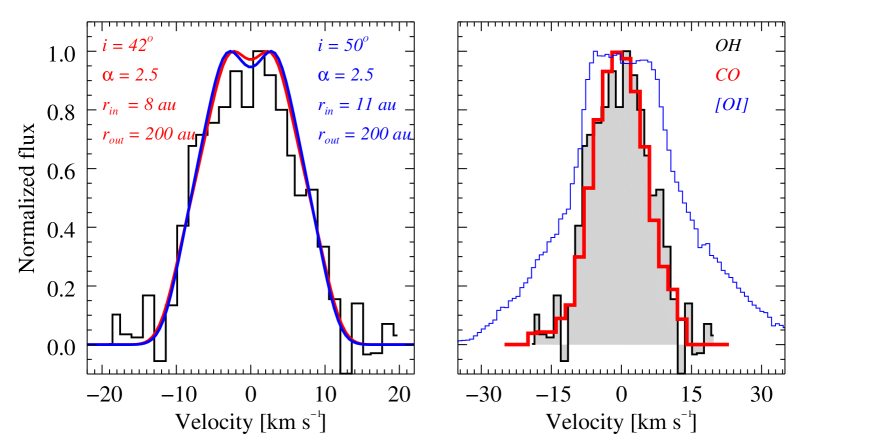
with the disk inclination ( is edge on). The OH temperature is fixed to 1100 K similar to the CO temperature at the inner rim of the disk, au (e.g. Goto et al., 2012; Fedele et al., 2013). This temperature corresponds to a thermal broadening = 1.2 km s-1. The velocity profile is convolved with a velocity width with the instrumental broadening (Table 1).
To find the best fit model, the observed velocity profile is fitted by a synthetic profile. The parameters of the fit are: 1) the power-law index of the intensity , 2) the disk inclination, 3) the inner and 4) outer radius of the OH emitting region. The disk inclination and inner radius are partly degenerate, for this reason we fix the inclination and let the other parameters free. To search for the best fit parameters we create a grid of model line profiles varying (range , step 0.025), (range au, step 0.1 au) and (range au, step 20 au) and we compute the reduced between the observed and model line profile. The set of parameters that best fit the observed profile are found minimizing
| (6) |
with the number of velocity bins in the range between km s-1and km s-1, the number of parameters (), , the model predicted and observed flux at velocity bin and the corresponding uncertainty. The fitting procedure is repeated twice for two different values of the inclination, 42∘ and 50∘, since all inclinations reported in the literature are within this range (Pantin et al., 2000; Augereau et al., 2001; Grady et al., 2001; Liu et al., 2003; Ardila et al., 2007; Panić et al., 2014; Avenhaus et al., 2014). The parameters that best fit the observed profile are listed in Figure 3 together with the best fit models: for the case we find an inner radius of 8 au (), while for the case we find an inner radius of 11 au ().
The lack of high-velocity gas indicates a gap (drop in abundance) of OH gas inside a gap of radius au (depending on the assumed inclination).
4.2. Comparison of CRIRES and PHOENIX OH profile
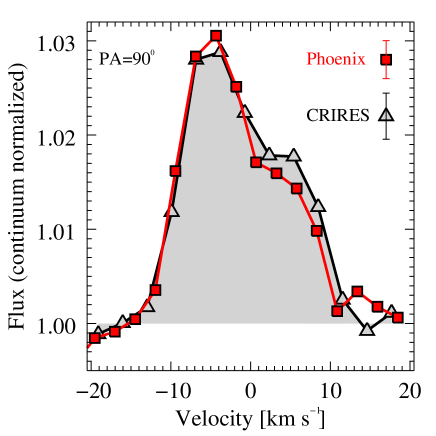
Figure 4 shows a direct comparison of the CRIRES and PHOENIX spectra (presented in Liskowsky et al. 2012) taken with the same slit position angle (90∘ and width (04): to increase the S/N we averaged the two lines of the OH P4.5 doublet (CRIRES), while the PHOENIX spectrum is the average of the four lines detected by Liskowsky et al. (doublets P9.5 and P10.5). Finally, the spectra are binned in wavelength to further increase the S/N. The two spectra are similar. There are however some differences: the peak-to-peak asymmetry appears more pronounced in the PHOENIX spectrum, where the red-shifted component is systematically fainter than in the CRIRES spectra. This difference is significant as it is seen in several (consecutive) spectral bins.
4.3. Comparison to other gas tracers
In this section we compare the velocity profile of the OH P4.5 doublet to that of other gas tracers, namely the CO ro-vibrational lines and the optical forbidden line [O I] 630.0 nm. The median profile of the CO fundamental ro-vibrational transitions (v=1-0, 2-1, 3-2 and 4-3) is shown in Figure 3 (right). These spectra were taken with CRIRES with a spectral resolution of 3 km s-1 (slit width = 02, PA=, PSF=017, March 29th 2010, Hein Bertelsen et al. 2014). The similarity of the velocity profiles of the OH (PA=) and CO ro-vibrational lines and the symmetric profile of CO suggests that these transitions come from a similar radial extent in the disk. The inner radius of the OH emitting region found here is in good agreement with from previous estimates: (van der Plas et al., 2009, ), (Brittain et al., 2009, ).
The spectrum of the [O I] 630.0 nm line is also shown in Figure 3 (VLT/UVES, PA = 15∘, slit width = 03, Acke & van den Ancker 2006). The oxygen line extends to high velocity indicating the presence of atomic gas inside the disk gap. The low-velocity part of the [O I] line appears slightly asymmetric and both the asymmetry and the line intensity vary with time according to Acke & van den Ancker (2006). The asymmetry in the [O I] line is however much less pronounced than that of the OH P4.5 lines at slit PA = and . Moreover, the temporal changes reported by Acke & van den Ancker (2006) are not reconcilable with the changes in the OH line as the OH asymmetry is only observed in the blue-shifted peak, contrary to the [O I] where the asymmetry is observed also in the red-shifted peak. For further discussion see Sec. 5.
4.4. Line asymmetry
As shown by Hein Bertelsen et al. (2014), in the case of spatially resolved observations, a slight offset can induce slit losses in the CO ro-vibrational lines and produce an asymmetric line profile. Given the similar size and extent, also the OH ro-vibrational lines may be affected by the same process. The different flux of the OH line between the three epochs can be the consequence of slit losses. If this is the case the 2012 spectrum, showing the higher line flux, is the less affected one. To investigate this, we create a synthetic disk image using a geometrical model where the OH line is assumed to emerge from either the surface or an inner wall of a disk in Keplerian rotation. The intensity on the surface and the wall are taken to be the same. Figure 5 shows the synthetic velocity map. The figure also shows the width and orientation of the three CRIRES OH spectra. The synthetic disk image is convolved with a 2-D Gaussian profile to mimic the point-spread-function (PSF) of the CRIRES spectra. The FWHM of the convolution is given by the actual size of the target in the spatial direction of the spectrum (Table 1): this corresponds to 017 for the spectra taken with the 02 slit ( PA = 26∘ and 10∘) and 065 in the case of the 04 slit (PA = 90∘). The synthetic line profiles are created by filtering the convolved disk images with the corresponding slit width and position angle. The effect of a slit misalignment, is reproduced by an offset between the slit and the stellar position, in the direction perpendicular to the slit PA. The sign convention for the offset is the same as in Hein Bertelsen et al. (2014). Finally, the synthetic line profiles are convolved with the corresponding spectral resolution: 3.5 km s-1 and 5.3 km s-1 for the 02 and 04 slit width, respectively (Table 1).
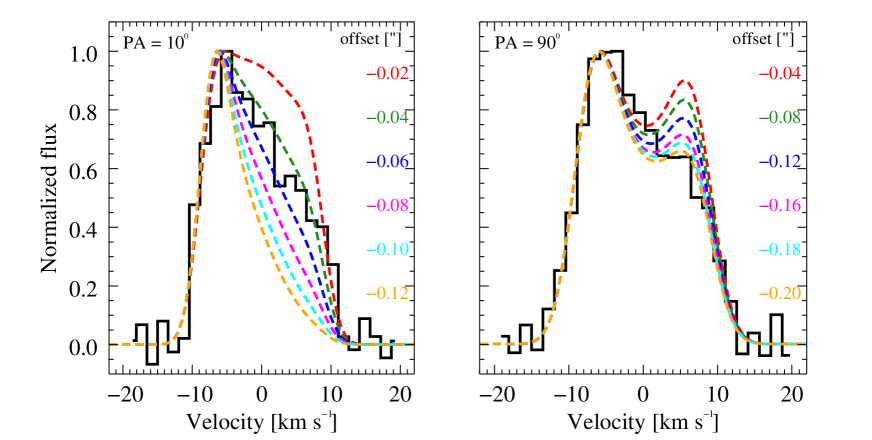
Figure 6 shows the synthetic spectra for different offsets in the cases of PA=10∘ and PA=90∘: the offset produces an asymmetry in the line profile, and the flux ratio between the blue- and red- shifted component of the OH line increases with the offset. For a given offset, the asymmetry is more pronounced in the narrow slit spectrum. This is due to the different size of the PSF. The spectra are normalized although the offset induces slit losses which results in a fainter line flux as the offset increases. A small offset (between -004 and -006) is enough to reproduce the observed profile at PA=10∘, while a larger offset (between -016 and -020) is needed for the PA= spectrum.
5. Discussion
The analysis presented here demonstrates that the asymmetric profile of the OH ro-vibrational lines are consistent with an offset between the slit and the stellar position. Our interpretation is that the spectra which are mostly affected by the slit mis-alignment are the PA=10∘ and PA=90∘ (both CRIRES and PHOENIX). The PA=26∘ spectrum shows indeed no clear evidence of asymmetry in the line profile which appears instead top- flat as we would expect in the case of Keplerian rotation. Moreover, in the same spectrum the line is much stronger (almost double, Table 1) than in the other spectra. This finding suggest that the PA=10∘ and PA=90∘ spectra can be affected by slit losses which is a natural consequence of the slit mis-alignment. The small offsets estimated in the previous section produce negligible or no change of the continuum flux but considerable variation of the OH line velocity profile.
5.1. Origin of the OH line asymmetry
If the asymmetric profile of the OH line is due to an offset of the slit, this must be caused by the source itself as it is observed with two different instruments (CRIRES and PHOENIX). A possible explanation is that the misalignment of the slit is caused by a non homogenous illumination: we infer that this is due to the finite size of the disk inner wall at au from the star. Because of the disk inclination () the inner wall at 10-14 au produces an asymmetric image in the sky (see Figure 5). Interestingly, deviation from axis-symmetric emission is detected in mid-infrared interferometric observations (Panić et al., 2014). Given the higher intensity of the disk wall over the stellar photosphere at wavelength µm, the peak of the continuum intensity at these wavelengths does not coincide with the stellar position. Since the telescope pointing is automatically adjusted toward the peak of the emission in the Ks band in the slit viewer camera333Note that the star itself is occulted by the slit in the SV camera., this can affect the centering of the target inside the slit, inducing an offset between the center of the slit and the stellar position. The misalignment of the slit should be maximum when the slit PA is parallel to the disk major axis (, e.g., Pantin et al., 2000; Augereau et al., 2001; Grady et al., 2001; Ardila et al., 2007; Panić et al., 2014; Avenhaus et al., 2014) and it should be minimized when the slit is oriented along the disk minor axis. This is consistent with the different offset measured in the PA= and PA = spectra and with the symmetric profile seen in the PA= (closer to the disk minor axis) spectrum.
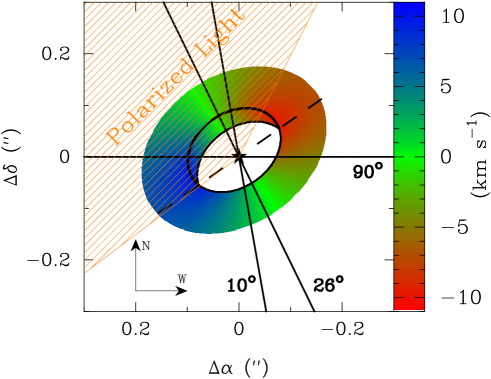
Our interpretation is supported by the polarimetric differential imaging (PDI) of HD 100546 performed by Quanz et al. (2011) and Avenhaus et al. (2014): the authors detect a brightness asymmetry in polarized light with the North-East part (far side) of the disk being brighter than the Southern-West one (near side). The azimuthal directions of this asymmetry is shown in Fig. 5.
We further note that our interpretation is in good agreement with near-infrared interferometric observations (Benisty et al., 2010; Tatulli et al., 2011): the K-band VLTI/ AMBER visibility at short baselines can only be fitted by a model which includes spatially extended emission, consistent with the disk inner wall at au (Tatulli et al., 2011).
5.2. Disk wall or clumps
There are other possible scenarios that can induce a slit offset: any bright source (brighter than the star in the K-band) within 02 from the star could induce a mis-alignment of the slit during the acquisition of the spectrum. One possibility is a stellar companion, there are however no detections of any bright companion within 02 to date. Another possibility is inhomogeneous dust continuum emission from the disk. Recent polarimetric observations by Avenhaus et al. (2014) rule out the presence of a disk hole at PA= claimed by Quanz et al. (2011) while they detect two bright spots at PA and PA with the latter being brighter than the first one. We warn however that the spots seen in polarized light do not necessarily imply the existence of bright spots in the total (unpolarized) K-band flux. The results of Quanz et al. (2011) and Avenhaus et al. (2014) are instead consistent with the overall geometry of the disk where the North-East side (brighter in scattered light) is facing toward us.
5.3. Disk eccentricity
Liskowsky et al. (2012) suggest that the inner disk of HD 100546 is eccentric and the OH distribution is not homogeneous: the authors propose a scenario in which a massive (unseen) planet perturbs the gas dynamics at the distance of the disk inner wall. Brittain et al. (2014) further support this scenario based on the non-variability of the OH line profiles: the OH spectra presented by Brittain et al. (2014) are both taken with the same slit PA (=90∘). As shown in Figure 4 however, the PA= spectra (CRIRES and PHOENIX) do show a slightly different line profile, which cannot be due to disk eccentricity. Moreover, the PA=10∘ and PA=26∘ spectra show drastic variation in line profile and equivalent width.
6. Conclusion
Based on the data collected here and on the performed analysis, the asymmetric profile of the OH ro-vibrational lines toward HD 100546 are consistent with a misalignment of the slit of the order of . We argue that the misalignment results from the finite size of the disk inner wall at au from the star ( at a distance of 97 pc). Thus there is no need to invoke a highly eccentric gas disk, as was done by Liskowsky et al. (2012); Brittain et al. (2014), to explain the asymmetric line profile in HD 100546. The analysis presented in this paper, however, does not exclude the presence of a massive planet/companion inside the disk gap as suggested by several authors (e.g., Bouwman et al., 2003; Acke & van den Ancker, 2006; Mulders et al., 2013).
Facilities: VLT/CRIRES
References
- Acke & van den Ancker (2006) Acke, B., & van den Ancker, M. E. 2006, A&A, 449, 267
- Ardila et al. (2007) Ardila, D. R., Golimowski, D. A., Krist, J. E., Clampin, M., Ford, H. C., & Illingworth, G. D. 2007, ApJ, 665, 512
- Augereau et al. (2001) Augereau, J. C., Lagrange, A. M., Mouillet, D., & Ménard, F. 2001, A&A, 365, 78
- Avenhaus et al. (2014) Avenhaus, H., Quanz, S. P., Meyer, M. R., Brittain, S. D., Carr, J. S., & Najita, J. R. 2014, ApJ, 790, 56
- Benisty et al. (2010) Benisty, M., Tatulli, E., Ménard, F., & Swain, M. R. 2010, A&A, 511, A75
- Bouwman et al. (2003) Bouwman, J., de Koter, A., Dominik, C., & Waters, L. B. F. M. 2003, A&A, 401, 577
- Brittain et al. (2014) Brittain, S. D., Carr, J. S., Najita, J. R., Quanz, S. P., & Meyer, M. R. 2014, ApJ, 791, 136
- Brittain et al. (2009) Brittain, S. D., Najita, J. R., & Carr, J. S. 2009, ApJ, 702, 85
- Brittain et al. (2013) Brittain, S. D., Najita, J. R., Carr, J. S., Liskowsky, J., Troutman, M. R., & Doppmann, G. W. 2013, ApJ, 767, 159
- Bruderer (2013) Bruderer, S. 2013, A&A, 559, A46
- Cutri & et al. (2012) Cutri, R. M., & et al. 2012, VizieR Online Data Catalog, 2311, 0
- Fedele et al. (2013) Fedele, D., Bruderer, S., van Dishoeck, E. F., Hogerheijde, M. R., Panic, O., Brown, J. M., & Henning, T. 2013, ApJ, 776, L3
- Fedele et al. (2011) Fedele, D., Pascucci, I., Brittain, S., Kamp, I., Woitke, P., Williams, J. P., Dent, W. R. F., & Thi, W.-F. 2011, ApJ, 732, 106
- Goto et al. (2012) Goto, M., et al. 2012, A&A, 539, A81
- Grady et al. (2005) Grady, C. A., Woodgate, B., Heap, S. R., Bowers, C., Nuth, III, J. A., Herczeg, G. J., & Hill, H. G. M. 2005, ApJ, 620, 470
- Grady et al. (2001) Grady, C. A., et al. 2001, AJ, 122, 3396
- Hein Bertelsen et al. (2014) Hein Bertelsen, R. P., Kamp, I., Goto, M., van der Plas, G., Thi, W.-F., Waters, L. B. F. M., van den Ancker, M. E., & Woitke, P. 2014, A&A, 561, A102
- Kley & Dirksen (2006) Kley, W., & Dirksen, G. 2006, A&A, 447, 369
- Le Bertre & Winters (1998) Le Bertre, T., & Winters, J. M. 1998, A&A, 334, 173
- Liskowsky et al. (2012) Liskowsky, J. P., Brittain, S. D., Najita, J. R., Carr, J. S., Doppmann, G. W., & Troutman, M. R. 2012, ApJ, 760, 153
- Liu et al. (2003) Liu, W. M., Hinz, P. M., Meyer, M. R., Mamajek, E. E., Hoffmann, W. F., & Hora, J. L. 2003, ApJ, 598, L111
- Lubow (1991) Lubow, S. H. 1991, ApJ, 381, 259
- Malfait et al. (1998a) Malfait, K., Bogaert, E., & Waelkens, C. 1998a, A&A, 331, 211
- Malfait et al. (1998b) Malfait, K., Waelkens, C., Waters, L. B. F. M., Vandenbussche, B., Huygen, E., & de Graauw, M. S. 1998b, A&A, 332, L25
- Mandell et al. (2008) Mandell, A. M., Mumma, M. J., Blake, G. A., Bonev, B. P., Villanueva, G. L., & Salyk, C. 2008, ApJ, 681, L25
- Mulders et al. (2013) Mulders, G. D., Paardekooper, S.-J., Panić, O., Dominik, C., van Boekel, R., & Ratzka, T. 2013, A&A, 557, A68
- Panić et al. (2014) Panić, O., Ratzka, T., Mulders, G. D., Dominik, C., van Boekel, R., Henning, T., Jaffe, W., & Min, M. 2014, A&A, 562, A101
- Pantin et al. (2000) Pantin, E., Waelkens, C., & Lagage, P. O. 2000, A&A, 361, L9
- Pontoppidan et al. (2010) Pontoppidan, K. M., Salyk, C., Blake, G. A., Meijerink, R., Carr, J. S., & Najita, J. 2010, ApJ, 720, 887
- Quanz et al. (2011) Quanz, S. P., Schmid, H. M., Geissler, K., Meyer, M. R., Henning, T., Brandner, W., & Wolf, S. 2011, ApJ, 738, 23
- Regály et al. (2010) Regály, Z., Sándor, Z., Dullemond, C. P., & van Boekel, R. 2010, A&A, 523, A69
- Tatulli et al. (2011) Tatulli, E., et al. 2011, A&A, 531, A1
- van der Plas et al. (2009) van der Plas, G., van den Ancker, M. E., Acke, B., Carmona, A., Dominik, C., Fedele, D., & Waters, L. B. F. M. 2009, A&A, 500, 1137
- van Leeuwen (2007) van Leeuwen, F. 2007, A&A, 474, 653
- Wright et al. (2010) Wright, E. L., et al. 2010, AJ, 140, 1868