The Nature of Obscuration in AGN: II. Insights from Clustering Properties
Abstract
Based on large optical and mid-infrared (IR) surveys, we investigate the relation between nuclear activity in local Seyfert 2 galaxies and galaxy interactions using a statistical neighbour counting technique. At the same level of host galaxy star formation (SF), we find that active galactic nuclei (AGNs) with stronger iii emission lines do not show an excess of near neighbours, while AGNs with stronger mid-IR emission do have more near neighbours within a projected distance of 100 kpc. The excess neighbour count increases with decreasing projected radius. These results suggest a phase of torus formation during galaxy interactions.
keywords:
galaxies: interactions; galaxies: Seyfert; galaxies: active; galaxies: nuclei; infrared: galaxies1 Introduction
An empirical tight correlation between the stellar mass of a galaxy bulge and the mass of its central supermassive black hole has been established for long time (e.g., Marconi & Hunt, 2003; Häring & Rix, 2004). This implies that the galaxy bulge and the black hole grow together and is one of the key clues in the development of our understanding of the nature of galaxy formation. It is believed that cold gas is the major common source to fuel both star formation (SF) and central supermassive black hole growth. Strong active galactic nuclei (AGNs) are usually found in galaxies rapidly forming stars (Kauffmann et al., 2003b; Page et al., 2004; Heckman et al., 2004; Alexander et al., 2005; Kauffmann & Heckman, 2009; Netzer, 2009; Hickox et al., 2009; Lutz et al., 2010; Shao et al., 2010; Santini et al., 2012; Chen et al., 2013; Goulding et al., 2014). The correlation between AGN activity and host SF is more tight in the central regions of the galaxy than in the outskirts (Kauffmann et al., 2007; Wild et al., 2007). In the local Universe, around 0.1 percent of the total gas accreted onto the galaxy finally falls into the central black hole (Heckman et al., 2004), consistent with the observed ratio.
There are several mechanisms, internal and external, to transport cold gas from the outskirts of the galaxy, where the baryonic material is not dense enough to collapse and to form stars, to the inner regions of the galaxy. Galaxy interactions are known as one mechanism that can induce gas inflows, which can enhance the SF in galaxies. There is observational evidence for this (Woods et al., 2006; Woods & Geller, 2007; Ellison et al., 2008; Li et al., 2008a; Knapen & James, 2009), as well as theoretical support from simulations (Negroponte & White, 1983; Springel, 2000; Di Matteo et al., 2007). This naturally leads to a hypothesis that there is a tight connection between AGN activity and galaxy-galaxy interactions (Alonso et al., 2007; Ellison et al., 2011; Liu et al., 2012; Cotini et al., 2013). However, the observational evidence for this has been contradictory (Li et al., 2008b; Ellison et al., 2008; Georgakakis et al., 2009; Darg et al., 2010; Silverman et al., 2011; Kocevski et al., 2012; Böhm et al., 2013).
In this letter, we aim to test the AGN-interaction connection again with a large, low- galaxy sample extracted from the Sloan Digital Sky Survey (SDSS, York et al., 2000). In previous work, also based on SDSS data, Li et al. (2008b) found that AGNs do not have more nearby companions compared with inactive galaxies with the same level of SF in the host galaxy. However, these authors used the narrow iii emission line as their AGN activity indicator (see e.g. Heckman et al., 2004). The iii line is emitted from the narrow line region, which is a few hundred parsecs away from the central black hole. Although the iii line luminosity is geometrically unobscured, it is an indirect measurement of the black hole accretion rate. In this letter, we use the same neighbour counting technique to quantify the environment of AGNs. Instead of the iii line, we adopt another AGN activity indicator, the mid-infrared (IR) emission from the torus, to study the AGN-interaction connection. The nuclear mid-IR emission is from the very central part of the galaxy with typical size of a few parsecs (Jaffe et al., 2004; Tristram et al., 2007; Beckert et al., 2008; Burtscher et al., 2009; Tristram et al., 2009; Kishimoto et al., 2009, 2011a, 2011b; Hönig et al., 2012), much smaller than the narrow line region. As was done in the first paper of this series (Shao et al., 2013, hereafter Paper I), we use the data from the Wide-field Infrared Survey Explorer (WISE, Wright et al., 2010; Mainzer et al., 2011) to estimate the strength of the torus emission.
In this letter we will discuss the relation between the environment of local AGN host galaxies and their central black hole activity as traced by their iii and IR luminosities. In section 2, we will briefly describe the data we use in this letter. We will present our results in section 3 and discuss them in section 4.
2 Data
We start from a sample that includes all the galaxies from the MPA-JHU SDSS DR7 catalogue111http://www.mpa-garching.mpg.de/SDSS/ with -band model magnitudes in the range , stellar masses in the range and redshifts in the range . The SDSS catalogue provides reliable photometric and spectroscopic data in this redshift and magnitude range for AGN host galaxies (see also Paper I), and is suitable for studying the environment of galaxies. The SDSS galaxies are matched to the WISE catalogue within a search radius of 3′′ from the optical position. We use all the WISE detections with signal-to-noise ratio above 3. 96.8% of the galaxies are detected in 4.6 band. Optical classifications are based on the star-forming galaxy/AGN separation line suggested by Kauffmann et al. (2003b) on the BPT diagram (Baldwin et al., 1981). Here we construct a sample of 18727 Seyfert galaxies (hereafter S1 sample). They are separated from LINERs (low ionization nuclear emission-line regions) according to the ii/ ratio using Function 7 in the paper by Kewley et al. (2006). LINERs are excluded from the analysis. Most of them have nuclei too faint to be detected in the mid-IR, as discussed in Paper I. Some recent studies also suggest that the iii emission in LINERs may have non-nuclear origin (Cid Fernandes et al., 2011; Yan & Blanton, 2012). In this letter, we limit our sample to Seyfert galaxies to avoid these problems.
We use two different ways to quantify the AGN activity: optical emission line and IR torus luminosities. The optical indicator is the iii line luminosity (Heckman et al., 2004), corrected for SF contribution and dust extinction. The SF contribution fraction to the iii luminosity is estimated based on the position of the galaxy on the BPT diagram, as suggested by Kauffmann & Heckman (2009) (see their Figure 3). The extinction is estimated from the Balmer decrement, assuming an intrinsic / ratio of 2.87 for star-forming galaxies and 3.1 for AGN, and the reddening curve from Wild et al. (2007).
The IR AGN activity indicator, nuclear IR luminosity, is derived by subtracting the host contribution from the observed IR luminosity (hereafter “AGN/nuclear IR luminosity” always refers to the host-subtracted IR luminosity). We match the AGN host galaxies to a control samples of non-AGNs with similar redshifts, stellar masses and star formation rates. We estimate the IR luminosities of the host component by averaging the IR luminosities of matched non-AGNs. This means that statistically, the resulting host-subtracted IR luminosities are dominated by nuclear emission. This subtraction technique is described in detail in Paper I.
We note that the PSF (point spread function) size of the WISE images is larger ( at 4.6) than the SDSS fiber aperture (). The AGN IR luminosities may thus be overestimated when there are close companions unresolved by WISE. In this letter, we adopt the WISE profile-fit magnitude, which is the least sensitive to blending by nearby sources, in order to minimize this effect. The profile-fitting routine uses both a passive and an active deblending technique to identify blended objects222http://wise2.ipac.caltech.edu/docs/release/allsky/expsup/sec4_4c.html#wpro. It is possible to deblend close neighbours with very small angular separations. The profile-fit magnitude is slightly different from the elliptical aperture magnitude we use in Paper I, but we find that for isolated galaxies this change has little effect on our AGN IR luminosity estimates.
In order to make sure that the unresolved galaxies do not affect our results, we build a “cleaner” sample for comparison. For each galaxy in the S1 sample which has close companions in SDSS with angular separation smaller than , we match the deblended WISE sources with the SDSS catalogue. If there is any close companion not successfully deblended, we discard the galaxy. In total we drop 551 galaxies from S1. This slightly trimmed sample contains 18176 Seyfert galaxies (hereafter S2 sample). Their nuclear IR luminosities are more reliable, but the sample may be slightly less representative of the general population of Seyfert galaxies.
The black hole mass is estimated from the measured stellar velocity dispersion of the galaxy by using the empirical – relation provided by Gültekin et al. (2009). We use the 4000 Å break , which is relatively free from extinction effects, to estimate the age of the central stellar population in AGN hosts (Kauffmann et al., 2003a). The reader is also referred to Paper I for more technical details about the data processing.
3 Results
We calculate the average number of close neighbours in the vicinity of AGNs using the method described by Li et al. (2006). We count the number of galaxies in the SDSS photometric sample brighter than a fixed -band magnitude limit, within a given value of the projected radius . We make a statistical correction for chance projections of foreground and background galaxies that lie along the line-of-sight, by calculating the counts around randomly placed points within the region of the sky covered by the SDSS DR7. The random positioning simulations and foreground/background subtraction are repeated for 50 times. From these realizations, we estimate the uncertainty in the calculated neighbour counts.
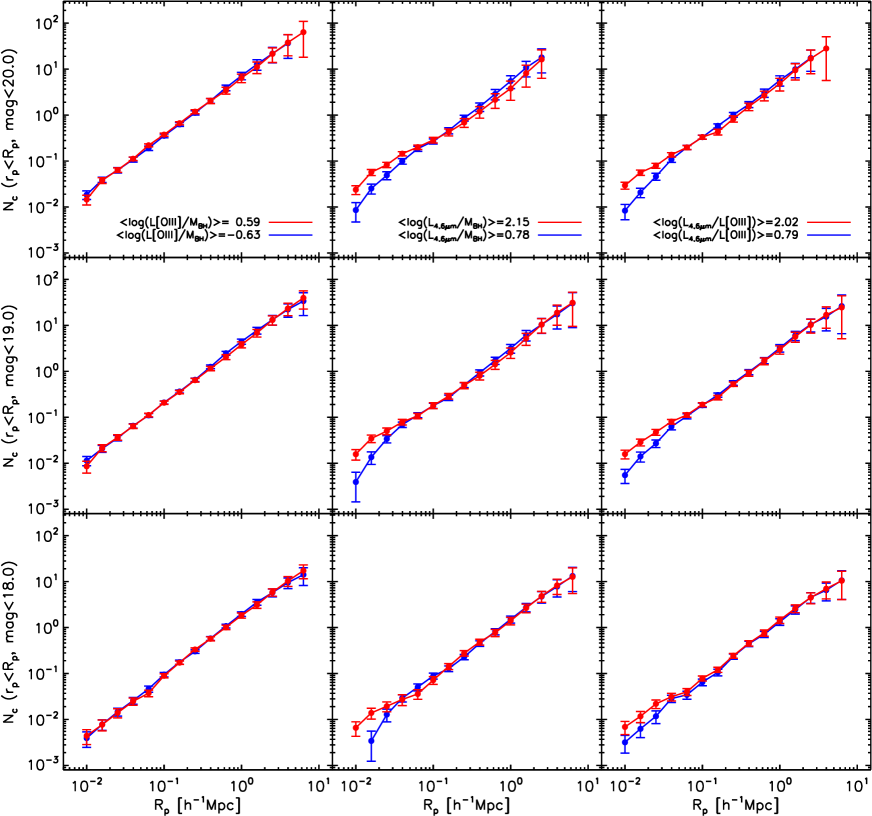
Figure 1 shows the background-subtracted average number of close neighbours within projected radius . The results are for different limiting magnitudes for the neighbour galaxies. In the top, middle and bottom panels, the apparent magnitude limits for the neighbours are 20.0, 19.0 and 18.0, respectively. From top to bottom, brighter magnitude limits mean only the brighter (and statistically more massive) neighbours are considered in the counting analysis.
In each panel, the Seyfert galaxies are split into two subsamples. They are binned according to iii in the left, in the middle and iii in the right panels, respectively. The galaxies are sorted according to the parameter in question, and the red and blue subsamples are extracted from the top 33% and bottom 33% of the objects, respectively. The two subsamples are then trimmed to make them closely matched in redshift, stellar mass, concentration and 4000 Å break with the following tolerances: ; ; and . In this way, we make sure that the two subsamples of Seyfert galaxies with very different AGN activity properties are compared at the same redshift, with the same host stellar mass distributions, with the same Hubble type distribution and with the same distribution of host SF activity. As mentioned in the introduction, it is known that the powerful optical/IR/X-ray AGNs are linked with SF, while the SF is also enhanced by galaxy interactions. It is important to compare different AGN subsamples with the same host properties, to make sure the results probe the effect of nuclear activity rather than SF in the host.
In the left panels, we can see that the number of neighbouring galaxies has no dependence on AGN activity level measured by the iii line emission, consistent with the results shown by Li et al. (2008b). At scales larger than 100 kpc, this is still true if we compare AGNs with different or iii. However, at scales smaller than 100 kpc, there is a neighbour count excess for AGNs with higher or iii. The excess signal is stronger when the projected separation is smaller. For closer neighbours, the excess neighbour count is stronger. We do not see significant dependence of the neighbour counts on the limiting magnitude of the photometric sample. This implies that the excess signal is mainly contributed by the brightest companions.
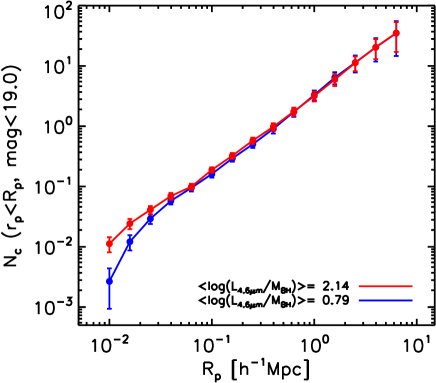
We perform the same analysis on the S2 sample, and find the same results as shown in Figure 2. This suggests that our results are not significantly affected by the neighbouring galaxies unresolved by WISE.
We also perform the same analysis on the S1 sample using the 22 band, another WISE band sensitive to AGN activity (see Paper I). Interestingly, we find the same trend as seen in 4.6 band, i.e. the AGNs with higher or iii have more close neighbours. This seems to further support the robustness of our result. However, “cleaning” unresolved neighbours in 22 band is much more difficult because the 22 PSF is twice larger than the 4.6 one. If we perform the same “cleaning” procedure as we did to build S2 sample (of course we need to check the WISE detections in a radius of around primary galaxy instead of ), we find that too few galaxies with close neighbours are left. This prevents us from coming to a fully solid conclusion about the neighbour excess in the 22 band.
4 Discussion
Theoretical simulations have suggested that merging is an efficient way to trigger nuclear activity in galaxies. It is believed that there is an early obscured stage tightly linked with the merging event (Barnes & Hernquist, 1991; Di Matteo et al., 2005; Hopkins et al., 2006). These AGNs are characterized by their prominent IR emission. One typical well-known example is ultra-luminous infrared galaxies (ULIRGs) with hidden active nuclei (Sanders et al., 1988). The merger-driven ULIRG-like objects are usually the most massive galaxies with extreme star formation rates. Compared with such objects, our SDSS AGNs are less massive and usually have moderate star formation rates. It is thus very interesting to find an AGN-environment connection for these AGNs of moderate luminosity and star formation rate. As shown in Figure 1, the link only exists when we use the host-subtracted IR luminosity as our AGN activity indicator.
In a recent paper, Satyapal et al. (2014) report a similar result. They start from a sample of SDSS mergers, showing that there are more WISE color-selected AGNs in close pairs and the AGN fraction is higher at smaller projected separation. This is consistent with our results.
Our results mean that it is necessary to understand the difference between iii-bright and IR-bright AGNs. Both our iii and IR luminosities are corrected for the contribution from the host galaxy. The iii luminosity is also extinction corrected. In practice, the IR-to-iii luminosity ratio probes the relative contribution of AGN narrow line region emission and AGN IR torus emission, free from host contamination. Physically, the IR luminosity from the torus reflects the obscured part of the total AGN radiation power, while the iii luminosity is an indicator of the unobscured part. The IR-to-iii ratio is hence a direct probe of the torus covering factor, and is directly related to the thickness of the torus. It implies that in our sample the difference between optical and IR AGN indicators is likely caused by different torus structures in different galaxies.
As mentioned in the introduction, it is commonly accepted that galaxy interactions can boost the inflow of cold gas. In a recent theoretical paper, Hopkins et al. (2012) suggest that the torus can form as a result of cold gas inflows. The torus grows thicker, forming warp-like structures, due to inflow-induced instabilities. Based on this, it is not surprising to find a torus-interaction link. Further investigations with better observational data and better simulations are necessary to make further progress in understanding these issues.
The merger-driven evolutionary scenario suggests a time lag between AGN IR and optical luminosity peaks (e.g. Hopkins et al., 2008). The difference between iii-bright and IR-bright AGNs shown in Figure 1 also implies that IR-bright AGNs may be seen before the merging event and iii-bright AGN afterwards. In Paper I, we stated that the host galaxy properties of IR and optical AGNs do not show significant differences. For our SDSS Seyfert galaxies, it seems that the total stellar mass and black hole mass accumulated during the obscured stage are negligible. We conclude that either only a small fraction of the local Seyfert galaxies are triggered by mergers, or the obscured phase is very short compared with the whole AGN lifetime.
In summary, in this letter, we have used a neighbour count technique to study a large sample of local Seyfert 2 galaxies. We have found clear evidence that the IR-strong AGNs are tightly connected with galaxy interactions. AGNs with higher nuclear IR luminosities are more likely to be surrounded by companion galaxies within a projected distance of less than 100 kpc. The strength of the neighbour count excess increases with decreasing projected distance.
Acknowledgments
The work is sponsored by the exchange program between Max Planck Society and Chinese Academy of Sciences (CAS). CL acknowledge the support of National Key Basic Research Program of China (No. 2015CB857004), NSFC (Grant No. 11173045, 11233005, 11325314, 11320101002) and the Strategic Priority Research Program “The Emergence of Cosmological Structures” of CAS (Grant No. XDB09000000). This work has made use of data from the SDSS, SDSS-II, WISE and NEOWISE.
References
- Alexander et al. (2005) Alexander D. M., Smail I., Bauer F. E., Chapman S. C., Blain A. W., Brandt W. N., Ivison R. J., 2005, Nature, 434, 738
- Alonso et al. (2007) Alonso M. S., Lambas D. G., Tissera P., Coldwell G., 2007, MNRAS, 375, 1017
- Baldwin et al. (1981) Baldwin J. A., Phillips M. M., Terlevich R., 1981, PASP, 93, 5
- Barnes & Hernquist (1991) Barnes J. E., Hernquist L. E., 1991, ApJ, 370, L65
- Beckert et al. (2008) Beckert T., Driebe T., Hönig S. F., Weigelt G., 2008, A&A, 486, L17
- Böhm et al. (2013) Böhm A. et al., 2013, A&A, 549, A46
- Burtscher et al. (2009) Burtscher L., Jaffe W., Raban D., Meisenheimer K., Tristram K. R. W., Röttgering H., 2009, ApJ, 705, L53
- Chen et al. (2013) Chen C. T. J. et al., 2013, ApJ, 773, 3
- Cid Fernandes et al. (2011) Cid Fernandes R., Stasińska G., Mateus A., Vale Asari N., 2011, MNRAS, 413, 1687
- Cotini et al. (2013) Cotini S., Ripamonti E., Caccianiga A., Colpi M., Della Ceca R., Mapelli M., Severgnini P., Segreto A., 2013, MNRAS, 431, 2661
- Darg et al. (2010) Darg D. W. et al., 2010, MNRAS, 401, 1552
- Di Matteo et al. (2007) Di Matteo P., Combes F., Melchior A. L., Semelin B., 2007, A&A, 468, 61
- Di Matteo et al. (2005) Di Matteo T., Springel V., Hernquist L., 2005, Nature, 433, 604
- Ellison et al. (2008) Ellison S. L., Patton D. R., Simard L., McConnachie A. W., 2008, AJ, 135, 1877
- Ellison et al. (2011) Ellison S. L., Patton D. R., Mendel J. T., Scudder J. M., 2011, MNRAS, 418, 2043
- Georgakakis et al. (2009) Georgakakis A. et al., 2009, MNRAS, 397, 623
- Goulding et al. (2014) Goulding A. D. et al., 2014, ApJ, 783, 40
- Gültekin et al. (2009) Gültekin K. et al., 2009, ApJ, 698, 198
- Häring & Rix (2004) Häring N., Rix H. W., 2004, ApJ, 604, L89
- Heckman et al. (2004) Heckman T. M., Kauffmann G., Brinchmann J., Charlot S., Tremonti C., White S. D. M., 2004, ApJ, 613, 109
- Hickox et al. (2009) Hickox R. C. et al., 2009, ApJ, 696, 891
- Hönig et al. (2012) Hönig S. F., Kishimoto M., Antonucci R., Marconi A., Prieto M. A., Tristram K., Weigelt G., 2012, ApJ, 755, 149
- Hopkins et al. (2006) Hopkins P. F., Hernquist L., Cox T. J., Di Matteo T., Robertson B., Springel V., 2006, ApJS, 163, 1
- Hopkins et al. (2008) Hopkins P. F., Hernquist L., Cox T. J., Kereš D., 2008, ApJS, 175, 356
- Hopkins et al. (2012) Hopkins P. F., Hayward C. C., Narayanan D., Hernquist L., 2012, MNRAS, 420, 320
- Jaffe et al. (2004) Jaffe W. et al., 2004, Nature, 429, 47
- Kauffmann & Heckman (2009) Kauffmann G., Heckman T. M., 2009, MNRAS, 397, 135
- Kauffmann et al. (2003a) Kauffmann G. et al., 2003a, MNRAS, 341, 33
- Kauffmann et al. (2003b) Kauffmann G. et al., 2003b, MNRAS, 346, 1055
- Kauffmann et al. (2007) Kauffmann G. et al., 2007, ApJS, 173, 357
- Kewley et al. (2006) Kewley L. J., Groves B., Kauffmann G., Heckman T., 2006, MNRAS, 372, 961
- Kishimoto et al. (2009) Kishimoto M., Hönig S. F., Tristram K. R. W., Weigelt G., 2009, A&A, 493, L57
- Kishimoto et al. (2011a) Kishimoto M., Hönig S. F., Antonucci R., Millour F., Tristram K. R. W., Weigelt G., 2011a, A&A, 536, A78
- Kishimoto et al. (2011b) Kishimoto M., Hönig S. F., Antonucci R., Barvainis R., Kotani T., Tristram K. R. W., Weigelt G., Levin K., 2011b, A&A, 527, A121
- Knapen & James (2009) Knapen J. H., James P. A., 2009, ApJ, 698, 1437
- Kocevski et al. (2012) Kocevski D. D. et al., 2012, ApJ, 744, 148
- Li et al. (2006) Li C., Kauffmann G., Wang L., White S. D. M., Heckman T. M., Jing Y. P., 2006, MNRAS, 373, 457
- Li et al. (2008a) Li C., Kauffmann G., Heckman T. M., Jing Y. P., White S. D. M., 2008a, MNRAS, 385, 1903
- Li et al. (2008b) Li C., Kauffmann G., Heckman T. M., White S. D. M., Jing Y. P., 2008b, MNRAS, 385, 1915
- Liu et al. (2012) Liu X., Shen Y., Strauss M. A., 2012, ApJ, 745, 94
- Lutz et al. (2010) Lutz D. et al., 2010, ApJ, 712, 1287
- Mainzer et al. (2011) Mainzer A. et al., 2011, ApJ, 731, 53
- Marconi & Hunt (2003) Marconi A., Hunt L. K., 2003, ApJ, 589, L21
- Negroponte & White (1983) Negroponte J., White S. D. M., 1983, MNRAS, 205, 1009
- Netzer (2009) Netzer H., 2009, MNRAS, 399, 1907
- Page et al. (2004) Page M. J., Stevens J. A., Ivison R. J., Carrera F. J., 2004, ApJ, 611, L85
- Sanders et al. (1988) Sanders D. B., Soifer B. T., Elias J. H., Madore B. F., Matthews K., Neugebauer G., Scoville N. Z., 1988, ApJ, 325, 74
- Santini et al. (2012) Santini P. et al., 2012, A&A, 540, A109
- Satyapal et al. (2014) Satyapal S., Ellison S. L., McAlpine W., Hickox R. C., Patton D. R., Mendel J. T., 2014, MNRAS, 441, 1297
- Shao et al. (2013) Shao L., Kauffmann G., Li C., Wang J., Heckman T. M., 2013, MNRAS, 436, 3451
- Shao et al. (2010) Shao L. et al., 2010, A&A, 518, L26
- Silverman et al. (2011) Silverman J. D. et al., 2011, ApJ, 743, 2
- Springel (2000) Springel V., 2000, MNRAS, 312, 859
- Tristram et al. (2007) Tristram K. R. W. et al., 2007, A&A, 474, 837
- Tristram et al. (2009) Tristram K. R. W. et al., 2009, A&A, 502, 67
- Wild et al. (2007) Wild V., Kauffmann G., Heckman T., Charlot S., Lemson G., Brinchmann J., Reichard T., Pasquali A., 2007, MNRAS, 381, 543
- Woods & Geller (2007) Woods D. F., Geller M. J., 2007, AJ, 134, 527
- Woods et al. (2006) Woods D. F., Geller M. J., Barton E. J., 2006, AJ, 132, 197
- Wright et al. (2010) Wright E. L. et al., 2010, AJ, 140, 1868
- Yan & Blanton (2012) Yan R., Blanton M. R., 2012, ApJ, 747, 61
- York et al. (2000) York D. G. et al., 2000, AJ, 120, 1579