Intrinsic Brightness Temperatures of Compact Radio Jets
as a Function of Frequency
1 Introduction
Relativistic outflows (or jets) are ubiquitous phenomena associated with the most energetic and compact astronomical objects such as GRB (Gamma-Ray Burst), AGN (Active Galactic Nucleus), and XRB (X-Ray Binary or “microquasar”) sources. We can gain deep insights into the processes of the creation, the physics, and the behavior of relativistic jets by studying the different or unified properties of these objects. For this purpose, the relativistic jets in AGN have been thoroughly studied by many astronomers and astrophysicists both theoretically and observationally (e.g., Blandford & Königl, 1979; Marscher, 1995; Lobanov, 1998).
Although a relativistic jet is quite a complicated phenomenon and the underlying mechanisms of the formation, collimation, acceleration, etc., of jets are far from being known, we rely on knowledge about the relativistic jets obtained from the theoretical and observational studies as follows. Relativistic jets in AGN are formed in the immediate vicinity of the central black hole, and they interact with every major constituent of the AGN (see Lobanov & Zensus, 2006). Relativistic jets are currently known to be driven from either the inner accretion disk (Blandford & Payne, 1982) or the ergosphere of a rotating black hole (Blandford & Znaejk, 1977). The most upstream emission region in the compact radio jet (the core) in Very Long Baseline Interferometry (VLBI) observations does not represent the origin (or launching site) of the jet. The core is generally believed to represent a region of the jet where the optical depth at the observing frequency is unity (Königl, 1981; Lobanov, 1998b). In the region between the origin and the VLBI core of the jet, the energy from the origin is transferred to the core by a disturbance passing through it (Marscher & Gear, 1985). Jets are believed to be collimated and accelerated by a twisted, most likely poloidal, magnetic field (e.g., Meier et al., 2001; Jorstad et al., 2007), which could be perturbed and generate the disturbance. For the relativistic jets of radio-loud galaxies, magnetic fields play dynamically important roles in the collimation and acceleration of the jets (Zamaninasab et al., 2014).
High-resolution VLBI observation is one of the observational methods of studying the relativistic jets. The main observables of the relativistic jets with the VLBI observations at radio wavelengths are the flux density and size of compact emission regions, and hence the brightness temperatures. Since, however, the emission from the relativistic jets are highly Doppler-boosted, the observed brightness temperatures of the compact emission regions do not represent the intrinsic properties of the relativistic jets. In order to investigate the intrinsic properties, Homan et al. (2006) applied a statistical method to estimate an intrinsic brightness temperature for a sample of compact radio jets observed at 15 GHz. They found that the derived intrinsic brightness temperature for their sample is close to the equipartition temperature, implying that the energies of particles and magnetic fields in the emission regions are balanced. However, Lee (2013) applied the same method to the 86 GHz VLBI survey observation data and found that the intrinsic brightness temperature estimated for about 100 compact radio jets observed at 86 GHz is lower than the 15 GHz intrinsic brightness temperature for the same sample and, hence, the equipartition temperature. This result indicates that the energy of the emission region observed at 86 GHz is dominated by the magnetic field.
In this paper, we investigate further the intrinsic brightness temperatures of compact radio sources, derived from multi-frequency large VLBI surveys. In addition to the VLBI surveys at 15 and 86 GHz (see Lee, 2013, and references therein), we also used the VLBI surveys at 2, 5, and 8 GHz for this study. In Section 2, we describe the VLBI surveys at different frequencies, show the effect of flux variability on the analysis, and estimate the multi-frequency intrinsic brightness temperatures. In Section 3, we summarize what we found from the analysis. In Section 4, we discuss our findings, and we present our conclusions in Section 5.
2 Data and Analysis
2.1 Data
In addition to the observed brightness temperatures at 15 and 86 GHz (Lee et al., 2008; Lister et al., 2009, 2013), we compiled the observed brightness temperatures at lower frequencies of 2, 5, and 8 GHz from the large VLBI surveys (Scott et al., 2004; Dodson et al., 2008; Pushkarev & Kovalev, 2012). Pushkarev & Kovalev (2012) used 19 global VLBI observing sessions conducted simultaneously at 2.3 GHz and 8.6 GHz with up to 24 radio telescopes consisting of 10 Very Long Baseline Array (VLBA) stations and up to 14 additional geodetic telescopes. The observations were carried out in the period between 1998 October to 2003 September. They observed a sample of 370 compact radio sources, including 251 quasars, 46 BL Lacertae objects, 31 radio galaxies, and 42 optically unidentified sources. The naturally weighted images were fitted with circular Gaussian models in order to derive physical properties of jet components. Due to the high compactness of the VLBI core components, they considered the core to be unresolved if its size, resulting from a fit with a circular Gaussian model, was smaller than the minimum resolvable size calculated following the same criteria as that described in Lee (2013). The median values of the angular and projected linear sizes of the VLBI core components are 1.04 mas (6.75 pc) and 0.28 mas (1.90 pc) at 2.3 GHz and 8.6 GHz, respectively. The dynamic range of the images is 106-4789 with a median of about 1000 at 2.3 GHz and 66-7042 with a median of about 1200 at 8.3 GHz. The typical rms noise level is about 0.5 mJy beam-1 at 2.3 GHz and about 0.4 mJy beam-1 at 8.6 GHz. The observed brightness temperatures of the VLBI core components are estimated based on the results of the imaging and Gaussian model-fitting. The median values of the observed brightness temperatures for the core components are K at both frequencies.
Scott et al. (2004) and Dodson et al. (2008) detected and imaged 242 compact radio sources with the VLBI Space Observatory Programme (VSOP) mission which was a Japanese-led project using an orbiting 8 m telescope, HALCA, along with global arrays of ground-based telescopes. The observations began in 1997 August and lasted until 2003 October. The VSOP survey observations were done at 5 GHz and the typical rms detection sensitivity was 0.1 Jy. They found that the median angular size of the resolved cores is about 0.26 mas and a significant fraction of the sources have a source frame core brightness temperature in excess of K based on the imaging and model-fitting with Gaussian models for the compact radio jets. A lower limit on the brightness temperature of the VLBI cores was determined using the Difwrap software package.
2.2 Analysis
2.2.1 Intrinsic Brightness Temperatures
The observed brightness temperatures for a sample of compact radio jets, compiled from VLBI surveys at different frequencies, can be used to estimate their intrinsic brightness temperature at each corresponding frequency. The intrinsic brightness temperature is one of the intrinsic physical properties of the relativistic jets together with the Lorentz factor and the angle to the line of sight . These intrinsic parameters can be related with the observed properties of the jets such as the apparent jet speed , the flux density and size of the emitting regions, and hence the observed brightness temperature as in Lee (2013):
| (1) |
| (2) |
and
| (3) |
where is the Doppler factor and is the speed of the jet in the rest frame of the source (in units of ). If we assume that (a) the compact radio jets are narrow and straight with no bends as an ideal relativistic jet, (b) the maximum apparent jet speed is the same as the jet flow speed, (c) all jets in the sample have the same intrinsic brightness temperature at a given observing frequency and does not evolve with redshift, and (d) the jets are at the critical viewing angle for the maximal apparent jet speed at a given , then the observed brightness temperature can be related to the maximum jet speed as again in Lee (2013):
| (4) |
and
| (5) |
This simple relation between the observed brightness temperature and the apparent maximum jet speed is well described as the solid line in Figure 1 of Lee (2013). Using equations (1) and (2), the apparent jet speed can be related to the Doppler factor and the Lorentz factor :
| (6) |
for the maximum and minimum possible Doppler factors and . This relation shows the apparent speeds as a function of for jets with Lorentz factor of , and appears as an evolope in the plane (and as three solid lines in Figure 1 of Lee, 2013). According to Homan et al. (2006), the intrinsic brightness temperature is derived from the curve which passes through the maximum of the envelope (equation 6) defined by the maximum apparent speeds as a function of observed brightness temperature. This curve approximately divides the data in the plane such that about 25% of the data are located above the curve. Under the assumptions (a)-(d) for the sample of compact radio jets, the derived value of can represent the intrinsic brightness temperature of the compact radio jets with an uncertainty range. The uncertainty range of may be determined between and , where is for 35% of the jets above the curve, and is for 15% of the jets above the curve.
2.2.2 Brightness Temperature vs. Time
Variability of the compact radio jets in flux density plays a critical role in determining the representative intrinsic properties, when one investigates the multifrequency intrinsic brightness temperatures based on independent VLBI surveys. Multiepoch VLBI observations over a long period (e.g., 10 years) for a sample of variable compact jets may provide us with a chance to observe the compact jets in their typical low brightness state. The typical low brightness state can be defined by selecting the median of the lower half of the brightness temperatures for a compact jet called as “25% median” (Homan et al., 2006). However, some VLBI surveys have been conducted over a relatively short period of time (e.g., a few years for the 86 GHz VLBI survey). Although a compact jet has been observed in several times during such a short period, the 25% median of brightness temperatures may be different from those with longer-period observations. Therefore it is important to investigate the influence of the source variability on determining the intrinsic brightness temperature.
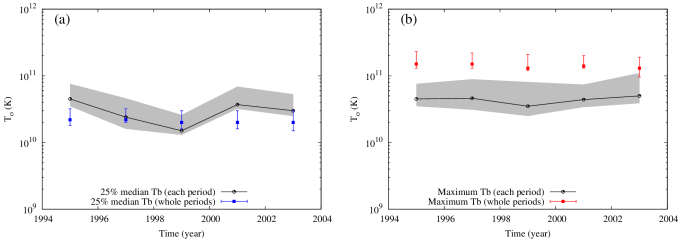
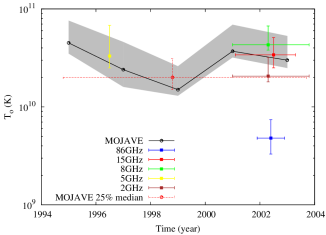
Using the 15 GHz VLBA observations conducted in 1994-2003 (used by Homan et al., 2006, for their analysis), we investigated the intrinsic brightness temperature between different epochs of observations spanning two years, between 1994 and 2003. To select the compact jets observed in each epoch we required that they also be observed in the 86 GHz VLBI survey. The number of sources selected are 68 for 1994-1995, 76 for 1996-1997, 75 for 1998-1999, 66 for 2000-2001, and 84 for 2002-2003. The sample sizes are different for each two-year period, and relatively smaller than those used by Homan et al. (2006) and Lee (2013). This may cause uncertainty in the investigation. However, the smaller sample size may not play a critical role in reliable determination of the intrinsic brightness temperature for each epoch since we found similar intrinsic brightness temperatures for different samples of the compact jets based on their brightness temperatures over the whole period of 1994-2003 (see below). The number of observations for one source over a period of two years is in a range of 1-5. For the time period of 1994-1996, all sources were observed once, and for other time periods, some sources were observed several times. The mean number of observations for one source over a single two-year period is 1.6. We determined the 25% median and maximum of the brightness temperatures as a function of time for individual sources observed more than once per time period. For those sources observed only one time, there is no 25% median or maximum. Therefore, we used the single measurement of brightness temperature in the following analysis. For those time-dependent sources we estimated the corresponding intrinsic brightness temperatures and found that they are variable for the 25% median case (Figure 1a), whereas less variable for the maximum case (Figure 1b). The measured intrinsic brightness temperatures are in ranges of K for the 25% median case, and of K for the maximum case. Moreover, from 1998-1999 to 2000-2001, the intrinsic brightness temperature for the 25% median case has increased by a factor of 2.5. The difference in the estimation of the intrinsic brightness temperature may be attributed to the different characteristics of each sample. In order to see if the difference of the sample in size affects the determination of the intrinsic brightness temperature, we determined the 25% median and maximum of the jet brightness temperature as a function of time for individual sources in the sub-sample, based on their brightness temperatures obtained over the whole period of 1994-2003. We found that the characteristic intrinsic brightness temperatures for the sub-samples are within very small ranges of K for the 25% median case, and K for the maximum case, implying the difference of the sub-samples in size may not affect strongly the determination of the intrinsic brightness temperature of each sub-sample.
By investigating the observed brightness temperatures at 15 GHz in multiple epochs, we found that the determination of the intrinsic brightness temperature is affected by the variability of individual jets in flux density at the time scales of a few years. Therefore, for the multifrequency statistical study of the intrinsic properties of the compact jets, it is important to use contemporaneous VLBI observations by conducting multifrequency observations within narrow period of time or by conducting simultaneous observations at multiple frequencies.
2.2.3 Brightness Temperature vs. Frequency
Assuming the maximum jet speed observed at 15 GHz (Lister et al., 2009, 2013) represents the flow speed of the jets, Lee (2013) applied the statistical method described in Section 2.2.1 to the sample of brightness temperatures derived at 86 GHz for which 15 GHz brightness temperatures were available. They found that the derived intrinsic brightness temperature for 98 compact radio jets at 86 GHz was significantly lower than the one at 15 GHz. They also found that the estimated Doppler factors from the derived intrinsic temperatures are significantly lower for the 86 GHz VLBI cores than for the 15 GHz cores. This has shown that multifrequency VLBI survey observations together with the above statistical method can be used to determine the intrinsic brightness temperatures representing the intrinsic properties of different regions of the compact radio jets.
In order to investigate the intrinsic brightness temperature of compact radio jets as a function of frequency, we compiled the observed brightness temperatures of the compact jets from VLBI surveys conducted at 2, 5, 8, 15, and 86 GHz. For maintaining a contemporaneity of the multifrequency samples we selected the observed brightness temperatures measured in 2001-2003, which includes the period of the 86 GHz VLBI observations. We excluded the compact jets which were not observed in the 86 GHz VLBI survey (Lee et al., 2008). The number of compact jets selected for this study is 59 for the 2/8 GHz, 93 for the 15 GHz, and 98 for the 86 GHz observations. Since we found no suitable jets observed at 5 GHz in 2001-2003, we used the 5 GHz VSOP observations in 1996 and selected 65 jets. We investigated the redshift distribution of the selected sources, and found no strong correlation of the observed brightness temperatures with their redshift. By using the same criteria as those adopted in Homan et al. (2006) and Lee (2013), we found that the characteristic intrinsic brightness temperatures of each sample are K at 2 GHz, K at 5 GHz, K at 8 GHz, K at 15 GHz, and K at 86 GHz.
3 Results
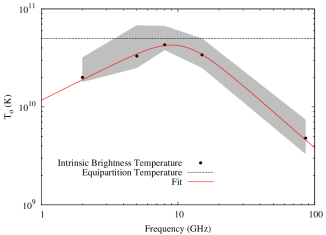
The determined intrinsic brightness temperatures for the multifrequency samples are different from each other as shown in Figure 2, implying that the compact radio jets in our sample yield different characteristic brightness temperatures for the corresponding emission regions (VLBI core) at different frequencies. The intrinsic brightness temperature at 15 GHz for our sample (red dot) is different from the one calculated over the whole period of the 15 GHz observations (red circle) due to the variability effect. The intrinsic brightness temperatures at 86 GHz is much lower than those at other frequencies. The 8 GHz sample gives the highest brightest temperature of K which is very close to the equipartition temperature of K, indicating that the jet emission regions at 2–86 GHz are in magnetically dominated environments. We have also fitted the multifrequency intrinsic brightness temperatures with a smoothly broken power-law function
| (7) |
where is the intrinsic brightness temperature at an observing frequency , and are the slopes at higher and lower frequencies than the observing frequency, respectively, and is a numerical factor governing the sharpness of the break. The broken power-law function peaks at a critical frequency which depends on the numerical factor and the best fitting parameters, , and as , providing the peak brightness temperature value . As shown in Figure 3, the best fitting was obtained for K, GHz, , and , after choosing the numerical factor , using an implementation of the nonlinear least-squares Marquardt-Levenberg algorithm. From the best fitting parameters, we found that the intrinsic brightness temperature increases as with below the critical frequency where energy losses begin to dominate the emission, and above , decreases with . We also found that the peak value of the fitted curve, K, is close to the equipartition temperature, implying that the VLBI cores visible at 2-86 GHz may be representing jet regions where the magnetic field energy dominates the total energy in jets.
4 Discussion
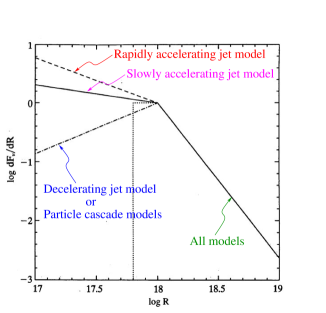
Marscher (1995) predicted that the flux density per unit length of a relativistic jet evolves along the distance from the origin (or from the central engine of jets) as showing a power-law slope of in the outer region () of jets and varying slopes of to in the inner region () depending on the jet model assumed. For the decelerating jet model or the particle cascade model, , and for the rapidly accelerating jet model, as distance increases from the central engine (Figure 4). One may relate the prediction of flux density as a function of distance with the intrinsic brightness temperature as a function of observing frequency for the VLBI core region based on the following argumentation. The VLBI core, the most compact feature in VLBI images, is believed to be located in the jet regions where the optical depth is unity. Therefore, the distance of the core from the central engine should depend on the obverving frequency , in the form (Königl, 1981). The power-law index varies depending on the distribution of the electron energy and on the magnetic field and particle density distributions. For the flat-spectrum cores under equipartition condition, a general prediction is (Königl, 1981; Lobanov, 1998). Since VLBI observations generally show that the size of the compact jet has a power-law dependence on distance as , the jet size should be related to the observing frequency as . The power-law index also depends on the physical properties of jets. Pushkarev & Kovalev (2012) found from the the jet observations at 2 and 8 GHz. If we take the average value of and the general prediction of , the factor is constant along the jet axis, where is the solid angle covering the section of the jets, and hence . Therefore, it is implied that with below a critical frequency , which corresponds to the peak frequency of the spectrum of the jet out to distance , and with beyond , depending on the jet models: for the decelerating jet model and for the rapidly accelerating jet model. Our result, ( GHz) and hence , supports the decelerating jet model or particle cascade model for the sample of the compact jets. At GHz, our result, and hence , may not be fully consistent with the prediction. Taking into account the uncertainty of the best fit, , the difference between the theory and observation () is indeed significant. This is potentially very interesting and could provide a serious test of the Marscher (1995) model - which would be a truly new result.
5 Conclusions
We investigated the brightness temperatures of 98 compact jets obtained from high resolution VLBI observations at 2, 5, 8, 15, and 86 GHz. Based on the analysis of the 15 GHz observations at multiple epochs, we found that the determination of the intrinsic brightness temperature for our sample is affected by variability of individual jets in flux density over the time scales of a few years. Therefore, it is important to use contemporaneous VLBI observations for the multi-frequency analysis of the intrinsic brightness temperatures. Since we were able to compile the high resolution VLBI observations conducted in 2001-2003, the results should not be strongly affected by the flux density variability. The analysis with the contemporaneous multifrequency VLBI observations shows that the intrinsic brightness temperature increases as with below the critical frequency and above , decreases with . This result supports the decelerating jet model. We also found that the characteristic intrinsic brightness temperatures at 2–86 GHz are lower than the equipartition temperature and the peak value of K is close to the equipartition temperature, implying that the VLBI cores observable at 2–86 GHz may be representing jet regions where the magnetic field energy dominates the total energy in jets.
Acknowledgements.
I would like to thank the anonymous referee for important comments and suggestions, which have enormously improved the manuscript. I am grateful to Andrei Lobanov for carefully reading and kindly commenting on the manuscript. The VLBA is an instrument of the National Radio Astronomy Observatory, which is a facility of the National Science Foundation operated under cooperative agreement by Associated Universities, Inc.References
- Blandford & Znaejk (1977) Blandford, R. D. and Znaejk, R. L. 1977, Electromagnetic extraction of energy from Kerr black holes, MNRAS, 179, 433
- Blandford & Königl (1979) Blandford, R. D. and Königl, A. 1979, Relativistic jets as compact radio sources, ApJ, 232, 34
- Blandford & Payne (1982) Blandford, R. D. and Payne, D. G. 1982, Hydromagnetic flows from accretion discs and the production of radio jets, MNRAS, 199, 883
- Dodson et al. (2008) Dodson, R., Fomalont, E. B., Wiik, K., et al. 2008, The VSOP 5 GHz Active Galactic Nucleus Survey. V. Imaging Results for the Remaining 140 Sources ApJS, 175, 314
- Homan et al. (2006) Homan, D. C., Kovalev, Y. Y., Lister, M. L., Ros, E., Kellermann, K. I. & Cohen, M. H., Vermeulen, R. C., Zensus, J. A. and Kadler, M. 2006, Intrinsic Brightness Temperatures of AGN Jets, ApJ, 642, L115
- Hujeirat et al. (2003) Hujeirat, A., Livio, M., Camenzind, M., and Burkert, A. 2003, A model for the jet-disk connection in BH accreting systems, A&A, 408, 415
- Jorstad et al. (2007) Jorstad, S. G., Marscher, A. P., Stevens, J. A., et al. 2007, Multiwaveband Polarimetric Observations of 15 Active Galactic Nuclei at High Frequencies: Correlated Polarization Behavior AJ, 134, 799
- Koide et al. (2002) Koide, S., Shibata, K., Kudoh, T., and Meier, D. L. 2002, Extraction of Black Hole Rotational Energy by a Magnetic Field and the Formation of Relativistic Jets, Science, 295, 1688
- Königl (1981) Königl, A. 1981, Relativistic jets as X-ray and gamma-ray sources, ApJ, 243, 700
- Lee et al. (2008) Lee, S.-S., Lobanov, A. P., Krichbaum, T. P., Witzel, A. & Zensus, J. A., Bremer, M., Greve, A., Grewing, M. 2008, A Global 86 GHz VLBI Survey of Compact Radio Sources, AJ, 136, 159
- Lee (2013) Lee, S.-S. 2013, Intrinsic Brightness Temperature of Compact Radio Sources at 86 GHz, JKAS, 46, 243
- Lister et al. (2009) Lister, M. L., Cohen, M. H., Homan, D. C., Kadler, M., Kellermann, K. I., Kovalev, Y. Y., Ros, E., Savolainen, T. & Zensus, J. A. 2009, MOJAVE: Monitoring of Jets in Active Galactic Nuclei with VLBA Experiments. VI. Kinematics Analysis of a Complete Sample of Blazar Jets, AJ, 138, 1874
- Lister et al. (2013) Lister, M. L., Aller, M. F., Aller, H. D., Homan, D. C., Kellermann, K. I., Kovalev, Y. Y., Pushkarev, A. B., Richards, J. L., Ros, E.; Savolainen, T. 2013, MOJAVE. X. Parsec-Scale Jet Orientation Variations and Superluminal Motion in AGN, AJ, 146, 120
- Lobanov (1998) Lobanov, A. P. 1998, Ultracompact jets in active galactic nuclei, A&A, 330, 79
- Lobanov (1998b) Lobanov, A. P. 1998b, Spectral distributions in compact radio sources. I. Imaging with VLBI data A&AS, 132, 261
- Lobanov & Zensus (2006) Lobanov, A. P. and Zensus, J. A. 2006, Extragalactic Relativistic Jets and Nuclear Regions in Galaxies, astro-ph/0606189
- Marscher (1995) Marscher, A. P. 1995, Probes of the Inner Jets of Blazars, Proceedings of the National Academy of Science, 92, 11439
- Marscher & Gear (1985) Marscher, A. P. and Gear, W. K. 1985, Models for high-frequency radio outbursts in extragalactic sources, with application to the early 1983 millimeter-to-infrared flare of 3C 273 ApJ, 298, 114
- Meier et al. (2001) Meier, D. L., Koide, S., and Uchida, Y. 2001, Magnetohydrodynamic Production of Relativistic Jets Science, 291, 84
- Pushkarev & Kovalev (2012) Pushkarev, A. B. and Kovalev, Y. Y. 2012, Single-epoch VLBI imaging study of bright active galactic nuclei at 2 GHz and 8 GHz A&A, 544, 34
- Scott et al. (2004) Scott, W. K., Fomalont, E. B., Horiuchi, S., et al. 2004, The VSOP 5 GHz Active Galactic Nucleus Survey. III. Imaging Results for the First 102 Sources ApJS, 155, 33
- Semenov et al. (2004) Semenov, V., Dyadechkin, S., and Punsly, B. 2004, Simulations of Jets Driven by Black Hole Rotation Science, 305, 978
- Zamaninasab et al. (2014) Zamaninasab, M., Clausen-Brown, E., Savolainen, T., et al. 2014, Dynamically important magnetic fields near accreting supermassive black holes Nature, 510, 126