Unshifted Metastable He I* Mini-Broad Absorption Line System in the Narrow Line Type 1 Quasar SDSS J080248.18551328.9
Abstract
We report the identification of an unusual absorption line system in the quasar SDSS J080248.18551328.9 and present a detailed study of the system, incorporating follow-up optical and NIR spectroscopy. A few tens of absorption lines are detected, including He I*, Fe II* and Ni II* that arise from metastable or excited levels, as well as resonant lines in Mg I, Mg II, Fe II, Mn II, and Ca II. All of the isolated absorption lines show the same profile of width centered at a common redshift as that of the quasar emission lines, such as [O II], [S II], and hydrogen Paschen and Balmer series. With narrow Balmer lines, strong optical Fe II multiplets, and weak [O III] doublets, its emission line spectrum is typical for that of a narrow-line Seyfert 1 galaxy (NLS1). We have derived reliable measurements of the gas-phase column densities of the absorbing ions/levels. Photoionization modeling indicates that the absorber has a density of and a column density of , and is located at R pc from the central super-massive black hole. The location of the absorber, the symmetric profile of the absorption lines, and the coincidence of the absorption and emission line centroid jointly suggest that the absorption gas is originated from the host galaxy and is plausibly accelerated by stellar processes, such as stellar winds and/or supernova explosions. The implications for the detection of such a peculiar absorption line system in an NLS1 are discussed in the context of co-evolution between super-massive black hole growth and host galaxy build-up.
1 Introduction
It is now generally believed that active galactic nuclei (AGNs), including their high-luminosity analog quasars, are powered by a supper-massive black hole (SMBH) fed by accretion flows. To enable the fuel feeding process, the angular momentum of the interstellar gas in the central region of host galaxy must be largely removed to bring the gaseous fuel into the nuclear region. None-axisymmetric perturbation of gravitational potential, such as that due to stellar bars and interaction with companion galaxies, are proven to be efficient ways to drive large amounts of gas inwards on spatial scale of kpcs and at timescales of Gyrs (Wada, 2004; Davies, 2009). However, molecular mappings of nearby Seyferts (e.g. NGC 1068, Müller Sánchez et al. 2009; NGC 1097, Davies et al. 2009), show that the gas inflow is terminated at spatial scales of a few to tens of pcs. Other mechanisms, rather than gravity, are necessary to drive the circumnuclear inflows. Theoretically, the stalled molecular gas will definitely result in nuclear starbursts (Hicks et al., 2009). The energetic stellar processes of circumnuclear starburst might funnel gas further inwards to intra-pc scale to fuel the black hole accretion (Davies et al., 2007; Schartmann et al., 2009).
The fueling processes should manifest themselves more observable in AGNs with high mass accretion rate. A sub-class of AGNs, namely narrow-line Seyfert 1 galaxies (NLS1s)111 Following Komossa et al. (2006), we collectively speak of NLS1s when referring to the class properties of narrow line Seyfert 1 galaxies and narrow line type 1 quasars; and we distinguish between a Seyfert galaxy and a quasar according to the classical criterion of B-band absolute magnitude when referring to individual objects., are generally considered to be AGNs at their early evolutionary stage with small black hole masses accreting at very close to the maximum allowed accretion rate (see Komossa 2008 for an extensive review). They are traditionally defined by the narrowness of their Balmer emission lines (FWHM2000 km s-1) and weakness of [O III] emission ([O III]/H; Osterbrock & Pogge 1985, but see also Zhou et al. 2006b for a slightly different definition). Strong Fe II emission is also a significant feature for NLS1s.
Mathur (2000) suggested that NLS1s live in gas-rich galaxies with ongoing star formation. Observationally, star formation in the host galaxies of NLS1s is considerable stronger compared with that of the normal type 1 AGNs using Spitzer mid-infrared spectroscopy (Sani et al., 2010) . The observations can be merged into the scenario of co-evolution of galaxy and central black hole (e.g. Granato et al., 2004). The energetic stellar processes of circumnuclear starburst might induce the surrounding gas flowing inwards more efficiently to trigger high activity of the central black hole (Davies et al., 2007; Schartmann et al., 2009). Provided that the gaseous inflows would occasionally intercept our line of sight toward active nucleus, they can be observable through quasar absorption line technique.
In this paper, we report the first such candidate absorption line system toward the narrow line type 1 quasar SDSS J080248.18551328.9 (hereafter SDSS J08025513 for brevity), and present detailed study of the system incorporating follow-up optical and NIR spectroscopy.
SDSS J08025513 was initially identified as a quasar during the Sloan Digital Sky Survey (SDSS, York et al. 2000) based on spectroscopic observation on 2003-03-24, and was included in the SDSS quasar catalogue with a redshift of (Schneider et al., 2007, 2010). It was first classified as a low-ionization broad absorption line (LoBAL) quasar by Gibson et al. (2009) according to detection of Mg II broad absorption trough with width km s-1. The authors also reported possible detection of Fe II 2414, 2632, 2750 absorption lines. SDSS J08025513 was later analyzed by Zhang et al. (2010) but rejected as a LoBAL quasar since the Mg II absorption line does not show a large enough blueshift, though the absorption trough is broader than their threshold value of . Using Kohonen self-organizing maps, Meusinger et al. (2012) again classified SDSS J08025513 as an unusual LoBAL quasar with a red color and narrow absorption line troughs, and confirmed the classification by visual inspection of its SDSS spectrum. The discrepant classification of the absorption lines in the quasar deserves further exploration.
We noticed SDSS J08025513 during our systematic search for He I* 2765, 2830, 2946, 3189, 3889, 10830 absorption multiplets in quasars222In this paper, we will use ‘*’ to denote absorption lines that arise from metastable/excited levels. E.g., metastable neutral helium absorption lines will be referred to as He I*, and singly-ionized iron absorption lines from excited levels as Fe II*. (Liu et al., 2014, submitted to ApJS). Arising from the common metastable He I* 2 3S level, the multiplets are rarely seen in the interstellar medium of normal galaxies (Rudy et al. 1985). The 2 3S level is mainly populated by recombination of He+. With an ionization potential of 4.8 eV, the diffuse stellar radiation background can easily ionize helium atoms at the 2 3S level, while lacking of enough hard photons of eV to ionize helium atoms at the ground level. Whereas quasar continuum is energetic enough to populate a large number of He atoms at the 2 3S level. He I* multiplets are hence a good indicator for distinguishing quasar intrinsic narrow absorption lines (NAL) from intervening NALs that are physically unrelated to the background quasars, in complementary to the two often used indicators (e.g. Hamann et al., 1997; Misawa et al., 2003): (1) time variability and (2) partially coverage of the absorption lines. He I* multiplets are very useful for determining the covering factor of quasar absorption gas due to the large oscillator strength differences in the multiplets. This, together with their common highly metastable lower transition 2 3S level333 The asymptotic maximum value of for a temperature of K and an electron density of cm-3 when collisional de-excitation rate dominates radiative rate (Rudy 1985)., endue He I* multiplets with a high sensitivity to a large dynamic range of column densities when other strong UV resonant lines, such as O VI, N V, C IV, Si IV, Al III and Mg II, are heavily saturated (Arav et al., 2001b; Leighly et al., 2011, 2014). The wide wavelength separations of the lines in He I* multiplets also relieve line blending, which is always a severe problem for BAL studies. Clear detection of He I* 3189, 3889, 10830 and a few tens of other absorption lines, including Ni II*, Fe II*, Fe II, Mn II, Ca II, Mg II and Mg I, enable us to derive reliable measurements of the column densities of the corresponding ions/levels; to probe the physical conditions of the absorption gas; and to locate the gas with the aid of photoionization model calculations.
The paper is organized as follows. In §2, we will present a brief description of the SDSS quasar sample with He I* absorption line multiplets, and identify SDSS J08025513 as an outlier in the sample. We will also describe there the data used in this paper, including collection of archived data and observations and data reductions of our new spectroscopies. Measurements of emission and absorption lines will be presented in §3. In §4, we will perform extensive photoionization simulations with the spectral synthesis code CLOUDY (Ferland et al., 1998), and make comparison between model calculations and absorption line measurements. Possible origin of the absorption gas and its implications will be discussed in §5. Our main results will be summarized in the last section, together with future perspectives. Throughout this paper, we assume a cosmology with = 0.7, = 0.3, and H0=70 km s-1 Mpc-1. All quoted magnitudes are using AB-system except 2MASS ones, which are Vega magnitudes. We use negative velocities to denote blueshifted absorption lines, and positive values for redshifted lines.
2 Identification, Observations and Data Reduction
2.1 SDSS J08025513 as an Outlier of Quasar He I* Absorbers
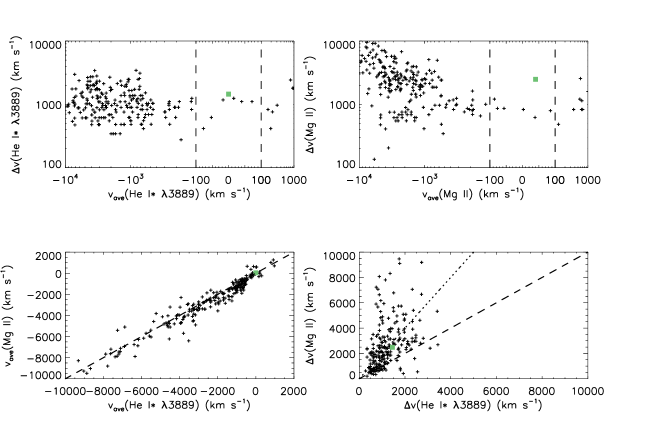
He I* multiplets are much under-explored as an important diagnostics for the ionization state of quasar absorption gas. So far only a handful detections have been reported in the literature (see Liu et al. 2014 for a summarization). He I* 10830, located in the NIR and the strongest line in the multiplets, is beyond the wavelength coverage of most large sky area optical spectroscopic surveys. With a value of 23.3 times less than He I* 10830 (Leighly et al., 2011), the second strongest line, He I*3889, though falling in the optical for quasars at , is much weaker than those familiar UV resonant lines. In that wavelength range, the pseudo-continuum from complex iron multiplets, which usually varies a lot from object to object, makes the normalization quite uncertain. Detection of such a weak line with contamination is a challenging task. We developed a new detection technique to minimize the uncertainty of normalization. We use the observed quasar spectra in a selected library to mimic the absorption free spectra of the quasar of interest, in analog to the pair-method traditionally used to recover the extinction-free stellar spectra (see Liu et al. 2014 for a full description of the method). The ‘pair-method’ can yield a much better precision than the often-adopted approaches for quasar absorption line measurements. Using this newly developed technique, we detected He I* 3889 line at confidence level in 247 quasars with Mg II absorption from the Seventh Data Release (DR7) of SDSS. The quoted uncertainties include both statistical and systematic errors. As shown in Figure 1, the velocity centroid of Mg II and He I* 3889 agrees with each other within 10%. This indicates that the vast majority of absorption lines in the sample are real detections, since Mg II and He I* 3889 are measured independently. In this Figure, we also compared the width of Mg II and He I* 3889, and found that the former is on average 2 times broader than the later with a rather large scatter. This fact was also noted by Arav et al. (2001b) in a case study of QSO 23591241.
The sample show interesting pattern in the Mg II line velocity against width (-) 444 is the absorption-weighted average velocity, while is the difference between maximum and minimum velocities of the absorption troughs, See Liu et al. 2014 for details. plane of Figure 1. Line width is strongly correlated with velocity for absorbers in the upper-left corner ( and 1,000 km s-1), which can be readily classified as BALs. Absorbers located in the lower-right corner should fall in the traditional intrinsic NAL category. Considering the velocity zero-point uncertainty of 100 km s-1 determined by [O III], [O II], Mg II, and Balmer emission lines (Zhou et al., 2006b; Nestor et al., 2008), absorbers located in the middle part within the two dashed lines can be taken as unshifted, most of which might be of a different origin than the left-hand BAL and NAL outflows. Their relation with those redshifted absorbers located in the lower-right corner is not clear, neither is the nature of the redshifted absorbers (see Shi et al. 2014 for a case study)555 The origin of these redshifted absorbers may also be different from the BAL quasars with redshifted troughs identified by Hall et al. (2013), which are much broader and often with blueshifted absorption too.. With an associated quasar showing an NLS1-like emission line spectrum, the broadest Mg II absorption trough, a common redshift coincidence with that of the quasar emission lines, the same symmetrical velocity structure of all isolated absorption lines, SDSS J08025513 is the most extreme case of the unshifted He I* 3889 absorbers. Taking advantage of the profuse absorption line spectrum, a detailed study of this extreme case may shed new light on the nature of this mysterious new kind of absorbers. We collected existing photometric data and performed subsequent NUV through optical to NIR spectroscopic follow-ups from 2008 to 2012 using the Blue Channel Spectrographs at the Multiple Mirror Telescope (MMT), the Multi-Object Double Spectrographs (MODS) at the Large Binocular Telescope Large Binocular Telescope (LBT), and TripleSpec at the 200-inch Hale Telescope (P200). The photometric and spectroscopic data are summarized in Table 2.3 and Table 2, respectively. We show the data in Figure 2 and give them detailed descriptions in next two subsections.
2.2 Broad Band Photometry
The photometric data include fluxes at 1.4 GHz by NRAO VLA Sky Survey (NVSS, Condon et al. 1998) and Faint Images of the Radio Sky at Twenty-cm (FIRST, Becker et al. 1995) in the radio; IR magnitudes from the Wide-field Infrared Survey Explorer (WISE; Wright et al. 2010) and the Two Micron All Sky Survey (2MASS, Skrutskie et al. 2006); optical magnitudes from SDSS; and NUV magnitude from the Galaxy Evolution Explorer (GALEX, Morrissey et al. 2007).
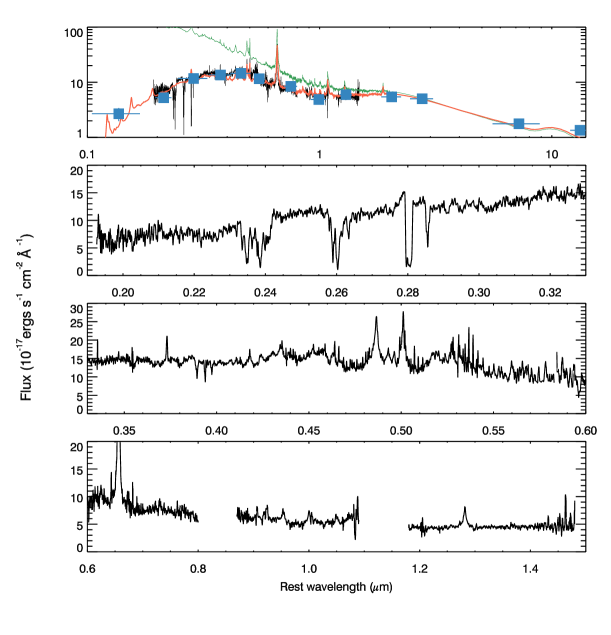
SDSS J08025513 has been monitored in Catalina Real-time Transient Survey over 7 year (Drake et al., 2012). The light curve in V band shows no significant variations beyond the intrinsic 1- flux scatter of 15% (see Figure 3). The data suggests that the quasar did not show significant variability. As shown in the first panel of Figure 2, the SED of SDSS J0802+5513 is apparently red as compared to a quasar composite. The quasar composite used in the fit is the combination of SDSS optical ( Å, Vanden Berk et al. 2001), IRTF NIR (3000 Å m, Glikman et al. 2006; see Zhou et al. 2010 for an application) and Spitzer MIR to FIR ( m, Netzer et al. 2007) composites. We then estimated reddening of the quasar by fitting the quasar composite spectrum to the SED of SDSS J08025513 assuming a Small Magellanic Cloud (SMC) type extinction curve (Lequeux et al., 1982; Cartledge et al., 2005). The best-fitted model is obtained by minimizing . The best-fitted is 0.36 mag, which agrees well with that indicated by the flux ratios of Pa/H (E(BV)0.4) and H/H (E(BV)0.3) as detailed in §3.1. It can be seen in the first panel of Figure 2 that this simple model well reproduces the observed SED.
SDSS J0802+5513 is detected by FIRST and NVSS at 1.4 GHz in the radio. No significant variability was observed between the two epochs. Radio loudness, defined as , is 110 and 25, respectively, before and after reddening correction. The NVSS flux at 1.4 GHz was used to estimate the 5 GHz emission and a radio spectral index of () was assumed. We corrected the band flux flux using the best-fitted reddening value. SDSS J0802+5513 is moderately radio-loud, and it becomes radio-intermediate after reddening correction. SDSS J08025513 was also observed at 18 cm by the Multi-Element-Radio-Linked Interferometer Network (MERLIN). It is unresolved at resolution, corresponding to a linear scale of about 1.6 kpc the redshift of the quasar (Zuther et al., 2012).
2.3 Spectroscopy
| band | flux | facility | obs. date | reference |
|---|---|---|---|---|
| mag/mJy | (UT) | |||
| NUV | 22.620.26 | GALEX | 2004-06-05 | 1 |
| 20.790.06 | SDSS | 2003-03-11 | 2 | |
| 19.210.02 | SDSS | 2003-03-11 | 2 | |
| 18.420.01 | SDSS | 2003-03-11 | 2 | |
| 17.880.02 | SDSS | 2003-03-11 | 2 | |
| 17.700.02 | SDSS | 2003-03-11 | 2 | |
| 16.470.10 | 2MASS | 1999-04-27 | 3 | |
| 15.940.13 | 2MASS | 1999-04-27 | 3 | |
| 14.660.09 | 2MASS | 1999-04-27 | 3 | |
| 12.930.03 | WISE | 2010-01-10 | 4 | |
| 11.720.02 | WISE | 2010-01-10 | 4 | |
| 8.840.03 | WISE | 2010-01-10 | 4 | |
| 6.460.04 | WISE | 2010-01-10 | 4 | |
| GHz | 7.10.5 | NVSS | 1993-11-23 | 5 |
| GHz | 6.540.14 | FIRST | 1998-07-17 | 6 |
| wavelength coverage | slit | resolution | exposure | telescope/instrument | obs. date |
|---|---|---|---|---|---|
| (Å) | (arcsec) | (sec) | UT | ||
| 3800–9200 | 3aaThe SDSS spectrograph is fiber fed with a size of in diameter. | 2000 | 4200 | SDSS 2.5m | 2003-03-24 |
| 3200–5200 | 1 | 1800 | 1500 | MMT/Blue Channel | 2008-03-30 |
| 10000–24000 | 1.1 | 2500 | 1200 | P200/TripleSpec | 2011-10-21 |
| 3200–11000 | 0.8 | 2500 | 2400 | LBT/MODS | 2012-01-29 |
The SDSS spectrum that we use is the improved sky-residual subtracted version as published in Hewett & Wild (2010).

To detect any possible absorption line variations and achieve a higher signal-to-noise ratio (S/N), We carried out a follow-up NUV spectroscopic observation at MMT using the blue channel on 2008-03-30. We used the slit and 800 l/mm grating. A total observation time of 1500 s was equally split into two exposures. The seeing during the observation is about . He/Ne/Ar lamp is used for wavelength calibration and the KPNO standard star eg182 is observed for flux calibration. We use the standard IRAF package666IRAF is distributed by the National Optical Astronomy Observatory, which is operated by the Association of Universities for Research in Astronomy, Inc., under cooperative agreement with the National Science Foundation. to extract the 1-D spectrum. The extracted spectrum covers a wavelength range of 3200–5200 Å. The median S/N of the MMT spectrum is about 10 pixel-1 with a resolution of , similar to that of SDSS (). Compared to SDSS spectrum, the MMT spectrum shows no significant variations in absorption lines, neither the velocity profiles nor the maximum depths (see §3.2 for detail).
To observe H emission line and the expected He I* 10830 absorption line, we acquired a NIR spectrum using TripleSpec at P200 telescope via China Telescope Access Program (TAP). The observation was carried out on 2011-10-21 using the standard slit of in A-B-B-A dithering mode. The total exposure time was 1200 s. Using IDL-based Spextool software (Cushing et al., 2004), the raw data are flat-field corrected, telluric corrected (Vacca et al., 2003), wavelength (using sky lines) and flux calibrated. The reduced spectrum has a wavelength coverage of –2.4 m and a resolution of .
To fill the gap between SDSS and P200 spectra and to detect the possible Na I D absorption doublet, we carried out a follow-up spectroscopy using MODS at LBT with a slit width of . Four 600 s exposures were acquired for each of the blue and red channels. CCD reductions, including bias subtraction, flat-field correction were accomplished using Python package “modsCCDRed”. Subsequent reductions are carried out using standard IRAF package. Ne/Hg/Ar/Xe/Kr lamps were used for wavelength calibrations and the standard star Ferge 67 was observed for flux calibration. The extracted LBT spectrum covers a wavelength range of – Å and a resolution of . Na I D absorption doublets were not significantly detected on the moderate S/N LBT spectrum.
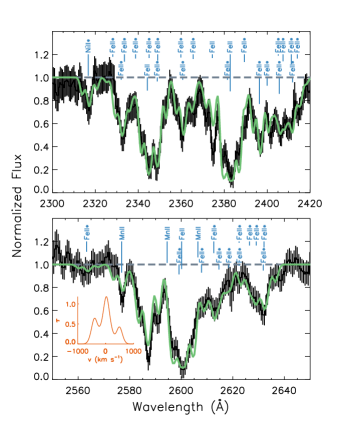
All above-mentioned spectra were corrected for the Galactic extinction of (Schlegel et al., 1998) assuming an average Galactic () extinction law, and transformed into the quasar rest-frame using the redshift of as determined by [O II], [S II], Balmer and Paschen emission lines, which is in consistent with that () given in Hewett & Wild (2010) within errors. Since the quasar SDSS J08025513 shows no significant variation in years (see §2.2), we then recalibrated all spectra to photometric data for correcting aperture and seeing effects. We then combined all the spectra, weighted by their S/N, to construct a broad band spectral energy distribution (SED). We display the combined spectrum in the first panel of Figure 2 with expanded views in subsequent panels. It shows narrower Balmer lines and stronger optical Fe II emission lines. [O II] emission is very strong relative high ionization forbidden lines such as [Ne III] and [O III]. Quantitative emission line measurement will be presented in §3.1. Besides emission lines, the absorption spectrum of SDSS J08025513 is profuse from rest-frame NUV through optical to NIR. The most prominent absorption features are the strong He I* line at 10830 Å and the blended troughs of Fe II UV1 and UV2 around 2600 Å and 2400 Å respectively. Identification and measurement of the absorption lines will be described in §3.2.
3 Spectral Analysis
3.1 Emission Lines Measurement
| Transition | Broad line flux | Broad line Width | Narrow line flux | Narrow line Width |
|---|---|---|---|---|
| 10-17 ergs cm-2 s-1 | 10-17 ergs cm-2 s-1 | |||
| Pa | 23020 | 1800 | 3210 | |
| H | 194628 | 1800 | 23510 | |
| H | 48715 | 1800 | 4015 | |
| 456 |
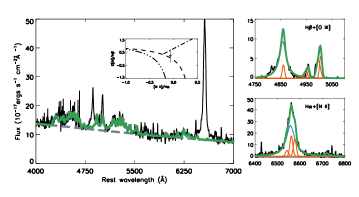
We adopt a fitting method similar to Zhou et al. (2006b) and Dong et al. (2011) to measure the emission lines of interest, with some modifications to accommodate the existence of broad absorption lines. Briefly, the observed spectrum was decomposed into a power law, Fe II emission complex, and emission lines other than Fe II. Given the SED of SDSS J0802+5513 is red, we fit a reddened power law to emission line free windows: 4020–4050 Å, 4205–4235 Å, 5580–5620 Å, 6350–6400 Å, 6810-6850 Å. Then we subtract the best fitted power law from the observed spectrum, and fit the residual by a Fe II template. We employed the Fe II template built by Véron-Cetty et al. (2004). The template was broadened to fit the Fe II emission strong spectral windows: 4170–4260 Å, 4430–4770 Å 5080–5500 Å and 6050–6200 Å. The best-fitted model of the pseudo-continuum, including a power law and Fe II multiplets, is shown in the left panel of Figure 4.
Emission lines other than Fe II multiplets were measured by fitting the pseudo-continuum-subtracted spectrum. Each of Balmer and Paschen lines were modeled with two components, a Lorentzian profile for the broad line and a Gaussian for the narrow one. The narrow Balmer and Paschen lines were assumed to have the same width and redshift as that of the low-ionization forbidden lines [S II] and [N II]. All of the narrow emission lines were fitted by a single Gaussian except [O III] doublet, which were fitted with two Gaussians, one for the blue wing (Komossa, 2008) and the other for the core of the lines. The width and redshift of [O III] core component were tied to that of low-ionization narrow lines. The doublet ratios of [O III] and [N II] are fixed to their theoretical value 3:1 during the fit. We zoomed in the best-fitted model in H and H regimes in the right panel of Figure 4.
The measured line parameters are summarized in Table 3. In Dong et al. (2008), the authors investigated the broad-line Balmer decrements for an unreddened sample of Seyfert 1 galaxies and QSOs in SDSS and they find that the distribution of the intrinsic broad-line H/H ratio can be well described by log-Gaussian, with the peak at H/H=3.06 and a standard deviation of about 0.03 dex only. The steep broad line ratios of H/H in SDSS J0802+5513 thus indicate that the broad line region (BLR) should be significantly reddened. Using H/H as the intrinsic Balmer decrement and an SMC type extinction curve, we obtain an estimate of . No estimation of intrinsic Pa/H is available in (Dong et al., 2008), we assume an intrinsic Pa/H ratio of 0.06 as calculated in case B for typical BLR conditions ( i.e., K and cm-3, Hummer & Storey 1987), we obtain an estimate of 0.04. These agree with the value yielded from SED fitting in §2.2 within errors. The intensity ratios of narrow hydrogen lines are also much steeper than that typically found in the narrow line region (NLR) of AGNs (Zhang et al., 2009) and star-forming galaxies (Xiao et al. 2012 and references therein), suggesting that narrow emission lines might be heavily reddened by interstellar dust clouds as well. However, the relative measurement errors of narrow hydrogen lines are much larger than that of broad lines due to the data quality available. High S/N and resolution spectra are needed to confirm this.
The emission-line properties of SDSS J0802+5513 are typical for an NLS1, with narrow Balmer emission line , strong optical Fe II emission , and weak [O III] emission . The black hole mass acquired is using the empirical mass-luminosity-line width relation calibrated through reverberation mapping (Peterson & Bentz, 2006). In the most conservative case, we integrate the infrared photometries from 2MASS K to WISE w4 to get a lower limit of bolometric luminosity erg s-1. Here we assume the radiation in this wavelength range is from hot dust heated solely by the quasar nucleus given the similar between infrared SED and the quasar composite, and the dust has a full coverage of the central engine. Here we did not include the emission beyond WISE w4. A more reasonable estimate is at least twice the value considering that FIR is not included and covering factor of the dusty torus is about 0.5 based on fraction of obscured AGNs (e.g. Dong et al., 2005; Hasinger, 2008). Alternatively, we can estimate the bolometric luminosity using the monochromatic luminosity of erg s-1 at 5100 Å . Using the bolometric correction of (Richards et al., 2006), the corresponding bolometric luminosity is erg s-1 and erg s-1, respectively, before and after extinction correction. The inferred Eddington ratio is –, indicating the central SMBH is undergoing a rapid growth. Assuming a mass-to-energy conversion efficiency of , we inferred a mass accretion rate of – yr-1
3.2 Absorption Lines Measurement
3.2.1 Normalization of Absorption Line Spectra
To normalize the absorption line spectrum, absorption-free spectrum of SDSS J0802+5513 must be recovered first. Two technique are commonly adopted to achieve this goal, namely spectral decomposition (e.g. Lu et al., 2008) and template match method (e.g. Zhou et al., 2006a). We split the observed spectrum into three regimes and use different approaches to reconstruct absorption-free spectra, according to the different emission and absorption characteristics. The 3 spectrum regimes of interest are (1) Fe II+Mg II regime (2100–3200 Å), (2) He I* 3889+Ca II regime (3700–4000 Å), and (3) He I* 10830 regime (1–1.4 m). The observed spectrum of the 3 regimes are bloated and displayed in Figure 5 with the best-fitted models overlaid. Identified lines are labeled by vertical bars on the top of each panel in the Figure and listed in Table 3.2.2.
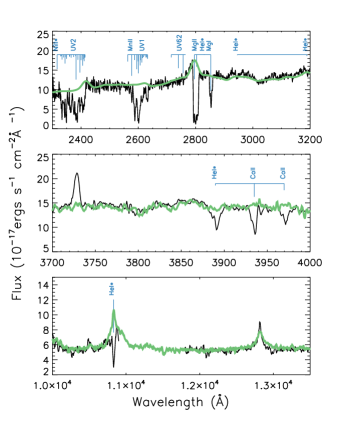
Fe II+Mg II regime We employed the spectral decomposition technique for this regime. The observed data were fitted by the combination of three components: a power law, a broadened Fe II+Fe III template and a broad Mg II emission line. The three components were reddened by the same SMC-like dust with as a free parameter. The Fe II template built by Tsuzuki et al. (2006) is adopted, and the FeIII UV47 multiplet template is from Vestergaard & Wilkes (2001). We assumed that Mg II broad line has the same profile and redshift as Balmer broad lines obtained in §3.1. The best-fitted value of (B-V) is consistent with that inferred from broad band SED fitting ((B-V), §2.2) and that estimated from broad hydrogen line ratios ((B-V)–, §3.1).
He I* 3889+Ca II regime We used the template matching method for this regime due to the fact that emission features in this regime, mainly arising from Fe II, Ti II and Cr II etc., are very complex, and no appropriate templates are available for them (Véron-Cetty et al., 2004, 2006). Furthermore the ratios of optical Fe II multiplets vary dramatically from object to object (Vestergaard & Wilkes, 2001), Fe II templates built from in I Zw1 alone cannot fit this region well. We choose the observed spectra of Fe II strong quasars as templates to match the spectrum in this regime. The templates are chosen from DR 7 quasars with Å and a median in [O II] region. The best matched template is the spectrum of SDSS J100446.52+600336.1 (as seen in Figure 5).
He I* 10830 regime The He I* 10830+Pa emission blends are seriously affected by strong He I* 10830 absorption line and the red wing of the blends falls at the gap between J and H bands. As seen in Figure 5, the NIR composite spectrum of quasar derived by Glikman et al. (2006) matches the observed spectrum in this regime quite well.
The detected absorption lines (c.f. Table 3.2.2) fall into two categories: relatively isolated lines (Figure 6) and heavily blended lines (Figure 7). The normalized absorption line spectrum is derived by dividing the observed spectrum by the absorption-free spectrum recovered above straightforwardly. This normalization scheme is based on the assumption that the absorption gas covers both the continuum source and BLR of quasar. The validity of such an assumption can be justified by checking the residual flux at the centroid of strong absorption lines. The residual fluxes at the centroids of Mg II, Fe II 2600 and He I* 10830 lines are so small that it would yield negative values at these wavelengths if we subtracted the broad emission lines. This implies that the absorber at least covers a significant part, if not all of the BLR. In this case, the continuum source must be fully covered, since the size of the BLR is about two orders of magnitude larger than that of the accretion disk. Indeed, the apparent optical depth ratios of both Ca II K, H and He I* 3189, 3889 doublets support the assumption of full coverage. The column densities of Ca II and He I* evaluated by individual line of the doublets based on the full coverage assumption agree with each other within errors (see Table 5 and detail in §3.2). Note that the full coverage assumption is consistent with the location of the absorption gas estimated in §4, which is pc from the central SMBH, about three orders of magnitude larger than the BLR.
3.2.2 Measurements of Absorption Lines
We measured the column densities of isolated lines and blended lines using different schemes, respectively.
| Wavelength(Å) | log | Ion | ||||
|---|---|---|---|---|---|---|
| 10830.80 | -0.04 | He I* | 159856 | 3 | 169086 | 9 |
| 3889.80 | -0.72 | He I* | 159856 | 3 | 185565 | 9 |
| 3188.69 | -1.16 | He I* | 159856 | 3 | 191217 | 9 |
| 2852.97 | 0.270 | Mg I | 0 | 1 | 35051 | 3 |
| 2796.36 | 0.100 | Mg II | 0 | 2 | 35761 | 4 |
| 2803.54 | -0.210 | Mg II | 0 | 2 | 35669 | 2 |
| 3934.83 | 0.134 | Ca II | 0 | 2 | 25414 | 4 |
| 3969.65 | -0.166 | Ca II | 0 | 2 | 25192 | 2 |
| 2576.87 | 0.433 | Mn II | 0 | 7 | 38807 | 9 |
| 2594.49 | 0.270 | Mn II | 0 | 7 | 38543 | 7 |
| 2606.46 | 0.140 | Mn II | 0 | 7 | 38366 | 5 |
| 2344.2139 | 0.057 | Fe II | 0 | 10 | 42658 | 8 |
| 2374.4612 | -0.504 | Fe II | 0 | 10 | 42115 | 10 |
| 2382.7652 | 0.505 | Fe II | 0 | 10 | 41968 | 12 |
| 2586.6500 | -0.161 | Fe II | 0 | 10 | 38660 | 8 |
| 2600.1729 | 0.378 | Fe II | 0 | 10 | 38459 | 10 |
| 2333.5156 | -0.206 | Fe II* | 385 | 8 | 43239 | 6 |
| 2365.5518 | -0.402 | Fe II* | 385 | 8 | 42658 | 8 |
| 2389.3582 | -0.180 | Fe II* | 385 | 8 | 42237 | 8 |
| 2396.3559 | 0.362 | Fe II* | 385 | 8 | 42115 | 10 |
| 2599.1465 | -0.063 | Fe II* | 385 | 8 | 38859 | 6 |
| 2612.6542 | 0.004 | Fe II* | 385 | 8 | 38660 | 8 |
| 2626.4511 | -0.452 | Fe II* | 385 | 8 | 38459 | 10 |
| 2328.1112 | -0.684 | Fe II* | 668 | 6 | 43621 | 4 |
| 2349.0223 | -0.269 | Fe II* | 668 | 6 | 43239 | 6 |
| 2381.4887 | -0.693 | Fe II* | 668 | 6 | 42658 | 8 |
| 2399.9728 | -0.148 | Fe II* | 668 | 6 | 42335 | 6 |
| 2405.6186 | 0.152 | Fe II* | 668 | 6 | 42237 | 8 |
| 2607.8664 | -0.150 | Fe II* | 668 | 6 | 39013 | 4 |
| 2618.3991 | -0.519 | Fe II* | 668 | 6 | 38859 | 6 |
| 2632.1081 | -0.287 | Fe II* | 668 | 6 | 38660 | 8 |
| 2338.7248 | -0.445 | Fe II* | 863 | 4 | 43621 | 4 |
| 2359.8278 | -0.566 | Fe II* | 863 | 4 | 43239 | 6 |
| 2405.1638 | -0.983 | Fe II* | 863 | 4 | 42440 | 2 |
| 2407.3942 | -0.228 | Fe II* | 863 | 4 | 42401 | 4 |
| 2411.2433 | -0.076 | Fe II* | 863 | 4 | 42335 | 6 |
| 2614.6051 | -0.365 | Fe II* | 863 | 4 | 39109 | 2 |
| 2631.8321 | -0.281 | Fe II* | 863 | 4 | 38859 | 6 |
| 2345.0011 | -0.514 | Fe II* | 977 | 2 | 43621 | 4 |
| 2411.8023 | -0.377 | Fe II* | 977 | 2 | 42440 | 2 |
| 2414.0450 | -0.455 | Fe II* | 977 | 2 | 42401 | 4 |
| 2622.4518 | -0.951 | Fe II* | 977 | 2 | 39109 | 2 |
| 2629.0777 | -0.461 | Fe II* | 977 | 2 | 39013 | 4 |
| 2332.00 | -0.720 | Fe II* | 1873 | 10 | 44754 | 8 |
| 2348.81 | -0.470 | Fe II* | 1873 | 10 | 44447 | 8 |
| 2360.70 | -0.700 | Fe II* | 1873 | 10 | 44233 | 10 |
| 2563.30 | -0.050 | Fe II* | 7955 | 8 | 46967 | 6 |
| 2715.22 | -0.440 | Fe II* | 7955 | 8 | 44785 | 6 |
| 2740.36 | 0.240 | Fe II* | 7955 | 8 | 44447 | 8 |
| 2756.56 | 0.380 | Fe II* | 7955 | 8 | 44233 | 10 |
| 2316.72 | 0.268 | Ni II* | 8394 | 10 | 51558 | 8 |
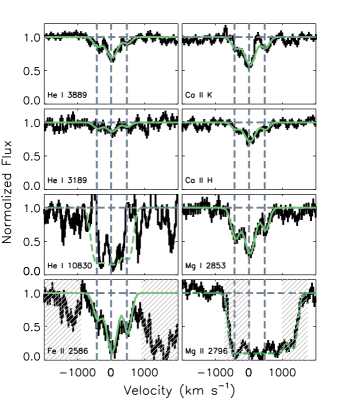
The isolated He I* 3189, 3889, Fe II 2586, Ca II K, H, and Mg I lines show nearly identical velocity structure as seen in Figure 6. Each line has three distinct components, as indicated by the vertical dashed lines. The deepest component is centered at the quasar systematic redshift. Two shallower components are symmetrically distributed around the deepest one with a velocity shift of 500 km s-1. Assuming the background source fully covered and the absorption lines moderately resolved, we evaluated the optical depth profiles of the 6 absorption lines as -ln, where is the residual intensity of the normalized spectrum. Each of the 6 lines was fitted with 3 Gaussians. The width and centroid of the corresponding Gaussian are tied during the fit. The best-fitted optical depth as a function of velocity is shown in the insert in Figure 7. The equivalent widths (s) of these 6 lines are measured from the best-fitted models, which are overplotted in Figure 6. We also calculated the column densities of the corresponding lines by integrating their best-fitted apparent optical depth profiles. The measured s and column densities are listed in Table 6. Both of Mg II doublet and He I* 10830 lines are seriously saturated and no direct measurement is available. Their absorption troughs are flat-bottomed with residual flux of 10% at the deepest points 777Either partially covered background light, scattered light of AGN, or starlight from the host galaxy could contribute to the residual flux. Current available data quality are not of enough to distinguish these possibilities. He I* 10830 is seriously affected by sky line residuals.. As a conservative estimate, assuming a covering factor of 85%, we rescaled the best-fitted He I* 3889 optical depth profile by a factor of 23.3 ( ratio of 10830 to 3889, Leighly et al. 2011) to generate a He I* 10830 absorption line model. The model is overlaid on the observed data in Figure 6. Mg II 2796 is seriously blended with Mg II 2803, we used the best-guessed Mg+ column density from photoionization simulation in §4 to create the model over-plotted in Figure 6. In Table 5, we take half of the integrated of the blend as a rough estimate for each of the doublet.
| Species | transtions | (Å) | (cm-2) |
|---|---|---|---|
| Ca II | 3969.59 | 2.150.16 | 13.590.07 |
| Ca II | 3934.78 | 3.520.17 | 13.510.05 |
| He I* | 3889.74 | 2.540.18 | 14.730.07 |
| He I* | 3188.66 | 0.820.14 | 14.820.17 |
| Mg I | 2852.96 | 4.510.53 | 13.530.11 |
| Mg II | 2803.53 | 5.820.21aaAll quoted errors are statistical ones, widths are FWHMs, the widths of all broad emission lines and narrow lines are tied during the fit, respectively. | |
| He I* | 10830.40 | 29.63 |
HiBALs like C IV, Si IV are often much stronger and wider than LoBALs like Mg II, Al III (Zhang et al., 2010; Filiz Ak et al., 2014), it is remarkable that He I*, Fe II, Ca II and Mg I lines, which are arising from ions with very different ionization potentials, have almost the same velocity structure, and this indicates that SDSS J0802+5513 may have an origin other than traditional BALs. He I* 3189, 3889, 10830 arise from metastable triplet level He I 23S at a rather high excitation energy of 19.6 eV. The level is populated by recombination from He+ ions (Ji et al., 2012), which are created by photons with energies of eV and are destroyed by photons with eV. They survive in much different conditions than that of Ca+ ions and neutral Mg atoms that give rise to Ca II K, H and Mg I lines. Mg atoms are destroyed by photons with eV; and Ca+ ions are created by photons with energies of eV and are destroyed by photons with eV. The nearly identical profile of He I*, Ca II and Mg I lines implies that all of the rest detected absorption lines should have the same velocity structure, because all of them originate from singly ionized ions with surviving conditions in between that of He+ and of Ca+ and neutral Mg.
| Species | E (cm-1) | log10N (cm-2) |
|---|---|---|
| Fe II | 0 | 14.760.10 |
| Fe II* | 385 | 14.110.17 |
| Fe II* | 668 | 13.920.29 |
| Fe II* | 863 | 13.790.40 |
| Fe II* | 977 | 13.520.56 |
| Fe II* | 1873 | 15.110.30aaHalf of the total equivalent width of Mg II doublet absorption lines. |
| Fe II* | 7955 | 13.271.89 |
| Fe II | Total | 15.340.5 |
| Ni II* | 8394 | 13.850.52 |
| Mn II | 0 | 13.31 0.47 |
For the Fe II UV1 and UV2 regimes displayed in Figure 7, the absorption lines are too heavily blended to fit them separately. As listed in Figure 3.2.2, We identified Fe II lines that arise from ground levels and from excited levels up to 7955 cm-1. Ni II∗ lines from the excited level of wavelength number 8395 cm-1 and Mn II lines from the ground level are also identified. All of the identified absorption lines were fitted simultaneously using the same optical depth profile generated above from the isolated lines (shown in the insert of Figure 7). We also calculated s of individual absorption lines by integrating the normalized flux of their models. The best-fitted column densities are summarized in Table 6 and the best-fitted model is compared with the observed absorption line spectrum in Figure 7.
This model recovers the observed data very well. This implies that the apparent optical depth (AOD) method, which was adopted to measure the column densities, is reasonable.
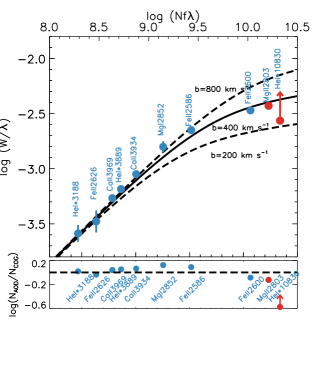
As pointed out by Jenkins (1986), large populations of absorption lines can be analyzed collectively using the standard, single-component curve of growth (COG) method. We combine the 3 components in SDSS J0802+5513 and perform such single-component COG analysis as a double-check to the AOD measurements. Five Fe II lines with span of about 1 dex (Table 3.2.2) were used to evaluate the best-fitted COG. We calculated theoretical COGs of various values and searched for the best match the measured s of the ground level Fe II lines. Both of and are free parameters during the fit. The best-fitted COG of Fe II lines is presented in Figure 8. We interpolated the measurements on the best fitted COG to infer COG column density for other transitions. The differences of column densities evaluated by the AOD and COG methods, log, are plotted in the lower panel of Figure 8. The differences are negligible within errors, for most lines, in order of 0.1 dex. The AOD method relies on two assumptions: (1) the absorption lines are completely resolved, and (2) the absorber fully covers the background emission source. The overall agreement between and indicates that the two assumptions are at least an acceptable approximation.
4 Physical Conditions and Location of the Absorption Gas
In this section, we explore the physical conditions of the absorption gas and locate the gas with the aid of photoionization model calculations and using the column densities of various ions/levels reliably measured in §3.2. Fe II* absorption lines that arises from excited levels are sensitive to the electron density (e.g. Arav et al. 2001a; Dunn et al. 2010) in absorbers. Moreover, He I* lines are a good diagnostics for constraining ionization parameter , which is defined as
| (1) |
where is the frequency corresponding the hydrogen edge, and is the emission rate of hydrogen ionization photons. Once and are well constrained, the distance of absorption gas can be inferred from Equation (1). We carry out detailed analysis using a photoionization model in §4.1, and discuss in §4.2 the possible dependence on metal abundances, SED of the background quasar, and dust reddening effects. We run photoionization code CLOUDY to carry out the model simulations (version c13.00; c.f. Ferland et al. 1998).
4.1 Basic Model
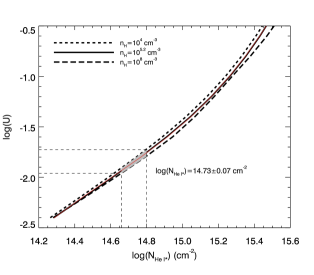
First we will show that the column density ratio observed in SDSS J0802+5513 requires the absorber to be thick enough to have a partially-ionized or neutral zone behind the hydrogen ionization front. We started by considering a gas slab with a density of and a total column density of , which is illuminated by quasar radiation (SED from Mathews & Ferland 1987, hereafter MF87). We calculated a grid of models by varying , , and , with metallicity fixed to solar abundance. As an example, we plot one result of the model calculations in Figure 9. The ionization structure is shown as a function of the depth parameter from the illumination surface. Transitions from different ionization state behaves differently in the plane, yielding a sensitive dependence of ion column density ratios on . This implies that these metal ion column density ratios are good constraints to the absorber thickness. Specifically, only the very narrow range, labeled by two vertical dashed lines in Figure 9, can produce the value of log observed in SDSS J08025513 for the adopted and . This is understandable considering that Fe II (and other singly-ionized metal ions or neutral atoms) and He I* 23S survive at different conditions.
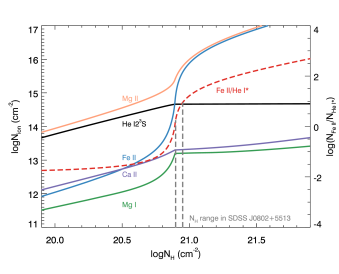
He I* 23S state is mainly populated by the recombination of a He+ ion with an electron. As increases, the main ionization state of helium changes from He++ to He+, resulting in a sharp increase in He I* 23S near the ionization front. Further into the cloud, the ionizing photons quickly run out and helium becomes almost neutral, which in turn prevents the generation of He I* 23S ions. However, the existence of such an ionization front does not prevent the formation of ions with lower ionization potentials, such as Ca II, Mg II and Fe II. As a result, continues to increase after the front. Therefore, once the gas abundance and the incident SED are appointed, ratio can give a tight constrain to the thickness of the absorber, provided the absorber is thick enough to generate the maximum . More importantly, this corresponds to a nearly unique value of for a large range of gas density .
As a demonstration, we have run an extensive grid of simulations with log varying from -2.5 to 0 with a step of 0.1 and log varying from 4 to 8 with step of 0.2. The upper limit of , cm-3, is determined by the fact that Balmer absorption lines, arising from excited hydrogen =2 level generated by collision, are not detectable in SDSS J0802+5513 (Leighly et al., 2011). The lower limit to the density can be set by equilibrium equation of the lowest Fe II excited level 385 cm-1 (de Kool et al. 2001). Using a two-level approximation,
| (2) |
where the subscripts 1 and 2 represent ground level and the 375 cm-1 level, respectively, and neglecting collisional term, we derive a lower limit of cm-3. The stop column density of cm-2 is so chosen to enclose a fully developed ionization front for the largest concerned888H II region scales approximately as loglog. In Figure 10, we show the model prediction of for a given set of and . The photoionization parameter is constrained to a very narrow range of by the observed 999The model simulations show an interesting fact that is strongly dependent on , but it is insensitive to . This suggests that, for the range of model parameters investigated, could be a good indicator to . To a rough approximation ( 0.1 dex error), we may neglect the effect of and adopt the following relation to estimate using only , (3) This empirical relation is consistent with the model results of well-studied individuals in the literature with He I* and Fe II* measurements. E.g., for the intrinsic absorber in QSO 23591241, detailed model calculations indicate a range of (Arav et al., 2001a), while the result from Equation (3) is . See §4.2 for detailed discussion on systematics including incident SEDs, metallicities, and dust reddening effect..
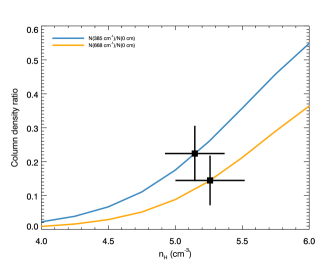
Using the median value of log, we calculated the column density ratios of the excited to ground level of Fe+ ions as a function of . Figure 11 presents the results of the 385 cm-1 and 668 cm-1 levels. The estimated density is 105.2±0.3 cm-3. Measurement uncertainties of higher levels are too large to estimate the electron density reliably. Note that this density is well within the aforementioned value range of – cm-3. We recalculated the model using the best estimates of log and 105.2 cm-3. The model calculation was stopped at =1021 cm-2 where the observed is reached. The model column densities are compared with the observed values in Figure 13. The observed column densities can be well reproduced by the model for all ions but Ca II, which is slightly under-estimated. We normalized the MF87 SED to the observed luminosity of SDSS J08025513 at the WISE w4-band (), and obtained an estimate of the ionizing photons rate of s-1, which should not be affected by reddening. Substituting and the best evaluates of and into Equation (1), we inferred an estimate to the distance of the absorption gas from the SMBH, pc. The inferred physical thickness of the absorber is pc, which is rather small compared to its distance from the central engine, .
4.2 Effect of SED, Metallicity, and Dust
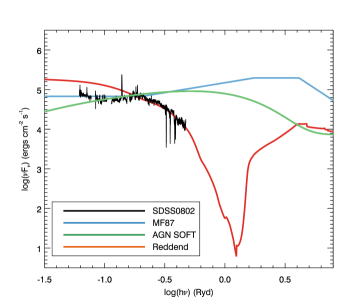
Only the MF87 SED and a solar abundance were considered in the basic model described above. Adopting different metallicities or incident SEDs might introduce systematics to model calculations. Neither was dust reddening taken into account in the calculations, and yet it is in fact observed in SDSS J0802+5513. In order to assess these possible systematics, we repeated the calculations adopting different metallicities and incident SEDs, and incorporating the effect of dust (including its effect on heating and cooling in the photoionized gas, as calculated with Cloudy). Two dust configurations were considered here. (1) Dust is uniformly mixed with the absorption gas. We use the pre-stored abundance set “H II region with grains” offered by CLOUDY as “Orion nebula dust”, which is essentially the average condition of the Orion Nebula (Baldwin et al. 1991; see the note of Table 7). In this case, metals are depleted into dust and the gas phase abundance is sub-solar. (2) The dust is in front of the absorber (a dust screen case). In this case, the dust resides in a very high ionized foreground gas (Dunn et al., 2010), which does not leave imprints on the observed spectra of the quasar but alters the shape the incident continuum. In Figure 12, we show the MF87 SED redden with =0.36 using the model extinction curve of “SMC bar” from Weingartner & Draine (2001) since there is no observed extinction curve available in the extreme ultraviolet (EUV). Also displayed in the figure is the standard AGN SED in hazy document (CLOUDY command: AGN T=1.5e5 K, a(ox)=-1.4, a(uv)=-0.5, a(x)=01). This SED has a big blue bump peaked at a lower energy than MF87, and we refer to it as “SOFT SED”.101010We have also considered cases where ionizing sources are in situ with the gas, e.g. stellar sources. For solar abundance, SEDs from young stellar populations (e.g. 1 Myr SSP from Leitherer et al. 1999) would result in similar results as SOFT SEDs do. In these cases, we cannot use this the infer the distance of gas from the central black hole, so we do not list these results in Table 7 for consistency. Yet the fact itself, that the starburst SEDs could generate observed ionic column density pattern, would fit in our preferred picture of starburst-driven gas flow in SDSS J0802+5513 (see §5 for detail)
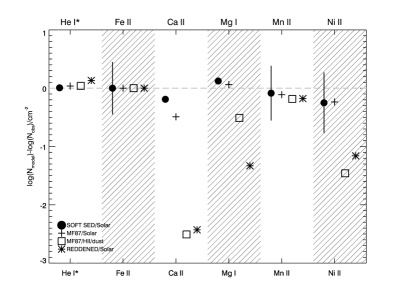
In all cases, and are adjusted to best match the observed and , and is fixed to be 105.2 cm-3. The results are summarized in Table 7 and are compared with observations in Figure 13. It can be seen there that models assuming a solar gas-phase abundance reproduce the observed column densities quite well, while dusty-gas models assuming an intrinsic solar abundance under-estimate and . This is expectable, since in these models the gas phase calcium and magnesium are heavily depleted into dust grains. The best-fit models yield Ca/H and Mg/H, more than one order of magnitude lower than the solar values. An intrinsic super-solar abundance is needed for the dusty-gas models to compensate metal depletion. To summarize, all of the acceptable models require and cm-2. The distances inferred from all models circulated in Table 7 are in the range of pc. Dusty-gas models in general require larger and accordingly infer a smaller distance compared with dust-free models.
| SEDaaThe column of this level seems strangely large compared to that of ground level, but similar result is seen in QSO 2359-1241, see Korista et al. (2008) | Z | U | NH | He I* | Fe II* | Ca II | Mg I | Mn II | Ni IIddTotal Ni II column density is inferred from observed column density of Ni II 8395 cm-1, using Boltzmann equation. |
|---|---|---|---|---|---|---|---|---|---|
| observation | 14.73 | 15.34 | 13.59 | 13.53 | 13.40 | 15.34 | |||
| MF87 | HII/DUSTbbAbundance set of H II region with dust, see Baldwin et al. (1991) and CLOUDY HAZY documentation. | -1.50 | 21.49 | 14.75 | 15.34 | 11.05 | 13.00 | 13.22 | 13.89 |
| MF87 | solarccAbundance set of Solar, see Grevesse & Noels (1993) and CLOUDY HAZY document. | -1.80 | 21.21 | 14.75 | 15.34 | 13.07 | 13.57 | 13.29 | 15.11 |
| SOFT | HII/DUST | -1.50 | 21.46 | 14.80 | 15.34 | 11.35 | 12.78 | 13.21 | 14.11 |
| SOFT | solar | -2.00 | 20.99 | 14.62 | 15.34 | 13.20 | 13.47 | 13.31 | 15.10 |
| Reddened MF87 | solar | -1.3 | 22.12 | 14.74 | 15.34 | 12.18 | 13.06 | 13.26 | 15.02 |
5 Origin of the Absorption Gas
The physical conditions and location of the absorption gas are well constrained by analyzing the absorption lines with the aid of photoionization model calculations. It is in the vicinity of the central engine with a distance of hundreds of parsecs. A laminal geometry of the absorber is inferred by comparing the physical thickness ( pc) with the distance. In addition, the kinematics of the absorption gas is derived by the profile of isolated lines. The centroid of the absorption lines observed in SDSS J0802+5513 perches right at the systematic redshift, and the line profile is almost symmetric in velocity space, spreading from km s-1 to km s-1. These information provides us important clues on the origin of the absorption gas.
The seemingly relatives to SDSS J0802+5513 are iron low-ionization broad absorption line (FeLoBAL) quasars, which are defined by the presence of BALs in excited states of Fe II and/or Fe III, in addition to commonly detected LoBALs, such as Mg II and Al III (e.g. Casebeer et al. 2008). The physical conditions of absorbing gas can be well constrained in a few FeLoBAL quasars, e.g., SDSS J03180600 (Bautista et al., 2010; Dunn et al., 2010), SDSS J0838+2955 (Moe et al., 2009), FBQS 0840+3633 (de Kool et al., 2002), QSO 2359-1241 (Bautista et al., 2010; Arav et al., 2001a). The inferred distance of the absorption gas, , is typically of sub-kpc or kpc-scale, similar to that of SDSS J0802+5513. Alike thickness in an order of magnitude of pc is found for these FeLoBAL gas either. Such a laminal geometry, , indicates that the absorption gas is generated right at the place it is observed. Because, if the absorber were produced in the immediate vicinity of the central SMBH, it would dissipate long before it arrives at the inferred location due to Kelvin-Helmholtz instability. Therefore the absorption gas of SDSS J0802+5513 should be generated in situ as that of the well-studied FeLoBAL quasars, the ionized gas of which is a consequence of radiative shocks from interaction of a quasar blast wave with dense interstellar clumps (Faucher-Giguère et al., 2012). However, the FeLoBALs are typically blueshifted by several thousand km s-1 with respect to the quasar systematic redshifts, unlike what we observed in SDSS J0802+5513. The symmetric line profile is hard to explain by the shock model, since an impact velocity is always needed to induce the shock stress. Although most of traditional BALs do not show the redshifted absorbing trough significantly, Hall et al. (2013) has identified a small sample of longward-of-system BAL quasars, which are somewhat resemblant to the absorption troughs in SDSS J0802+5513. The authors employed high-velocity infalls or rotationally dominated outflows to interpret the rarely observed phenomenon. For individual quasars of the sample (SDSS J101946.08+051523.7 possibly also SDSS J131637.26+003636.0), the absorbers are inferred to have a high density ( cm-3) and a small distance ( pc) from the the central SMBH, which are very different from that in SDSS J0802+5513 ( cm-3 and pc). Therefore, outflowing mechanism cannot explain the line profile observed in J0802+5513.
Other mechanisms that may drive the absorption gas in SDSS J0802+5513 involve various stellar processes, such as stellar winds, nova or supernova (SN) ejecta. A supernova may cast off gas shells with masses of to velocities of km s-1, sufficient to produce the expansion velocity of the absorption gas observed in SDSS J0802+5513. Though the masses of nova shells are much less than that of supernovas, their expansion velocities are typically km s-1 (Osterbrock & Ferland, 2006), similar to the maximum velocity of the absorption gas of SDSS J0802+5513. Before exploding as supernovas, winds of massive stars can remove more than half of the original mass. To some extreme cases, the terminal velocities of such stellar winds can reach as high as km s-1. The typical velocities are a few hundred km s-1 (Lamers & Cassinelli, 1999), within the velocity range of the gas expansion in SDSS J0802+5513. Thus the absorption gas of SDSS J0802+5513 could be generated by the stellar processes in the circumnuclear starburst rings, which are frequently observed in active galaxies.
An early study of 30 nearby Seyfert galaxies found in their well-resolved images that have inner rings, have outer rings, and have both (Simkin et al., 1980). This finding was confirmed by subsequent UV and optical observations of Seyfert 2 galaxies (e.g. González Delgado et al. 1998, 2001; Cid Fernandes et al. 2001, 2004). These observations reveal a typical size of a few hundred pc. About 40% nuclear starbursts are very vigorous () and compact ( pc). A similar conclusion was reached from NIR spectrophotometry of the central pc of 24 Seyfert galaxies (Riffel et al., 2009). The authors found signatures of young stellar populations in of the Seyfert 2 and most of the Seyfert 1 galaxies. Such circumnuclear starbursts were suggested to be directly coupled to the dusty torus, which is the key ingredient of AGN unification schemes (Antonucci, 1993; Urry & Padovani, 1995). The sizes of circumnuclear starbursts are similar to the estimated distance of the absorption gas in SDSS J0802+5513 ( pc from the galactic center). Interestingly, the gas-to-dust ratio of cm-2 mag-1, as the model evaluations in §4, is close to that of the interstellar medium (ISM) in the Milky Way (cm-2 mag-1, Bohlin et al. 1978). Also the inferred ratio of log for the absorption gas in SDSS J0802+5513 is within the range of as found in the Galactic ISM. Thus, we propose that the absorption gas in SDSS J0802+5513 coexists with the reddening material, which is very likely the ISM of the host galaxy skirting the dusty torus presumed by AGN unification models. This scenario also explains the rareness of absorption systems like SDSS J0802+5513. The line-of-sight should rightly penetrate the edge of obscuring material, where the radiation from central SMBH is mildly reddened.
Assuming stars are uniformly distributed in the circumnuclear starburst ring, we estimate the infalling mass rate induced by stellar process.
| (4) |
where g is the proton mass, is the column density, km s-1 the maximum expansion velocity, pc the distance, and the “height” of the absorption gas. We estimated assuming that the absorption gas were the periphery of the dusty torus and an absorbed AGN fraction of 111111Hasinger (2008) found that the absorbed AGN fraction is for , and increases with decreasing X-ray luminosity . Intriguingly enough, such a rough estimate is within the mass accretion rate range of SDSS J0802+5513 inferred in §3.1.
The proposed stellar processes are closely related to ongoing or recent star formation in the host galaxy. As a narrow line quasar, SDSS J0802+5513 may share some common properties with NLS1s, e.g. enhanced star formation (Sani et al., 2010). In Figure 14, we show distribution of [O II] EWs and [O II]/[Ne III] flux ratios for SDSS DR7 quasars. SDSS J0802+5513 has a larger [O II] EW and a higher [O II]/[Ne III] ratio as compared to the bulk of DR7 quasars, indicating possible enhanced star formation in this object. Under the assumption that all the [O II] emission is contributed by star formation, we estimate an upper limit of star formation rate of 11 yr-1 using the calibration of Kennicutt (1998) and tried to distinguish different stellar processes, namely stellar winds and supernova explosions.

Several stellar evolution phases can produce energetic stellar winds. Post-main-sequence stars near the ends of their lives often eject large quantities of mass (10-3 yr-1), but the velocities of those wind are typically 10 km s-1, far less than the velocity of gas in SDSS J0802+5513. The terminal velocity of early type stars may meet the velocity requirement, yet with lower mass loss rate. The wind in early type stars is only efficient at high luminosity (Kudritzki & Puls, 2000) with a mass loss rate of the order 10 yr-1 or even smaller (10 yr-1) for B stars (Krticka, 2014). The corresponding stellar mass should be . To account for the accretion rate, 5105 such stars are needed. For a Salpeter initial mass function from 0.1 to 125 , the required 5105 massive stars is equivalent to a total stellar mass of 10. Assuming a typical lifetime of 1 Myr for such high mass () stars, we can deduce that a star formation rate of 100 yr-1 is needed to supply the mass inflow. The required star formation rate is approximately an order of magnitude larger than the observed SFR in SDSS J0802+5513 even assuming all the [O II] emission (see Table 3) is contributed by star formation. It seems that the possibility of stellar winds accretion can be ruled out, although this probably could be the case in AGNs with much lower accretion rate such as Sgr A* (Cuadra et al., 2006), where a total stellar mass loss rate of 10-3 yr-1 (Najarro et al., 1997) is sufficient. Either a large amount of obscured star formation (Xiao et al., 2012) exists given the existence of moderate dust extinction in SDSS J0802+5513, or mechanisms other than stellar winds should be invoked.
On the other hand, supernova explosions could inject nearly all the mass of their progenitor into their surroundings and has been proposed to work even at very inner region of AGNs (Wang et al., 2010). SN explosions observed today are related to its past star formation history, in the means that a progenitor with mass will explode years later after its formation, with . If a constant star formation rate of 10 yr-1 such as in SDSS J0802+5513 holds for the past 100 Myr, i.e. the typical AGN life cycle (Wang et al., 2006), all stars with mass larger than 7 will explode today. Assuming a Salpeter IMF, a large fraction of star formation mass will be recycled into the ISM (Wang et al., 2010). In the case of SDSS J0802+5513, this adds up to a mass loss rate of 4 yr-1, given its star formation rate of 10 yr-1. It seems that supernova could supply enough gas provided that the star formation in the near past (100 Myr) is at least as intense as what is going on right now in SDSS J0802+5513.
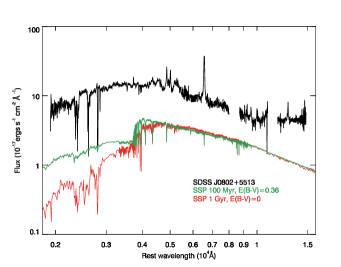
Underlying stellar populations in the host galaxies of AGNs could shed light on their past star formation history. It is difficult to extract information of the stellar component for high redshift AGNs as they outshine their hosts. For low redshift AGNs, for example in the quasar He I* absorber IRAS 14026+4341 (Jiang et al., 2013), Hamilton et al. (2002) measured the brightness of host galaxy by subtracting the nucleus in the high-resolution image observed by HST/WFPC2121212Wide Field Planetary Camera 2 , yielding a brightness ratio of host galaxy to nucleus 12%. In the case of SDSS J0802+5513, the residual fluxes underneath the flat-bottomed absorption troughs are at similar levels as observed in IRAS 14026+4341. The residual fluxes in multiple wavelengths provide a unique chance to put constraint on the stellar population of the host under the assumption that most of the residual light can be accounted for by the stellar component (Brotherton et al., 1997). Four such troughs are available in SDSS J0802+5513, namely Fe II UV1 and UV2 at 2600 Å and 2400 Å, respectively, Mg II doublet at around 2800 Å and He I* 10830, spanning from NUV to NIR. In Najita et al. (2000), four low-ionization BAL troughs in a reddened BAL quasar F1556+3517, located at 1860–2800 Å are utilized to put constraint on stellar populations. From the observed upper limit on the strength of the 4000 Å break, the author favors a reddened 50 Myr stellar population over a 1 Gyr one. Besides the evidence proposed in Najita et al. (2000), further constraint can be put on SDSS J0802+5513 with the aid of our new NIR spectroscopy of He I* 10380. As shown in Figure 15, SSPs with ages of 100 Myr and 1 Gyr from Bruzual & Charlot (2003) are normalized to the flux level at the bottom of He I* 10830 trough. Although older SSPs can mimic reddened young SSPs in optical–NIR band (i.e. the long-known age-dust degeneracy), the UV flux of older SSPs drops rapidly and fail to fit the UV absorption troughs in SDSS J0802+5513. Using saturated absorption lines as coronagraphs, we inferred that the host galaxy should consist of a significant population of reddened young (several hundred Myr or less) stars, indicating the recent star formation is probably as intense as required for supernova explosion powered winds. The above discussion should be understood with the caveat that, without further observations, we cannot tell if some of the light underneath the absorption trough is contributed by scattered light of the background quasar.
We conclude that supernova explosion seems to be most promising paradigm that drives the gas flow in SDSS J0802+5513 and we will end our discussion with a possible destiny of the gas following the line of reasoning. While the inflowing gas in SDSS J0802+5513 keeps feeding its central black hole, the outflowing gas would reach the outskirt out its host in 50 Myr, when the host will evolve into a post-starburst galaxies given the estimated age of underlying stellar population. The large scale outflows are ubiquitous in post-starbursts and the origin of these outflows remains a myth, both AGNs and starbursts have been proposed to driven the wind. Study on objects similar to SDSS J0802+5513 could help to resolve the problem.
6 Summary and Future Perspectives
We present detailed analysis of SDSS spectrum and newly obtained MMT, P200 and LBT spectra for SDSS J0802+5513. The object is classified as a NLS1 based on the widths of Balmer emission lines and Fe II emission strength. It’s moderately dust reddened with an extinction of . Its spectra show rare absorption lines of He I* and Fe II*, as well as lines from Ca II, Mg I, Mg II, Ni II and Mn II. The absorption lines show identical profile ranging from -750 to 750 km s-1, with its centroid at the same redshift as that determined from emission lines. This object is the first unshifted He I* min-BAL reported. Extensive photoionization models are calculated using CLOUDY, and He I* is shown to be a good indicator of ionization parameter. With the aid of the models, the physical parameters of the absorption gas are constrained to be log, cm-2, cm-3. The gas is estimated to be –250 pc away from central black hole. Various origins of the absorption gas are discussed and current observations suggest stellar processes are at work in driving the gas flow. Without further knowledge whether there exists hidden star formation in SDSS J0802+5513, mass losses from stellar winds of high mass stars fail to account for the deduced mass inflowing rate of 5 yr-1. The current data support supernova explosions as the main paradigm funneling the gas in SDSS J0802+5513.

Follow-up observations of SDSS J0802+5513 are needed to better study its properties: (1) mid-IR spectroscopies are needed to confirm if there is any hidden star formation, which will put firm constraint on the driving source of the gas flow; (2) polarization observations are needed to see if any polarized (scattered) light exists underneath the absorption trough and narrow band imaging centered at the absorption troughs will help to constrain the stellar population; (3) High resolution spectroscopies are useful to resolve the heavily blended absorption lines and to improve column density measurements; and 4) X-ray observations are helpful to determine total column density of the absorption gas.
Finally, we note that though very rare, SDSS J0802+5513 has similars. We show the spectra of the 7 unshifted He I* absorber candidates in Figure 16. Interestingly, all but one (SDSS J130952.89+011950.6) show a red color, like SDSS J0802+5513. Given the ubiquity of star formation ring in low redshift AGNs (Simkin et al. 1980), we might expect to detect much more similar objects than observed. The rarity could have an important implication on the geometry of the absorbers. If the nuclear star formation is co-plane with the dusty torus of quasars, optical spectroscopic surveys like SDSS will have little change to detect such dusty absorbers. Only when our sight lines are coincidently penetrating the edge of the torus with a moderate optical depth, such as those partially obscured quasars (Dong et al., 2005), can we detect absorbers like SDSS J0802+5513. Studies on these objects could reveal (1) the true nature of quasars with unshifted He I* absorption lines, (2) their possible connection with partially obscured quasars and (3) the role that starburst driven gas flows play in the coevolution of SMBH and stellar bulges.
References
- Antonucci (1993) Antonucci, R. 1993, ARA&A, 31, 473
- Arav et al. (2001a) Arav, N., Brotherton, M. S., Becker, R. H., Gregg, M. D., White, R. L., Price, T., & Hack, W. 2001a, ApJ, 546, 140
- Arav et al. (2001b) Arav, N., et al. 2001b, ApJ, 561, 118
- Baldwin et al. (1991) Baldwin, J. A., Ferland, G. J., Martin, P. G., Corbin, M. R., Cota, S. A., Peterson, B. M., & Slettebak, A. 1991, ApJ, 374, 580
- Bautista et al. (2010) Bautista, M. A., Dunn, J. P., Arav, N., Korista, K. T., Moe, M., & Benn, C. 2010, ApJ, 713, 25
- Becker et al. (1995) Becker, R. H., White, R. L., & Helfand, D. J. 1995, ApJ, 450, 559
- Brotherton et al. (1997) Brotherton, M. S., Tran, H. D., van Breugel, W., Dey, A., & Antonucci, R. 1997, ApJ, 487, L113
- Bruzual & Charlot (2003) Bruzual, G., & Charlot, S. 2003, MNRAS, 344, 1000
- Cartledge et al. (2005) Cartledge, S. I. B., et al. 2005, ApJ, 630, 355
- Casebeer et al. (2008) Casebeer, D., Baron, E., Leighly, K., Jevremovic, D., & Branch, D. 2008, ApJ, 676, 857
- Cid Fernandes et al. (2004) Cid Fernandes, R., Gu, Q., Melnick, J., Terlevich, E., Terlevich, R., Kunth, D., Rodrigues Lacerda, R., & Joguet, B. 2004, MNRAS, 355, 273
- Cid Fernandes et al. (2001) Cid Fernandes, R., Heckman, T., Schmitt, H., González Delgado, R. M., & Storchi-Bergmann, T. 2001, ApJ, 558, 81
- Condon et al. (1998) Condon, J. J., Cotton, W. D., Greisen, E. W., Yin, Q. F., Perley, R. A., Taylor, G. B., & Broderick, J. J. 1998, AJ, 115, 1693
- Cuadra et al. (2006) Cuadra, J., Nayakshin, S., Springel, V., & Di Matteo, T. 2006, MNRAS, 366, 358
- Cushing et al. (2004) Cushing, M. C., Vacca, W. D., & Rayner, J. T. 2004, PASP, 116, 362
- Davies (2009) Davies, R. 2009, in Physics of Galactic Nuclei
- Davies et al. (2009) Davies, R. I., Maciejewski, W., Hicks, E. K. S., Tacconi, L. J., Genzel, R., & Engel, H. 2009, ApJ, 702, 114
- Davies et al. (2007) Davies, R. I., Müller Sánchez, F., Genzel, R., Tacconi, L. J., Hicks, E. K. S., Friedrich, S., & Sternberg, A. 2007, ApJ, 671, 1388
- de Kool et al. (2002) de Kool, M., Korista, K. T., & Arav, N. 2002, ApJ, 580, 54
- Dong et al. (2008) Dong, X., Wang, T., Wang, J., Yuan, W., Zhou, H., Dai, H., & Zhang, K. 2008, MNRAS, 383, 581
- Dong et al. (2011) Dong, X.-B., Wang, J.-G., Ho, L. C., Wang, T.-G., Fan, X., Wang, H., Zhou, H., & Yuan, W. 2011, ApJ, 736, 86
- Dong et al. (2005) Dong, X.-B., Zhou, H.-Y., Wang, T.-G., Wang, J.-X., Li, C., & Zhou, Y.-Y. 2005, ApJ, 620, 629
- Drake et al. (2012) Drake, A. J., et al. 2012, in IAU Symposium, Vol. 285, IAU Symposium, ed. E. Griffin, R. Hanisch, & R. Seaman, 306–308
- Dunn et al. (2010) Dunn, J. P., et al. 2010, ApJ, 709, 611
- Faucher-Giguère et al. (2012) Faucher-Giguère, C.-A., Quataert, E., & Murray, N. 2012, MNRAS, 420, 1347
- Ferland et al. (1998) Ferland, G. J., Korista, K. T., Verner, D. A., Ferguson, J. W., Kingdon, J. B., & Verner, E. M. 1998, PASP, 110, 761
- Filiz Ak et al. (2014) Filiz Ak, N., et al. 2014, ApJ, 791, 88
- Gibson et al. (2009) Gibson, R. R., et al. 2009, ApJ, 692, 758
- Glikman et al. (2006) Glikman, E., Helfand, D. J., & White, R. L. 2006, ApJ, 640, 579
- González Delgado et al. (2001) González Delgado, R. M., Heckman, T., & Leitherer, C. 2001, ApJ, 546, 845
- González Delgado et al. (1998) González Delgado, R. M., Heckman, T., Leitherer, C., Meurer, G., Krolik, J., Wilson, A. S., Kinney, A., & Koratkar, A. 1998, ApJ, 505, 174
- Granato et al. (2004) Granato, G. L., De Zotti, G., Silva, L., Bressan, A., & Danese, L. 2004, ApJ, 600, 580
- Grevesse & Noels (1993) Grevesse, N., & Noels, A. 1993, Physica Scripta Volume T, 47, 133
- Hall et al. (2013) Hall, P. B., et al. 2013, MNRAS, 434, 222
- Hamann et al. (1997) Hamann, F., Barlow, T. A., & Junkkarinen, V. 1997, ApJ, 478, 87
- Hamilton et al. (2002) Hamilton, T. S., Casertano, S., & Turnshek, D. A. 2002, ApJ, 576, 61
- Hasinger (2008) Hasinger, G. 2008, A&A, 490, 905
- Hewett & Wild (2010) Hewett, P. C., & Wild, V. 2010, MNRAS, 405, 2302
- Hicks et al. (2009) Hicks, E. K. S., Davies, R. I., Malkan, M. A., Genzel, R., Tacconi, L. J., Müller Sánchez, F., & Sternberg, A. 2009, ApJ, 696, 448
- Hummer & Storey (1987) Hummer, D. G., & Storey, P. J. 1987, MNRAS, 224, 801
- Jenkins (1986) Jenkins, E. B. 1986, ApJ, 304, 739
- Ji et al. (2012) Ji, T., Wang, T.-G., Zhou, H.-Y., & Wang, H.-Y. 2012, Research in Astronomy and Astrophysics, 12, 369
- Jiang et al. (2013) Jiang, P., et al. 2013, AJ, 145, 157
- Kauffmann et al. (2003) Kauffmann, G., et al. 2003, MNRAS, 346, 1055
- Kennicutt (1998) Kennicutt, Jr., R. C. 1998, ARA&A, 36, 189
- Kewley et al. (2006) Kewley, L. J., Groves, B., Kauffmann, G., & Heckman, T. 2006, MNRAS, 372, 961
- Komossa (2008) Komossa, S. 2008, in Revista Mexicana de Astronomia y Astrofisica Conference Series, Vol. 32, Revista Mexicana de Astronomia y Astrofisica Conference Series, 86–92
- Komossa et al. (2006) Komossa, S., Voges, W., Xu, D., Mathur, S., Adorf, H.-M., Lemson, G., Duschl, W. J., & Grupe, D. 2006, AJ, 132, 531
- Korista et al. (2008) Korista, K. T., Bautista, M. A., Arav, N., Moe, M., Costantini, E., & Benn, C. 2008, ApJ, 688, 108
- Krticka (2014) Krticka, J. 2014, ArXiv e-prints
- Kudritzki & Puls (2000) Kudritzki, R.-P., & Puls, J. 2000, ARA&A, 38, 613
- Lamers & Cassinelli (1999) Lamers, H. J. G. L. M., & Cassinelli, J. P. 1999, Introduction to Stellar Winds, ed. Lamers, H. J. G. L. M. & Cassinelli, J. P.
- Leighly et al. (2011) Leighly, K. M., Dietrich, M., & Barber, S. 2011, ApJ, 728, 94
- Leighly et al. (2014) Leighly, K. M., Terndrup, D. M., Baron, E., Lucy, A. B., Dietrich, M., & Gallagher, S. C. 2014, ApJ, 788, 123
- Leitherer et al. (1999) Leitherer, C., et al. 1999, ApJS, 123, 3
- Lequeux et al. (1982) Lequeux, J., Maurice, E., Prevot-Burnichon, M.-L., Prevot, L., & Rocca-Volmerange, B. 1982, A&A, 113, L15
- Liu et al. (2014) Liu, W.-J., Zhou, H., & Ji, T. 2014, submitted to ApJS
- Lu et al. (2008) Lu, H., Wang, T., Yuan, W., Dou, L., Ge, J., Zhou, H., Wang, H., & Dong, X. 2008, ApJ, 680, 858
- Mathews & Ferland (1987) Mathews, W. G., & Ferland, G. J. 1987, ApJ, 323, 456
- Mathur (2000) Mathur, S. 2000, MNRAS, 314, L17
- Meusinger et al. (2012) Meusinger, H., Schalldach, P., Scholz, R.-D., in der Au, A., Newholm, M., de Hoon, A., & Kaminsky, B. 2012, A&A, 541, A77
- Misawa et al. (2003) Misawa, T., Yamada, T., Takada-Hidai, M., Wang, Y., Kashikawa, N., Iye, M., & Tanaka, I. 2003, AJ, 125, 1336
- Moe et al. (2009) Moe, M., Arav, N., Bautista, M. A., & Korista, K. T. 2009, ApJ, 706, 525
- Morrissey et al. (2007) Morrissey, P., et al. 2007, ApJS, 173, 682
- Müller Sánchez et al. (2009) Müller Sánchez, F., Davies, R. I., Genzel, R., Tacconi, L. J., Eisenhauer, F., Hicks, E. K. S., Friedrich, S., & Sternberg, A. 2009, ApJ, 691, 749
- Najarro et al. (1997) Najarro, F., Krabbe, A., Genzel, R., Lutz, D., Kudritzki, R. P., & Hillier, D. J. 1997, A&A, 325, 700
- Najita et al. (2000) Najita, J., Dey, A., & Brotherton, M. 2000, AJ, 120, 2859
- Nestor et al. (2008) Nestor, D., Hamann, F., & Rodriguez Hidalgo, P. 2008, MNRAS, 386, 2055
- Netzer et al. (2007) Netzer, H., et al. 2007, ApJ, 666, 806
- Osterbrock & Ferland (2006) Osterbrock, D. E., & Ferland, G. J. 2006, Astrophysics of gaseous nebulae and active galactic nuclei
- Osterbrock & Pogge (1985) Osterbrock, D. E., & Pogge, R. W. 1985, ApJ, 297, 166
- Peterson & Bentz (2006) Peterson, B. M., & Bentz, M. C. 2006, New A Rev., 50, 796
- Richards et al. (2006) Richards, G. T., et al. 2006, ApJS, 166, 470
- Riffel et al. (2009) Riffel, R., Pastoriza, M. G., Rodríguez-Ardila, A., & Bonatto, C. 2009, MNRAS, 400, 273
- Sani et al. (2010) Sani, E., Lutz, D., Risaliti, G., Netzer, H., Gallo, L. C., Trakhtenbrot, B., Sturm, E., & Boller, T. 2010, MNRAS, 403, 1246
- Schartmann et al. (2009) Schartmann, M., Meisenheimer, K., Klahr, H., Camenzind, M., Wolf, S., & Henning, T. 2009, MNRAS, 393, 759
- Schlegel et al. (1998) Schlegel, D. J., Finkbeiner, D. P., & Davis, M. 1998, ApJ, 500, 525
- Schneider et al. (2007) Schneider, D. P., et al. 2007, AJ, 134, 102
- Schneider et al. (2010) —. 2010, AJ, 139, 2360
- Shi et al. (2014) Shi, X., Zhou, H., , Wang, H., Jiang, P., & Ji, T. 2014, submitted to ApJ
- Simkin et al. (1980) Simkin, S. M., Su, H. J., & Schwarz, M. P. 1980, ApJ, 237, 404
- Skrutskie et al. (2006) Skrutskie, M. F., et al. 2006, AJ, 131, 1163
- Tsuzuki et al. (2006) Tsuzuki, Y., Kawara, K., Yoshii, Y., Oyabu, S., Tanabé, T., & Matsuoka, Y. 2006, ApJ, 650, 57
- Urry & Padovani (1995) Urry, C. M., & Padovani, P. 1995, PASP, 107, 803
- Vacca et al. (2003) Vacca, W. D., Cushing, M. C., & Rayner, J. T. 2003, PASP, 115, 389
- Vanden Berk et al. (2001) Vanden Berk, D. E., et al. 2001, AJ, 122, 549
- Véron-Cetty et al. (2004) Véron-Cetty, M.-P., Joly, M., & Véron, P. 2004, A&A, 417, 515
- Véron-Cetty et al. (2006) Véron-Cetty, M.-P., Joly, M., Véron, P., Boroson, T., Lipari, S., & Ogle, P. 2006, A&A, 451, 851
- Vestergaard & Wilkes (2001) Vestergaard, M., & Wilkes, B. J. 2001, ApJS, 134, 1
- Wada (2004) Wada, K. 2004, Coevolution of Black Holes and Galaxies, 186
- Wang et al. (2006) Wang, J.-M., Chen, Y.-M., & Zhang, F. 2006, ApJ, 647, L17
- Wang et al. (2010) Wang, J.-M., Yan, C.-S., Gao, H.-Q., Hu, C., Li, Y.-R., & Zhang, S. 2010, ApJ, 719, L148
- Weingartner & Draine (2001) Weingartner, J. C., & Draine, B. T. 2001, ApJ, 548, 296
- Wright et al. (2010) Wright, E. L., et al. 2010, AJ, 140, 1868
- Xiao et al. (2012) Xiao, T., Wang, T., Wang, H., Zhou, H., Lu, H., & Dong, X. 2012, MNRAS, 421, 486
- York et al. (2000) York, D. G., et al. 2000, AJ, 120, 1579
- Zhang et al. (2009) Zhang, K., Wang, T.-G., Dong, X.-B., Zhou, H.-Y., & Lu, H.-L. 2009, in Astronomical Society of the Pacific Conference Series, Vol. 408, The Starburst-AGN Connection, ed. W. Wang, Z. Yang, Z. Luo, & Z. Chen, 281
- Zhang et al. (2010) Zhang, S., Wang, T.-G., Wang, H., Zhou, H., Dong, X.-B., & Wang, J.-G. 2010, ApJ, 714, 367
- Zhou et al. (2010) Zhou, H., Ge, J., Lu, H., Wang, T., Yuan, W., Jiang, P., & Shan, H. 2010, ApJ, 708, 742
- Zhou et al. (2006a) Zhou, H., Wang, T., Wang, H., Wang, J., Yuan, W., & Lu, Y. 2006a, ApJ, 639, 716
- Zhou et al. (2006b) Zhou, H., Wang, T., Yuan, W., Lu, H., Dong, X., Wang, J., & Lu, Y. 2006b, ApJS, 166, 128
- Zuther et al. (2012) Zuther, J., Komossa, S., & Zhou, H. 2012, Journal of Physics Conference Series, 372, 012005