33email: nmaza@icate-conicet.gob.ar
A non-LTE spectral analysis of the 3He and 4He
isotopes
in the HgMn star Cancri††thanks:
Based on data products from observations made with ESO Telescopes
at the La Silla Paranal Observatory
under programme ID 076.B-0055(A).
Abstract
Aims. We present a pilot study on NLTE line-formation computations for the isotopes 3He and 4He in the mercury-manganese star Cancri. The impact of NLTE effects on the determination of isotopic abundances and the vertical stratification of helium in the atmosphere is investigated.
Methods. Modern NLTE line-formation computations were employed to analyse a high-resolution and high-S/N ESO-VLT/UVES spectrum of Cnc. The atmospheric parameters were determined from fitting the hydrogen Balmer lines and the spectral energy distribution. Multiple He i lines were investigated, including He i 4921 Å and 6678 Å, which show the widest isotopic splits.
Results. Half of the observed He i lines in the spectrum of Cnc show significant NLTE strengthening, the effects are strongest in the red lines He i 5875 Å and He i 6678 Å. NLTE abundances from individual He i lines are up to a factor of 3 lower than LTE values. Helium is found to be stratified in the atmosphere of Cnc. While the LTE analysis indicates a step-like profile of the helium abundance, a gradual decrease with height is indicated by the NLTE analysis. A 3He/4He ratio of 0.25-0.30 is found. With the available data it cannot be decided whether the two isotopes follow the same stratification profile, or not.
Conclusions. This work implies that NLTE effects may be ubiquitous in the atmospheres of HgMn stars and may have a significant impact on abundance determinations and the interpretation of the vertical abundance stratification of elements.
Key Words.:
stars: abundances – stars: atmospheres – stars: chemically peculiar – stars: early-type – stars: individual: Cancri1 Introduction
Mercury-manganese stars are chemically peculiar (CP) stars of the upper main sequence, with the line spectra of Hg ii and Mn ii indicating large overabundances of the two elements. They constitute Preston’s subgroup CP3 (Preston 1974). Their effective temperatures range between 10 500 and 16 000 K, corresponding to spectral types A0 to B6 (Smith 1996). Some other distinctive characteristics of these stars are low rotational velocities ( 29 km s-1, Abt et al. 1972) and overabundances of other elements such as P, Ga, Y, and Pt, with abundance patterns changing from one star to the other. They can show an inhomogeneous distribution of some chemical elements over their surface (first discussed by Hubrig & Mathys 1995), which causes the observed line-profile variability in the spectra (e.g. Hubrig et al. 2011). HgMn stars are members of binaries in more than 50% of the cases, with periods ranging between 3 to 20 days (Gerbaldi et al. 1985).
The chemical peculiarities in the atmospheres of HgMn stars arise because of their extremely stable atmospheres, exposing the atoms and ions to the competitive actions of gravitational settling and radiative levitation. The observed abundance peculiarities can in principle be explained within the framework of atomic diffusion (Michaud et al. 1979). Diffusion theory predicts that the photospheres of all HgMn stars should be deficient in helium, which was confirmed for instance in a dedicated study by Dworetsky (2004). The reason is that helium has only few and weak lines at wavelengths where the stellar flux is high (longward of the Lyman edge), therefore gravitational settling dominates. Dworetsky also found evidence for a vertical helium abundance stratification in two HgMn stars, which would also be a consequence of atomic diffusion in the atmosphere.
Moreover, helium is a particular case for the occurrence of differential effects of diffusion on the isotopes of an element. The mass difference between its two isotopes, 3He and 4He, is largest among the light elements, with gravitational settling favouring the heavier isotope. Some CP stars can therefore show enhanced 3He well above the protosolar 3He/4He ratio of (1.66 0.05)10-4 (Mahaffy et al. 1998). This is most pronounced for the (He-weak) 3He stars, which occupy a narrow strip in the – plane between the He-strong B stars and a group of He-weak B stars that show no evidence of 3He. However, the presence of a significant amount of 3He was also suggested for some HgMn stars (Hartoog & Cowley 1979).
Analyses of helium abundances in CP stars (and also for other elements) have so far mostly been performed under the assumption of local thermodynamic equilibrium (LTE). On one hand, this was possibly motivated by the early non-LTE (NLTE) study by Auer & Mihalas (1973), who found that the blue-violet He i lines are described well under the assumption of LTE in the temperature range below 15 000 K. On the other hand, this has also practical reasons because LTE line-formation can be much easier implemented than NLTE modelling. However, the quality of the observations has improved tremendously over the past decades, and we consider the topic worth to merit a re-visit in an era where quantitative spectroscopy can be performed at high precision and accuracy. A more consistent NLTE modelling of CP stars may therefore help in developing a quantitatively refined view of diffusion theory, which is required to explain the variety of observed abundance peculiarities even within one class of CP stars.
We chose the prototype HgMn star $κ$ Cancri (HD 78316, HR 3623) for a pilot study that aims at re-investigating the topic based on our latest NLTE models. This well-known sharp-lined star was reported to be a possible 3He star by Hartoog & Cowley (1979), who derived an upper limit on the 3He/4He ratio of 0.35, more than a thousand times higher than the protosolar value. The presence of 3He in the photosphere of this star was confirmed by Dobrichev et al. (1989) and Zakharova & Ryabchikova (1996), concluding on a value of the 3He/4He ratio of 0.35. These previous works were all based on LTE modelling and spectra at lower resolution than available today. Here, we investigate NLTE effects and their impact on the determination of (isotopic) abundances and the vertical stratification of helium, considering various He i lines.
2 Observational data
The spectrum employed in the present work was observed with Uves (UV-Visual Echelle Spectrograph, Dekker et al. 2000) on the ESO VLT/UT2 at Cerro Paranal inChile under the program 076.B-0055(A). We extracted the pipeline-reduced spectrum from the ESO Science Archive Facility. The spectrum was obtained in dichroic mode, covering the spectral range 3700-10 200 Å (with a small gap in the region of the near-IR calcium triplet), at resolving power = 110 000. The peak S/N ratio is 270. To normalize of the spectrum we fitted a spline function to a number of continuum windows.
In addition, (spectro-)photometric data were adopted from the literature to construct the spectral energy distribution (SED) of Cnc. photometry was adopted from Mermilliod (1991) and data from the Two Micron All Sky Survey (2MASS, Skrutskie et al. 2006). Two low-dispersion spectra that were observed with the International Ultraviolet Explorer (IUE) using a large aperture were extracted from the MAST archive111http://archive.stsci.edu/. The exposures SWP06911 and LWR05873 cover the range from 1150 to 1980 Å and from 1850 to 3290 Å.
| Parameter | Cnc |
|---|---|
| Sp. Type | B8 III |
| (mag) | 5.233 |
| (mag) | 0.113 |
| (mag) | 0.038 |
| (K) | 12800200 |
| (cgs) | 3.700.10 |
| (km s-1) | 0+1 |
| (km s-1) | 62 |
| (km s-1) | 42 |
3 Model calculations
We employed a hybrid NLTE approach for our line-formation calculations, which has been successfully used before for quantitative analyses of main-sequence OB stars (Nieva & Przybilla 2007, 2008), their evolved progeny (Przybilla et al. 2006a), and subdwarf B stars (Przybilla et al. 2006b). Model atmospheres were computed with the code Atlas9 (Kurucz 1993), which assumes plane-parallel geometry222The ratio of atmospheric thickness (geometrical height from the outer rim to the optical continuum-forming layers from the Atlas9 model) over stellar radius (determined from evolutionary mass and the surface gravity) is 1%. This means that sphericity effects are negligible here, despite the star’s classification as giant., chemical homogeneity, and hydrostatic, radiative, and local thermodynamic equilibrium (LTE). A value of triple solar metallicity was adopted for the model atmosphere calculations for Cnc, which is found to reproduce the low-resolution UV spectrum overall well.
Then, NLTE line-formation computations were performed with the codes Detail and Surface (Giddings 1981; Butler & Giddings 1985). Detail calculates atomic-level populations by solving the coupled radiative transfer and statistical equilibrium equations, and Surface computes the formal solution using realistic line-broadening functions. The following model atoms were employed: H (Przybilla & Butler 2004), He i (Przybilla 2005), and, for some supplementary calculations, O i/ii (Przybilla et al. 2000; Becker & Butler 1988, updated). To facilitate NLTE calculations for the 3He isotope in addition to the usual 4He, a 3He i model atom in analogy to that of 4He by Przybilla (2005) was realized, taking into account isotopic line shifts as measured by Fred et al. (1951). Both isotopes were treated simultaneously to account for the overlap of lines and continua.
Our approach allows LTE spectrum synthesis to be performed by running Surface only on top of the Atlas9 model. In this case, LTE level populations are computed while all other model ingredients remain unchanged, which facilitates assessing the impact of NLTE effects.
4 Atmospheric parameter determination
Cnc is a known single-lined spectroscopic binary (SB1) star. The system has been resolved among others by Schöller et al. (2010), who found a 2.5 mag difference in the band between the primary and the (later-type) secondary. Because the brightness ratio increases towards shorter wavelengths, we do not expect the available spectrum to be contaminated by any significant second light.
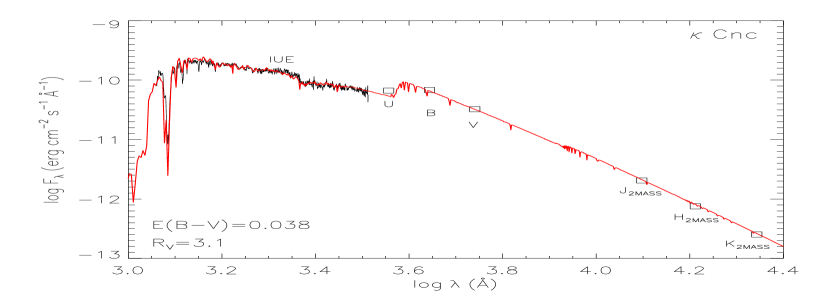
Therefore, the analysis of the observed spectrum followed a similar philosophy as previously employed by us for studies of normal B-type stars in Nieva & Przybilla (2007, 2012). We used the hydrogen Balmer lines and the SED as principal indicators to determine the effective temperature and the surface gravity . Supplementary indicators were two hydrogen Paschen lines and the ionization balance of O i/ii. A fine-tuning of the atmospheric parameters was achieved by multiple iterations aiming at reproducing all indicators simultaneously. At this stage of the analysis, an approximate average value for the helium abundance in the line-formation region was determined, which had to be assumed to be homogeneous throughout the entire atmosphere because of the basic assumptions made in Atlas9. Note that this introduces no restrictions to the further discussion, as helium behaves as a trace element in our case. A zero microturbulent velocity was adopted, which facilitates reproducing the weak and strong oxygen lines for one abundance value simultaneously. The (radial-tangential) macroturbulent velocity and projected rotational velocity were also determined based on fits to the oxygen lines. The finally adopted atmospheric parameters together with a few supplementary data are summarised in Table 1. Our is significantly lower (by up to 1000 K in the extremes) and the slightly lower than in earlier LTE analyses (e.g. Roby & Lambert 1990; Dworetsky & Budaj 2000; Adelman et al. 2004; Bailey & Landstreet 2013; Takeda et al. 2014). The higher temperatures are not compatible with the observed SED. On the other hand, our results agree excellently well with the atmospheric parameters adopted by Zakharova & Ryabchikova (1996) and Maza et al. (2011).
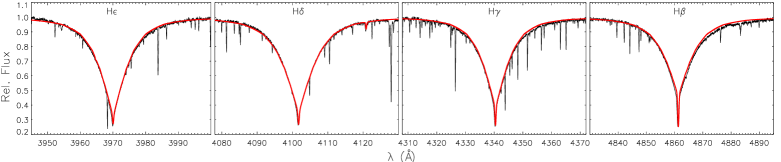
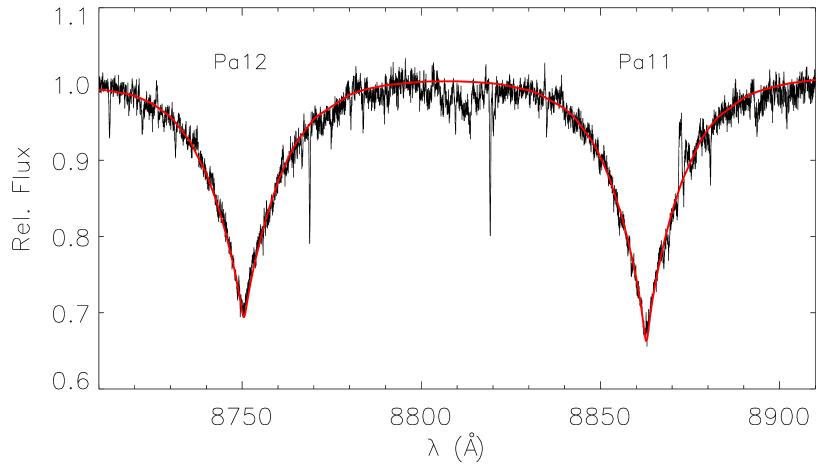
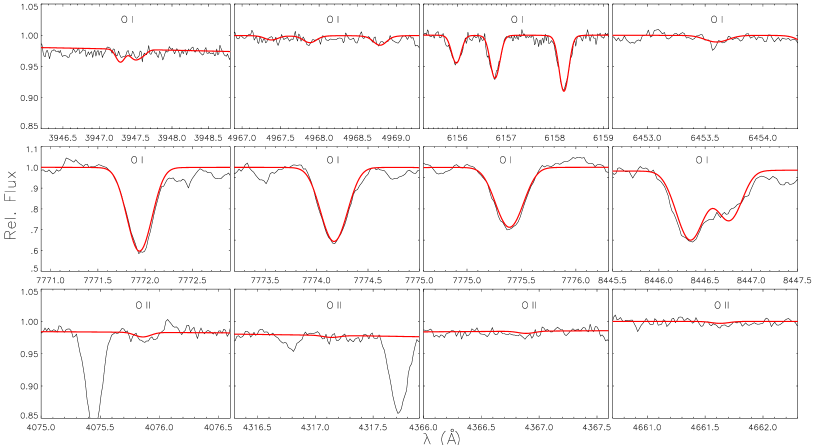
Figures 1 and 2 show a comparison of a global (by-eye) best-fit NLTE spectrum with H to H and the fit of the Atlas9 model flux to the observed SED. For the latter, the photometric data were converted into fluxes using zeropoints of Bessell et al. (1998) for Johnson photometry and of Heber et al. (2002) for the 2MASS photometry. All observed fluxes were de-reddened using an interstellar reddening law according to Cardelli et al. (1989), adopting a colour excess as indicated in Table 1 and a ratio of total-to-selective extinction = = 3.1. Overall, good agreement between model and observation is achieved. This also includes the confirmation of the atmospheric parameter determination by the secondary indicators, the Paschen lines P11 and P12 (the only useful lines from the near-IR region, see the online Fig. 3) and the O i/ii NLTE ionization balance (see the online Fig. 4). The latter is fulfilled for a homogeneous oxygen abundance of (O/H) + 12 8.40, without any indication for a depth-dependent abundance stratification of this element.

5 Helium abundance analysis
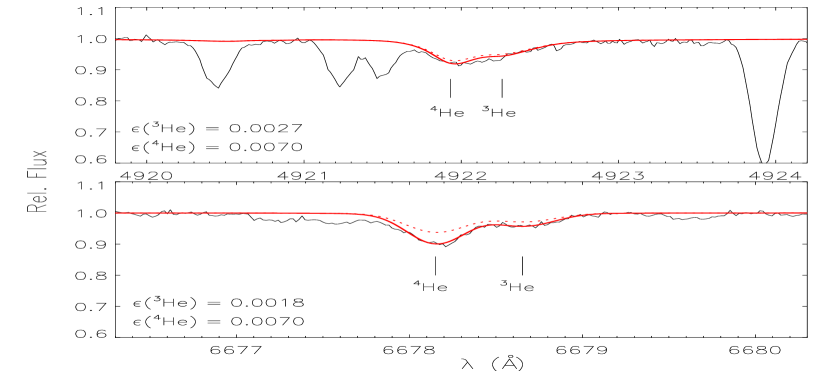
The visual inspection of the helium spectrum of Cnc shows two peculiarities. First, an asymmetry of He i 4921.9 Å and a resolved second component redwards of He i 6678.1 Å indicate the presence of the 3He isotope in the stellar atmosphere (see Fig. 5), confirming the detection of Hartoog & Cowley (1979) at much higher spectral resolution (cf. also Zakharova & Ryabchikova 1996). Second, the strongest among the diffuse He i lines, at 4026.2 Å and 4471.5 Å, show shallow cores in combination with unusually broad wings (see Fig. 6). This is a clear sign that the element is not homogeneously distributed throughout the atmosphere, but instead shows a vertical abundance stratification, which is unusual in HgMn stars and has been reported for only a few objects so far (Dworetsky 2004; Castelli & Hubrig 2007).
The quantitative analysis of the He i spectrum uses line-profile fits to the observed (largely) unblended features (He i 4009.3 Å, 5015.7 Å, and 5047.7 Å are strongly blended with metal lines). The individual best fits from the NLTE modelling to the two lines with resolved isotopic contributions are shown in Fig. 5. For comparison, LTE profiles for the same derived helium abundances are also shown. While NLTE strengthening is weak for the He i 4922 Å lines (note a weak blend by Fe ii 4922.19 Å, which is not accounted for in the modelling), He i 6678.1 Å shows pronounced NLTE effects. A helium abundance higher by a factor of almost 3 is indicated by the quantitative LTE analysis in the latter case. The 3He and 4He number fractions (He) derived from the NLTE and LTE analysis are summarised in Table 2, together with the Rosseland optical depths at which the line cores are formed. The abundance ratio 3He/4He is about 0.25 to 0.30 at the atmospheric depths covered by the observations, slightly lower than the value of 0.35 derived by Zakharova & Ryabchikova (1996).
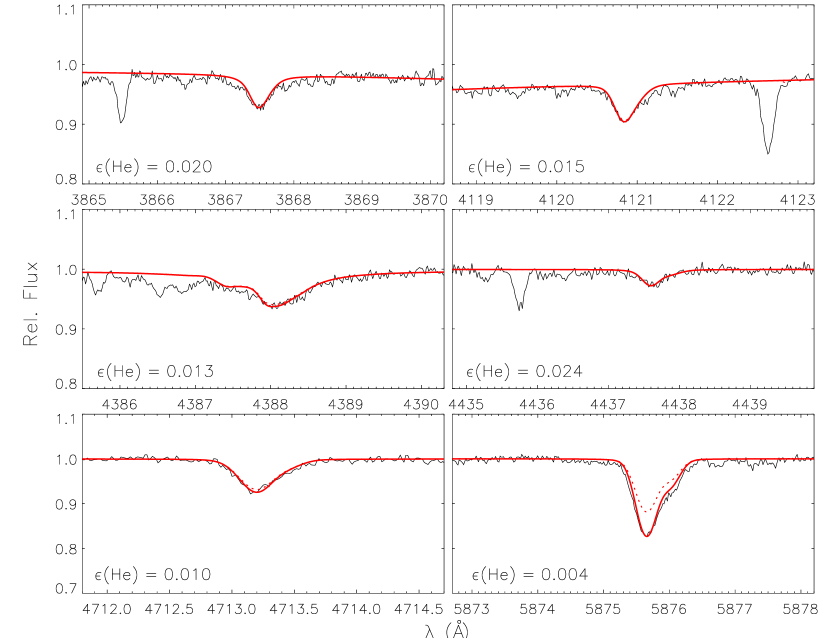
The isotopic shifts are much smaller in all other helium lines, such that only a combined abundance from both isotopes can be derived (we kept the 3He/4He ratio fixed to 0.3, consistent with the value range determined above during our modelling). For the strongest diffuse He i lines we performed a two-component fit (Fig. 6). One model was tuned to reproduce the line core, the other to reproduce the line wings. The derived abundances are summarised in Table 3 in analogy to Table 2. Data for the wings of the lines were evaluated 2 Å redwards of the line core. In the cores of the two lines, NLTE abundances are smaller than derived in LTE, by about 15% and 40%. The wings are unaffected by NLTE effects. Individual best fits to all other He i lines that were analysed here are shown in Fig. 7, with the results summarised in Table 3. Typically, NLTE effects are weak in these mostly weak lines. Strong effects are present only in He i 5875.6 Å, implying that the NLTE abundances are lower than the LTE values by a factor of almost 3.
NLTE effects.
Departure coefficients = (Zwaan definition, the and are the NLTE and LTE level population numbers) for the helium energy levels are displayed in Fig. 8 as a function of optical depth. He i is the main ion at the temperatures found in the visible layers of the atmosphere of Cnc. The population of the He i ground state shows practically no deviations from detailed equilibrium. The levels with principal quantum number = 2 are overpopulated relative to LTE values (the 2 1,3S levels are not shown in Fig. 8 for clarity, as they show qualitatively and quantitatively a very similar behaviour as the 2 1,3P∘ levels). This is because radiative (the 2 3S state is metastable) and collisionally induced decays to the ground state are inefficient, while the level populations are constantly fed by the recombination cascade from higher levels, which drains the populations of these. In consequence, all higher levels are underpopulated compared with the LTE values. They closely follow the behaviour of the He ii ground state. Detailed balance is approached for all levels at continuum formation depths (at 0.2-0.3) and below, the NLTE population numbers differ at most by a few percent from LTE values in the line-formation region (see Tables 2 and 3). The differences in the behaviour of the departure coefficients between 3He and 4He levels are negligible.
| (Å) | (He)NLTE | (He)LTE | |
|---|---|---|---|
| 4He i 4921.9 | 0.061 | 0.0070 | 0.0087 |
| 3He i 4922.3 | 0.001 | 0.0027 | 0.0032 |
| 4He i 6678.1 | 0.362 | 0.0070 | 0.0185 |
| 3He i 6678.7 | 0.256 | 0.0018 | 0.0032 |
| (Å) | (He)NLTE | (He)LTE | |
|---|---|---|---|
| 3867.5 | 0.179 | 0.020 | 0.020 |
| 4026.2 core | 0.045 | 0.007 | 0.008 |
| 4026.2 wing | 0.213 | 0.017 | 0.017 |
| 4120.8 | 0.105 | 0.015 | 0.016 |
| 4387.9 | 0.098 | 0.013 | 0.015 |
| 4437.6 | 0.142 | 0.024 | 0.024 |
| 4471.5 core | 0.146 | 0.008 | 0.011 |
| 4471.5 wing | 0.167 | 0.024 | 0.024 |
| 4713.2 | 0.001 | 0.010 | 0.012 |
| 5875.6 | 0.373 | 0.004 | 0.011 |

All the He i lines that were analysed here have either the 2 1P∘ or the 2 3P∘ level as the lower transition level and upper levels with a higher principal quantum number. Therefore, NLTE strengthening of the lines can occur as the consequence of overpopulated lower and underpopulated upper levels, depending on the formation depth. The (stronger) red He i lines are more sensitive to NLTE effects also because of the pronounced response of the line-source function to variations of the departure coefficients in the Rayleigh-Jeans limit (see e.g. Przybilla & Butler 2004). Even small differences in level populations on the percent-level can therefore result in fundamentally altered line strengths.
6 Discussion
Using abundances from lines of different strength – which sample the line-formation region to a different extent –, one can reconstruct the abundance profile, that is, the vertical abundance stratification of an element in the atmosphere. The run of the helium number fraction (He) with optical depth in the atmosphere of Cnc is shown in Fig. 9. The LTE analysis indicates a step-like helium stratification, dropping in the region 0.2 to 0.1 from a high abundance of (He) 0.25 to a constant value of about half of that farther outward in the atmosphere. On the other hand, the stratification derived from the NLTE analysis implies a gradual decrease of the helium abundance with decreasing optical depth, which is a qualitatively different behaviour. The NLTE abundances are lower by almost a factor 3 at the lowest optical depths that can be traced. Note that while the formation regions of the weaker lines agree well when computed under LTE and NLTE conditions, they can differ by up to 0.1 dex in for the stronger lines. The LTE computations indicate a formation of the line cores farther out in the atmosphere.
It would be highly interesting to know whether the two helium isotopes follow the same stratification profile, or if differential effects prevail. Unfortunately, with data from only two lines this cannot be decided here with confidence.
Finally, it may be appropriate here to comment on NLTE effects in CP stars in the general context, based on the present findings. The helium lines in Cnc are weak because of the rather low for populating the excited levels and because of the low helium abundance that is due to gravitational settling. Nevertheless, NLTE effects are found for all but the weakest He i lines, leading to changes in the derived abundances relative to an LTE analysis by up to a factor 3. On the other hand, most of the metals show large overabundances because of radiative levitation, yielding spectral lines much stronger than usually found in normal stars. The formation regions for the strong lines extend to much lower optical depths than investigated here, possibly giving rise to much stronger NLTE effects than encountered in the present work. More NLTE studies for CP stars are encouraged because this may have a significant effect on the results of elemental abundance determinations and on the deduced abundance stratifications.

Acknowledgements.
We thank V. Schaffernroth for helping us to improve the normalization of the observed spectrum. We also thank our anonymous referee for several suggestions that helped to improve the manuscript. NLM acknowledges a CONICET postdoc stipend and additional financial support by CONICET under the ‘Programa de financiamiento parcial de estadías breves en el exterior para becarios postdoctorales’, and MFN an equal opportunity FFL stipend from the University of Erlangen-Nuremberg. Financial support by the International Relations Office to a research stay of NLM at University of Innsbruck is gratefully acknowledged.References
- Abt et al. (1972) Abt, H. A., Chaffee, F. H., & Suffolk, G. 1972, ApJ, 175, 779
- Adelman et al. (2004) Adelman, S. J., Proffitt, C. R., Wahlgren, G. M., Leckrone, D. S. & Dolk, L. 2004, ApJS, 155, 179
- Auer & Mihalas (1973) Auer, L. H. & Mihalas, D. 1973, ApJS, 25, 433
- Bailey & Landstreet (2013) Bailey, J. D. & Landstreet, J. D. 2013, A&A, 551, A30
- Becker & Butler (1988) Becker, S. R. & Butler, K. 1988, A&AS, 74, 211
- Bessell et al. (1998) Bessell, M. S., Castelli, F., & Plez, B. 1998, A&A, 337, 321
- Butler & Giddings (1985) Butler, W. P. & Giddings, J. R. 1985, in Newsletter of Analysis of Astronomical Spectra, No. 9 (Univ. London)
- Cardelli et al. (1989) Cardelli, J. A., Clayton, G. C., & Mathis, J. S. 1989, ApJ, 345, 245
- Castelli & Hubrig (2007) Castelli, F. & Hubrig, S. 2007, A&A, 475, 1041
- Dekker et al. (2000) Dekker, H., D’Odorico, S., Kaufer, A., Delabre, B., & Kotzlowski, H. 2000, Proc. SPIE, 4008, 534
- Dobrichev et al. (1989) Dobrichev, V. M., Raikova, D. V., Ryabchikova, T. A., & Topil’skaya, G. P. 1989, Afz, 30, 91
- Dworetsky (2004) Dworetsky, M. M. 2004, in IAU Symposium, Vol. 224, The A-Star Puzzle, ed. J. Zverko, J. Ziznovsky, S. J. Adelman, & W. W. Weiss, 727
- Dworetsky & Budaj (2000) Dworetsky, M. M. & Budaj, J. 2000, MNRAS, 318, 1264
- Fred et al. (1951) Fred, M., Tomkins, F. S., Brody, J. K., & Hamermesh, M. 1951, Phys. Rev., 82, 406
- Gerbaldi et al. (1985) Gerbaldi, M., Floquet, M., & Hauck, B. 1985, A&A, 146, 341
- Giddings (1981) Giddings, J. R. 1981, Ph.D. Thesis (Univ. London)
- Hartoog & Cowley (1979) Hartoog, M. R. & Cowley, A. P. 1979, ApJ, 228, 229
- Heber et al. (2002) Heber, U., Moehler, S., Napiwotzki, R., Thejll, P., & Green, E. M. 2002, A&A, 383, 938
- Hubrig et al. (2011) Hubrig, S., González, J. F., Ilyin, I., et al. 2011, Astron. Nachr., 332, 998
- Hubrig & Mathys (1995) Hubrig, S. & Mathys, G. 1995, Comments on Astrophysics, 18, 167
- Kurucz (1993) Kurucz, R. L. 1993, CD-ROM No. 13 (SAO, Cambridge, Mass.)
- Mahaffy et al. (1998) Mahaffy, P. R., Donahue, T. M., Atreya, S. K., Owen, T.C., & Niemann, H.B. 1998, Space Sci. Rev., 84, 251
- Maza et al. (2011) Maza, N. L., Levato, H. O., López-García, Z. & Saffe, C. 2011, Bol. Asoc. Argentina Astron., 54, 101
- Mermilliod (1991) Mermilliod, J. C. 1991, Catalogue of Homogeneous Means in the UBV System (Institut d’Astronomie, Universite de Lausanne)
- Michaud et al. (1979) Michaud, G., Martel, A., Montmerle, T., et al. 1979, ApJ, 234, 206
- Nieva & Przybilla (2007) Nieva, M. F. & Przybilla, N. 2007, A&A, 467, 295
- Nieva & Przybilla (2008) Nieva, M. F. & Przybilla, N. 2008, A&A, 481, 199
- Nieva & Przybilla (2012) Nieva, M.-F. & Przybilla, N. 2012, A&A, 539, A143
- Preston (1974) Preston, G. W. 1974, ARA&A, 12, 257
- Przybilla (2005) Przybilla, N. 2005, A&A, 443, 293
- Przybilla & Butler (2004) Przybilla, N. & Butler, K. 2004, ApJ, 609, 1181
- Przybilla et al. (2000) Przybilla, N., Butler, K., Becker, S. R., Kudritzki, R. P., & Venn, K. A. 2000, A&A, 359, 1085
- Przybilla et al. (2006a) Przybilla, N., Butler, K., Becker, S. R., & Kudritzki, R. P. 2006a, A&A, 445, 1099
- Przybilla et al. (2006b) Przybilla, N., Nieva, M.F. & Edelmann, H. 2006b, Balt. Astron., 15, 107
- Roby & Lambert (1990) Roby, S. W. & Lambert, D. L. 1990, ApJS, 73, 67
- Schöller et al. (2010) Schöller, M., Correia, S., Hubrig, S. & Ageorges, N. 2010, A&A, 522, A85
- Skrutskie et al. (2006) Skrutskie, M. F., Cutri, R. M., Stiening, R., et al. 2006, AJ, 131, 1163
- Smith (1996) Smith, K. C. 1996, Ap&SS, 237, 77
- Takeda et al. (2014) Takeda, Y., Kawanomoto, S. & Ohishi, N. 2014, PASJ, 66, 23
- Zakharova & Ryabchikova (1996) Zakharova, L. A. & Ryabchikova, T. A. 1996, Astronomy Letters, 22, 152