Photometric properties of carbon stars in the Small Magellanic Cloud
Abstract
The Optical Gravitational Lensing Experiment identified over 1,800 carbon-rich Mira and semi-regular variables in the Small Magellanic Cloud. Multi-epoch infrared photometry reveals that the semi-regulars and Miras follow different sequences in color-color space when using colors sensitive to molecular absorption bands. The dustiest Miras have the strongest pulsation amplitudes and longest periods. Efforts to determine bolometric magnitudes reveal possible systematic errors with published bolometric corrections.
The Optical Gravitional Lensing Experiment (OGLE) has surveyed the Small Magellanic Cloud (SMC) for variables and transients. The OGLE-III experiment discovered over 4,500 Mira and semi-regular variables (SRVs). Carbon stars account for 315 of the Miras and 1,488 of the semi-regular variables (Soszyński et al. 2011).
To investigate the infrared (IR) photometric properties of the carbon-rich long-period variables (LPVs), we have searched multiple archival databases to generate a time-averaged spectral energy distribution for each source. The OGLE survey provides mean and data. The Two-Micron All-Sky Survey (2MASS), the deeper 2MASS 6x survey, and the Deep Near-Infrared Survey of the Southern Sky (DENIS) provide three or more epochs at and and two at (Skrutskie et al. 2006; Cioni et al. 2000). The SAGE-SMC survey (Surveying the Agents of Galactic Evolution), in combination with the S3MC survey (Spitzer Survey of the SMC), provides three epochs at 3.6, 4.5, 5.8, 8.0, and 24 m in the core of the SMC and two throughout the galaxy (Gordon et al. 2011; Bolatto et al. 2007). We have also turned to the Wide-field Infrared Survey Experiment (WISE) for additional temporal coverage at 3.4 and 4.6 m (Wright et al. 2010), which we use in conjunction with the Spitzer data at 3.6 and 4.5 m.
Our presentation in Vienna considered both the Large and Small Magellanic Clouds, but here, due to space restrictions, we focus on just the SMC. The results for the two galaxies are generally very similar.
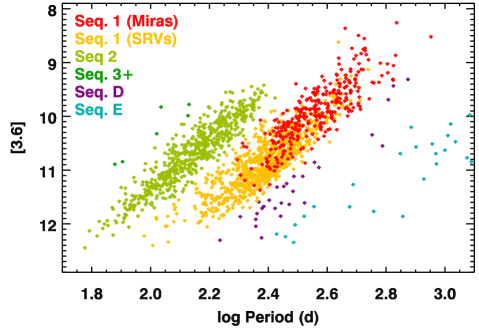
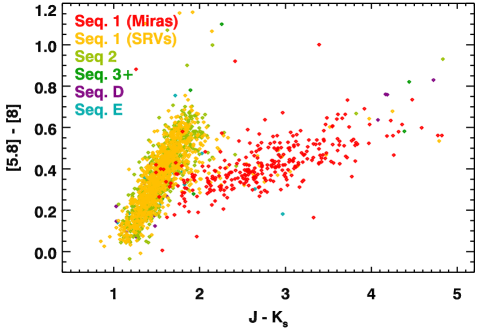
The OGLE-III survey provides three periods and amplitudes. We chose the first period and amplitude corresponding to Sequence 1-4 (adopting the nomenclature of Fraser et al. 2008). Figure 1 shows how most of the Miras and SRVs fall along Sequences 1 and 2, which are the fundamental pulsation mode and the first overtone, respectively (Wood & Sebo 1996). These sequences are the basis for the color-coding in Figures 1 and 2, with different colors to distinguish the Miras and SRVs on Sequence 1. The OGLE-III survey separates these two variability classes at an -band amplitude of 0.8 mag (peak-to-peak). Figure 2 shows how [5.8][8] and colors separate the Miras and SRVs relatively cleanly. Most of the SRVs fall on a sequence where [5.8][8] increases quickly as increases, while most of the Miras fall on a sequence which is much redder in and has a much shallower slope.
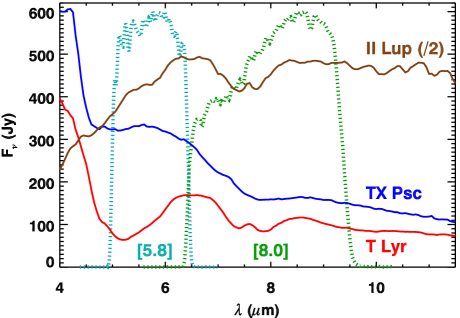
Figure 3 shows how the infrared spectra lead to two sequences, which we will refer to as the SRV and Mira sequences. Redder [5.8][8] colors on the SRV sequence, represented by TX Psc and T Lyr, result from increasing absorption from C3 at 4.5–6.0 m, which affects the 5.8 m bandpass. On the Mira sequence, represented by II Lup, redder colors result from increasing dust opacity.
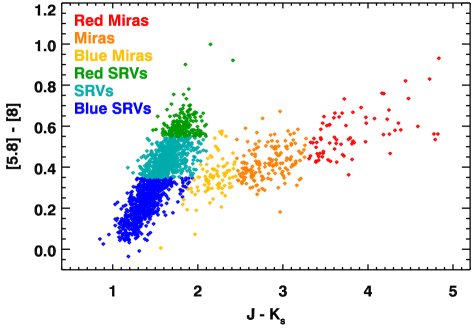
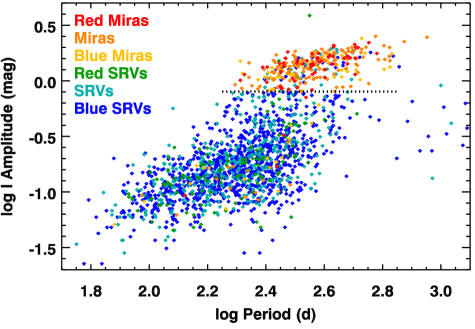
For the remaining figures in this contribution, we have adopted the color-coding defined in Figure 4, with blue to green depicting the SRV sequence in order of increasing [5.8][8] color and yellow to red tracking increasing color along the Mira sequence. Figure 5 shows how these different groups map into pulsation amplitude at and pulsation period. These groups improve on the boundary between Miras and SRVs adopted by the OGLE-III survey (at = 0.8 mag). The Mira sequence is associated with the larger amplitudes, and within this group, the dustier sources have the longest periods. This figure clearly links pulsation and dust production.
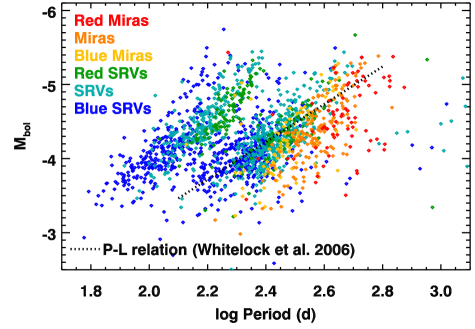
Comparing the bolometric magnitude and pulsation to theoretical evolutionary tracks allows one to estimate initial masses, but determining the bolometric magnitude from the available photometry is non-trivial. In Figure 6, the bolometric magnitudes are determined with bolometric corrections (BCs) based on (Whitelock et al. 2006). Two problems are apparent. The reddest and bluest sources on the SRV sequence have separated from each other, on both the overtone and fundamental modes. We call this problem the blue slip. It should be noted that we have applied the BC below the recommended limit of 1.5. On the fundamental mode, another problem which we describe as the red droop has shifted the apparent bolometric magnitudes of the reddest sources well below the expected P-L relation. Using BCs from other authors produces results similar to those illustrated here.
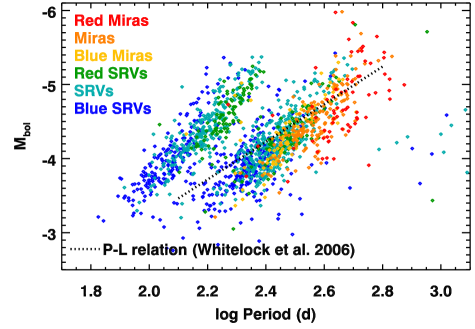
Figure 7 shows that BCs based on reduce both the blue slip and red droop, but not entirely in either case. (We have treated , [3.4], and [3.6] as equivalent here.) These problems probably arise from the BCs and are not intrinsic to the stars themselves. The need for improved means of determining bolometric magnitudes is readily apparent.
Bolatto, A. D., Simon, J. D., Stanimirović, S., et al. 2007,
ApJ, 655, 212
Cioni, M.-R., Loup, C., Habing, H. J., et al. 2000, A&AS, 144, 235
Fraser, O. J., Hawley, S. L., & Cook, K. H. 2008, AJ, 136, 1242
Gordon, K. D., Meixner, M., Meade, M. R., et al. 2011, AJ, 142, 102
Skrutskie, M. F., Cutri, R. M., Stiening, R., et al. 2006, AJ, 131,
1163
Sloan, G. C., Kraemer, K. E., Price, S. D., & Shipman, R. F. 2003,
ApJS, 147, 379
Soszyński, I., Udalski, A., Szymański, M. K., et al. 2011,
Act. Astron. 61, 217
Whitelock, P. A., Feast, M. W., Marang, F., & Groenewegen, M. A. T. 2006, MNRAS,
369, 751
Wood, P. R., & Sebo, K. M. 1996, MNRAS, 282, 958
Wright, E. L., Eisenhardt, P. R. M., Mainzer, A. K., et al. 2010,
AJ, 140, 1868