Active fluidization in dense glassy systems
Abstract
Dense soft glasses show strong collective caging behavior at sufficiently low temperatures. Using molecular dynamics simulations of a model glass former, we show that the incorporation of activity or self-propulsion, , can induce cage breaking and fluidization, resulting in a disappearance of the glassy phase beyond a critical . The diffusion coefficient crosses over from being strongly to weakly temperature dependent as is increased. In addition, we demonstrate that activity induces a crossover from a fragile to a strong glass and a tendency for clustering of active particles. Our results are of direct relevance to the collective dynamics of dense active colloidal glasses and to recent experiments on tagged particle diffusion in living cells.
pacs:
61.20.Ja, 64.70.D, 64.70.Q-Disordered assemblies of particles approaching the glass transition, either by lowering the temperature or by increasing the density, exhibit increasingly slow dynamics and strong caging of tagged particle movement. Recently, there has been a lot of interest in the collective behavior of dense assemblies of hard-sphere-like active or self-propelled particles close to the glass transition Berthier:14 ; Ni:13 ; Marchetti:11 ; Kranz:10 . In these systems, the glass transition is approached on increasing the packing fraction and the introduction of activity tends to fluidize the assembly by shifting the glass transition to higher packing fractions. The corresponding behavior in thermally controlled systems in which the glass transition occurs upon decreasing the temperature at constant density has not been explored till now.
Recent experimental studies of tagged particle diffusion in living cells make this question most pertinent. For instance, studies on tagged particle diffusion of cytoplasmic constituents revealed that bacterial cytoplasm exhibits characteristic glassy features such as caging, non-ergodicity and dynamical heterogeneity Bradley:14 in the absence of metabolic activity, and shows liquid-like features when subjected to activity through cellular metabolism. Likewise, microrheology studies of particles embedded in the cell nucleus show cage-hopping dynamics driven by active stress fluctuations arising from ATP-dependent chromatin remodeling proteins (CRPs) and complete caging in ATP-depleted conditions (or when the activity of CRPs is perturbed) Rao:12 . Recent microrheology work on gold particles attached to cytoskeleton-motor complexes shows the effects of non-thermal fluctuations in transporting particles over large scales Schmidt:07 ; weitz:14 . Such activity driven fluidization could play a significant role in transporting molecules over large scales, thereby regulating a variety of biochemical signaling reactions within the cell Abhishek .
Given the generality of these observations, we have studied, using molecular dynamics (MD) simulations, the effects of active driving in a generic model glass former, the Kob-Andersen binary mixture Kob:94 . Activity is introduced by assuming that a fraction of one kind of particles in the binary system experience a random active force that is correlated over a persistence time . Our main results are : (i) Activity fluidizes the glass and dramatically reduces the glass transition temperature; (ii) Tagged particle dynamics shows cage-hopping resulting in a late time diffusion coefficient that is weakly dependent on the temperature in the limit of large activity; (iii) The effect of activity on dynamical correlation functions in the liquid state is determined by a specific combination of and that provides a measure of the relative magnitude of the “active” stress with respect to the stress arising from interparticle forces; (iv) The phase diagram in the plane shows the complete disappearance of the glass phase beyond a threshold value of the activity; (v) The presence of activity decreases the kinetic fragility of the liquid; and (vi) Activity leads to local clustering of the self-propelled particles induced by the passive particles in the glassy medium.
We study the Kob-Andersen binary mixture using 800 A-type and 200 B-type particles interacting via the Lennard-Jones pair potential,
| (1) |
where is the distance between two particles and the indices , can be A or B. The values of and are chosen to be: , , , . We set a cut off in the potential at and shift it accordingly. We set the unit of length and energy by and fix the overall density at . Our MD simulation in three dimensions is carried out in the NVT-ensemble using a modified leap-frog integration scheme Brown:84 . The “temperature” T for both zero and finite activity is determined from the average kinetic energy of the particles.
We introduce activity only through a fraction of B-type particles, while the A-type particles remain passive. The active B-particles are randomly assigned self-propulsion forces of the form , where are , chosen so that the net momentum of the system remains conserved. After a persistence time the directions of are randomized by choosing a different set of , while respecting momentum conservation. This discrete 8-state clock realization of the random forces shows the same qualitative features as a continuous O(3) description and all the results reported here are obtained with this scheme.
To study the dynamics of the system, we measure the mean-square-displacement (MSD) of tagged particles, , as a function of time at different temperatures. Simultaneously, we record the two-point correlation function, , whose decay in time provides a measure of the dynamical slowing down in glassy systems,
| (2) |
where,
| (3) |
and represents an average over the time origin . Here, is the number of particles and the parameter is associated with the typical amplitude of vibrational motion of the particles. For all of our analysis we have used .
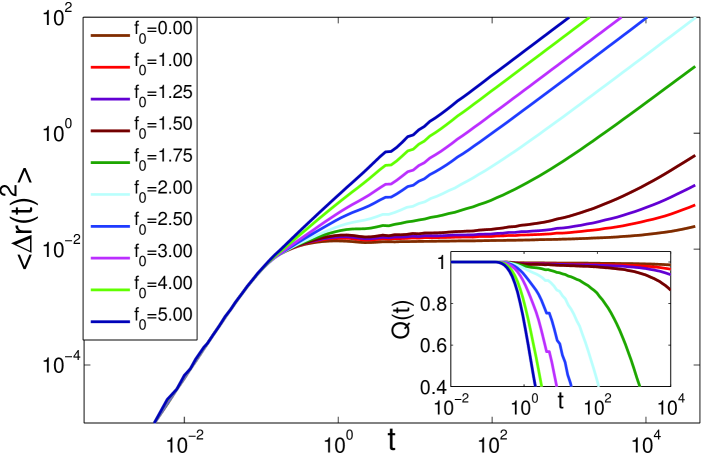
At high enough temperatures, , in the absence of activity (), the MSD increases ballistically () at short time scales, before crossing over to a diffusive () regime at late times. The associated decays exponentially to zero, characteristic of a liquid. On decreasing the temperature, the MSD begins to show a small plateau at intermediate times which grows as the temperature decreases further. Simultaneously, starts exhibiting multi-step relaxation, described by a stretched exponential function at long times. At very low temperatures, e.g. for , both the MSD and remain in the plateau region over the time scales of the simulation and do not show the late time diffusive part, indicating that the system has entered a glassy state. The self-diffusion constant , calculated from the long-time data for the MSD using the relation , shows that in the absence of activity, the diffusion constant decreases very rapidly with decreasing temperature.
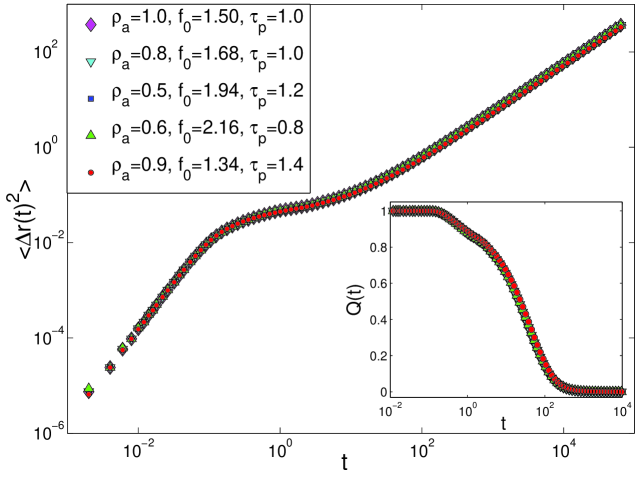
Introducing activity via self-propulsion leads to a dramatic change in the dynamical behavior of the system. The behavior of the MSD and , as illustrated in Fig. 1, clearly shows that the system fluidizes from the glassy state - particles escape from their cages without showing any sign of the intermediate plateau. At high enough activity, the diffusion constant shows a large enhancement and appears to be only weakly dependent on the temperature (see Fig. 4). While activity is described by the 3 independent parameters , , , it is the combination that appears to control the dynamical behavior in the fluidized phase. When plotted for a fixed value of with different choices of , , , many dynamical quantities show a collapse, as shown in Fig. 2. The quantity appears naturally in a heuristic calculation of the effects of activity, based on a simple Langevin model (see the Supplementary Information). As discussed there, when this quantity is made dimensionless by dividing it by an appropriate combination of parameters characterizing the interparticle forces, it provides a measure of the relative magnitude of the active force with respect to typical interparticle forces.
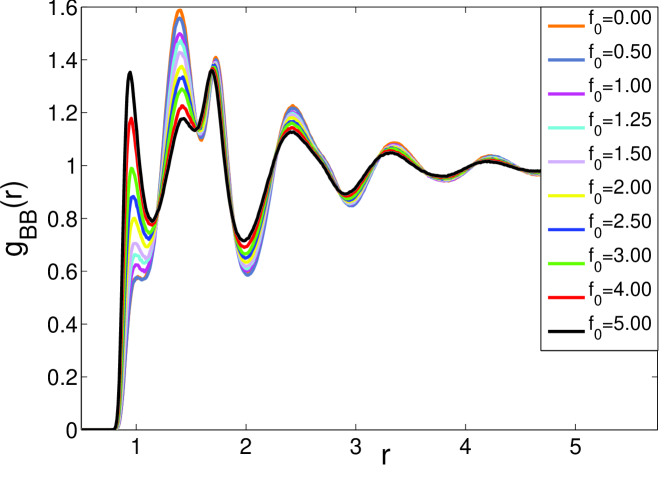
To check whether this activity induced fluidization is accompanied by a significant change in the structure of the liquid, we have calculated the radial distribution functions , defined by
| (4) |
where is the number of particles of type ( or ). We find that is more significantly affected by activity than and (Fig. 3 and Fig. S2 in Supplementary Information), and shows more liquid-like features as is increased. Also, the height of the first peak of decreases and a new peak at a smaller value of develops with increasing . This observation suggests that there is an activity-induced clustering tendency in the B-type particles, mediated by the correlations of the A particles. The clustering tendency is confirmed from a calculation (see the Supplementary Information) of the size distribution of the clusters formed by B-type particles.
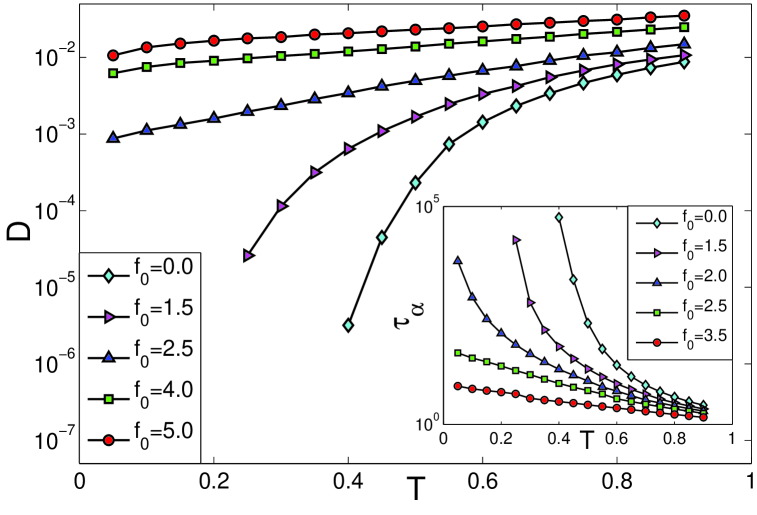
The strong effect of activity on the dynamics is seen very clearly in Fig. 4 where the temperature dependence of the long-time diffusion coefficient has been shown for different values of the self-propulsion force . The rapid decrease in with decreasing for is replaced by a much weaker temperature dependence for large . At any temperature, the diffusion constant increases as is increased from zero. This behavior is qualitatively different from that reported in Ref. Berthier:14 where the diffusion constant was found to decrease with increasing activity at relatively low densities (equivalent to relatively high temperatures in our system), causing a crossing of vs. plots for different strengths of the activity. In our system, vs. plots for different come closer to each other as is increased, but they do not cross. This behavior is qualitatively similar to that observed in Ref. Ni:13 .
Activity-induced fluidization is also seen in plots of the -relaxation time , extracted from the decay of (), vs. for different (inset of Fig. 4). To extract a glass transition temperature from the data for the -relaxation time, we fit to the well-known Vogel-Fulcher-Tammann (VFT) form,
| (5) |
where is the kinetic fragility, is the relaxation time at high temperatures, and is the activity dependent (putative) glass transition temperature at which the relaxation time extrapolates to infinity.
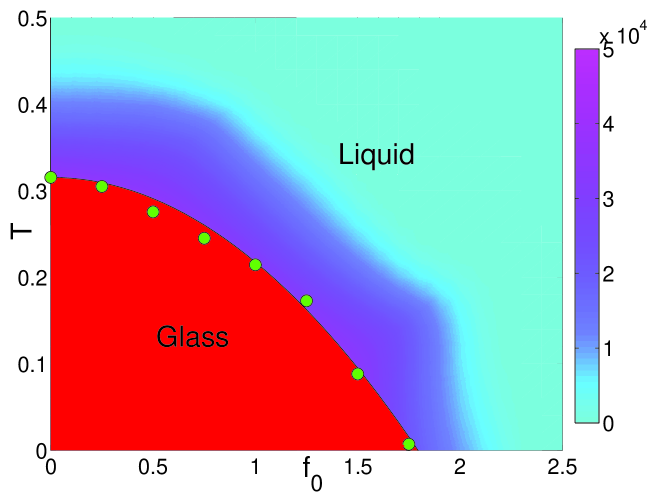
In the absence of activity, in reduced Lennard-Jones units. The values of for different values of allow us to construct a phase diagram in the plane (Fig. 5). This shows that even at low temperatures, there is a threshold activity beyond which one may exit the glassy phase into the liquid. The magnitude of , displayed as a color plot in Fig. 5, shows a sharp increase near the phase boundary. The region displayed in red color in Fig. 5 represents infinite according to the VFT form. In this phase diagram, the glass transition temperature, defined as the temperature at which would diverge if the VFT form continues to describe its temperature dependence, approaches zero for a finite value of the active force . This is qualitatively different from the behavior found in Refs. Berthier:14 and Ni:13 in which a (putative) glass transition was found to be present for all finite values of the strength of the activity. This important observation tells us that some of the effects of activity on the glass transition are sensitive to the nature of the system (whether driven by temperature or density) and the details of the self-propulsion mechanism. This observation is consistent with general expectations derived from a study kurchan of dynamic arrest in a mean-field spin-glass model with non-thermal fluctuations.
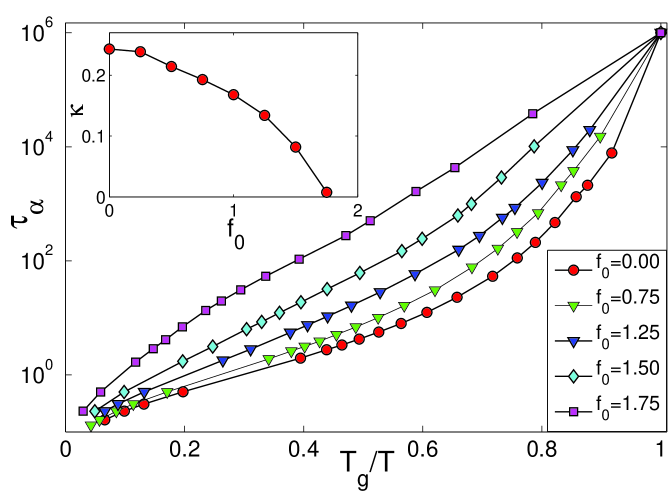
Figure 6 shows so-called “Angell Plots” - vs , where , the analog of the experimentally determined glass transition temperature at which the viscosity is poise, is obtained from the definition . The curvature of the plots decreases with increasing , indicating that the fragility decreases with increasing activity. The dependence of the kinetic fragility obtained from the VFT fits on the active force (see the inset of Fig. 6) exhibits the same trend, indicating that the activity makes the glass stronger. This is opposite to the behavior of the hard-sphere system studied in Ref. Ni:13 - the fragility was found to increase with increasing activity in that work.
To summarize, we have demonstrated activity driven fluidization in a model glass former at low temperatures and a concomitant reduction of the glass transition temperature with increasing activity. This fluidization is accompanied by a crossover from caging dynamics to diffusive transport at long times. The late-time diffusion coefficient in the activity-induced fluid phase is weakly dependent on the temperature. We display a phase diagram in the plane that suggests that the glass transition temperature goes to zero at a finite threshold value of . The shape of the phase boundary has been rationalized from a simple calculation (Supplementary Information). This calculation also brings forth the possibility of existence of a single control parameter in the form of , constructed from the three parameters , and that characterize the effects of activity on the dynamics of the system. In the fluid phase, different combinations of the parameters , and that give a constant value of lead to the same time dependence of dynamical quantities such as the MSD and . However, the same behavior is not observed below . We have also observed an activity induced clustering of the self-propelled particles. The kinetic fragility of the glass former has been found to decrease with increase in activity.
The results obtained here are very general and should be relevant to a large variety of dense colloids where chemical
activity can induce fluidization Bradley:14 ; Angelini:11 . This work also makes contact with many reports
of glassy behavior and activity induced fluidization in cells and tissues. We are currently exploring variants of this
model to explain specific features of caging and fluidization observed in the cell surface and the nucleus.
We thank Saurish Chakrabarty and Akshay Bhatnagar for useful discussions. R. M. and P. J. B. acknowledges financial support from CSIR, India. C. D. acknowledges financial support from DST, India. M. R. acknowledges a grant from the Simons Centre.
References
- (1) L. Berthier, Phys. Rev. Lett. 112, 220602 (2014).
- (2) R. Ni, M. A. C. Stuart and M. Dijkstra, Nat. Commun. 4, 2704 (2013).
- (3) S. Henkes, Y. Fily and M. C. Marchetti, Phys. Rev. E 84, 040301(R) (2011).
- (4) W. T. Kranz, M. Sperl and A. Zippelius, Phys. Rev. Lett. 104, 225701 (2010).
- (5) Bradley R. Parry et al. Cell 156, 1-12 (2014).
- (6) T. E. Angelini et al. Proc. Nat. Acad. Sci. USA 10, 1073 (2011).
- (7) F. M. Hameed, M. Rao and G. V. Shivashankar, PLOS ONE 7,10, e45843 (2012).
- (8) N. Fakhri, A. D. Wessel, C. Willms, M. Pasquali, D. R. Klopfenstein, F. C. MacKintosh and CF Schmidt, Science, 344, 1031 (2014).
- (9) M. Guo, A. J. Ehrlicher, M. H. Jensen, M. Renz, J. R. Moore, R. D. Goldman, J. Lippincott-Schwartz, F. C. Mackintosh and D. A. Weitz, Cell 158, 822–832 (2014).
- (10) A. Chaudhuri, B. Bhattacharya, K. Gowrishankar, S. Mayor and M. Rao, Proc. Nat. Acad. Sc. 108, 14825-14830 (2011).
- (11) D. Brown and J. H. R. Clarke, Mol. Phys. 51, 1243 (1984).
- (12) W. Kob and H. C. Andersen, Phys. Rev. Lett. 73, 1376 (1994).
- (13) L. Berthier and J. Kurchan, Nature Physics 9, 310 (2013).