Probing the Mott Physics in -(BEDT-TTF)2X Salts via Thermal Expansion
Abstract
In the field of interacting electron systems the Mott metal-to-insulator (MI) transition represents one of the pivotal issues. The role played by lattice degrees of freedom for the Mott MI transition and the Mott criticality in a variety of materials are current topics under debate. In this context, molecular conductors of the -(BEDT-TTF)2X type constitute a class of materials for unraveling several aspects of the Mott physics. In this review, we present a synopsis of literature results with focus on recent expansivity measurements probing the Mott MI transition in this class of materials. Progress in the description of the Mott critical behavior is also addressed.
pacs:
72.15.Eb, 72.80.-r, 72.80.Le, 74.70.KnI Introduction
A tiny change in physical parameters can sometimes have dramatic consequences. This is particularly true in correlated condensed matter systems in which a small alteration in pressure, chemical composition, or temperature can tune a system across a phase transition. In this context, the Mott metal-to-insulator (MI) transition represents one of the most remarkable examples of electronic correlation phenomena. In contrast to conventional band insulators in which all bands are either filled or empty, the Mott insulating state is driven by interactions and emerges once the ratio of the electron-electron interaction to the hopping matrix element (kinetic energy) exceeds a critical value. It is essentially this ratio which is tuned in many experiments. Molecular conductors of the -phase of (BEDT-TTF)2X (where BEDT-TTF refers to bisethylenedithio-tetrathiafulvalene, i.e. C10S8H8, and X to a monovalent counter anion), usually called charge-transfer salts, have been recognized as model systems to investigate electronic correlations in two dimensions. In particular, single crystals of wholly deuterated charge-transfer salts of the phase with X = Cu[N(CN)2]Br have been attracting broad interest due to fact that they lie in the vicinity of a first-order phase transition line in the phase diagram Kawamoto1997-20 , which separates the metallic from the insulating state, thus giving the possibility of investigating the Mott MI transition using temperature as a tuning parameter. One result to be discussed in detail in the frame of this paper refers to the first experimental observation of the role played by lattice degrees of freedom for the Mott MI transition in the above-mentioned materials Mariano20f1 . Both the discontinuity and the anisotropy of the lattice parameters observed via high-resolution thermal expansion experiments indicate a complex role of the lattice effects at the Mott MI transition for the -(BEDT-TTF)2X charge-transfer salts, which cannot be interpreted simply by taking into account a purely 2D electronic model. Furthermore, in the frame of the present work, a model based on the rigid-unit modes scenario is proposed to describe the negative thermal expansion above the so-called glass-like transition temperature 77 K in deuterated charge-transfer salts of -(BEDT-TTF)2Cu[N(CN)2]Br and parent compounds.
From a theoretical point of view, perturbative approaches and their generalizations are restricted to the regimes and and have difficulties in addressing phase transitions. In fact, they entirely fail in addressing the critical behavior in the immediate vicinity of a putative critical point. Instead, it is advantageous to start from the critical point itself and use concepts of scaling to describe its vicinity. We will review here how some aspects of the lattice response observed in Refs. Mariano20f1 and Thesis, can be understood in terms of such a scaling theory Bartosch ; Zacharias .
The compound -(BEDT-TTF)2Cu2(CN)3 is another material which attracted great interest in the last few years, see, for instance LABEL:Yamashita2008 and references cited therein. This system has an almost perfect quasi-2D frustrated triangular lattice with a ratio of hopping integrals close to . Interestingly enough, while the ratio / shows a monotonic temperature dependence, the degree of frustration as a function of temperature presents a non-monotonic behavior and becomes more pronounced at low temperatures Harald .
Up to now, no clear experimental evidence of magnetic ordering in -(BEDT-TTF)2Cu2(CN)3 has been reported in the literature Shimzu2003 . Thus, this system has been
recognized as a candidate for the realization of a spin-liquidBalents10 . At
= 6 K, a crossover from a paramagnetic Mott insulator to a genuine
quantum spin-liquid has been proposed
Yamashita2008 . Nevertheless, the physical nature of such
a crossover, sometimes called hidden ordering, is still
controversial. Expansivity measurements performed on this material
revealed a pronounced phase-transition-like-anomaly at = 6 K, which
coincides nicely with specific heat results reported in the
literature Yamashita2008 . These results provide strong
evidence that this lattice instability at = 6 K is directly
linked to the proposed spin-liquid phase.
The electronic properties of -(BEDT-TTF)2X charge-transfer salts have been reported in various review articles, see, for instance Refs. Lang20a ; Lang2004-9c ; Ishiguro20 ; Jerome1991-20 ; Mckenzie1998-20 ; Wosnitza2000-20 ; Singleton2002-20 ; Myagawa2004-20 ; Fukuyama2006-20 ; Mori2006-20 ; Kanoda2006-20 ; Powell2006-20 ; Lang4 ; Kanoda11 ; Powell11 . Here we focus on topics linked to dilatometric studies of the -(BEDT-TTF)2X salts. Some parts of this review are based on the Ph.D. thesis of one of us Thesis . Before giving a detailed outline of the main body of this review article at the end of this introductory chapter, let us first briefly review some general properties of the -(BEDT-TTF)2X salts and discuss their crystallographic structure in Subsection I.1, their phase diagram in Subsection I.2 and the most relevant experimental results from the literature related to this work in Subsection I.3.
I.1 The (BEDT-TTF) molecule and crystallographic structure of the -ET salts
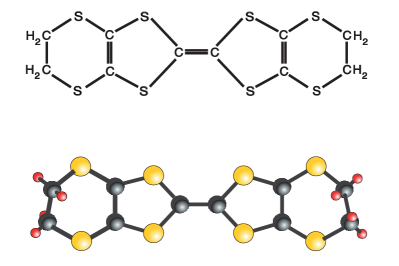
The basic entity which furnishes the structure of the present class of organic conductors is the (BEDT-TTF) molecule, usually abbreviated simply to ET. The structure of the ET molecule is shown in Fig. 1. As a result of the two distinct possible configurations of the ethylene end groups in their extremes (known as staggered and eclipsed configurations), the ET molecule is not completely planar. It has been proposed that the degrees of freedom of the ethylene end groups can influence the electronic properties of the salts of the -family, cf. LABEL:Jens2002-20 and references cited therein. Employing infra-red imaging spectroscopy, the authors of LABEL:Sasaki2004-20 reported on the sensitivity of the vibration mode of the central C=C bonds, the so-called mode, upon going from the metallic to the insulating state.
In the following, let us briefly discuss the various phases in which ET charge-transfer salts can crystallize.
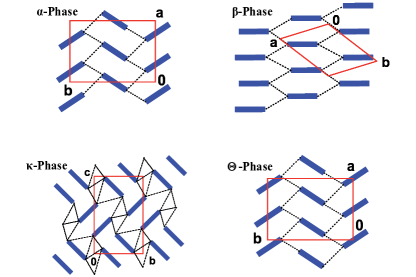
During the crystallization process of the (ET)2X salts, the ET molecules can assume different spatial arrangements, giving rise to different phases. Several thermodynamically stable phases, usually referred to by the Greek letters , , , , and , are known, see Fig. 2 for a schematic representation of the main known phases. This review is focussed on salts of the -phase family. Interestingly enough, different crystalline arrangements imply different band fillings and consequently different physical properties. A detailed discussion about each phase is presented in Refs. Lang4 ; Powell2006-20 .
The packing pattern of the -phase differs distinctly from the others in the sense that it consists of two face-to-face ET molecules, cf. Fig. 2. The two molecules interact with each other via overlap between the highest occupied molecular orbitals (HOMOS), as the HOMOS of each molecule are partially occupied Powell2006-20 .
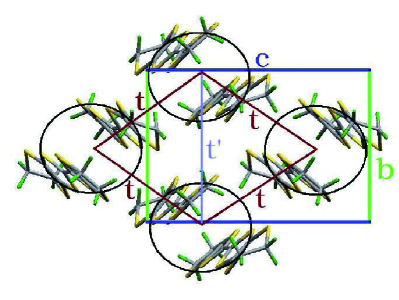
Due to the intrinsic strong dimerization in the -(ET)2X family, pairs of ET molecules can be treated as a dimer unity. As a result of such an assumption, an anisotropic triangular lattice is built by such dimer units as shown in Fig. 3 and the system can be described by the Hubbard model. The counter anion X governs the ratio between the inter-dimer transfer integrals and . For example, for the -(ET)2Cu2(CN)3 salt Kandpal09 ; Nakamura09 , suggesting a strongly frustrated triangular lattice in this compound, to be discussed in more detail below.
It is well to note that, more recently, a new phase, called mixed phase, with alternating - and -type arrangements of the ET molecules, has been synthesized Schlueter20c . In addition, a dual-layered superconductor with alternating - and -type packing has been reported in the literature JACS .
The crystallographic structure of the -(ET)2Cu[N(CN)2]Br salt Kini20c1 is displayed in Fig. 4. The structure of the latter substance is orthorhombic with the space group Pnma with four dimers and four anions in a unit cell. An interesting aspect is that although the compounds -(ET)2Cu(NCS)2 and -(ET)2Cu2(CN)3 Geiser1991 also belong to the -phase family, their crystallographic structure is monoclinic. Since the counter anionX- = Cu[N(CN)2]Br- assumes a closed-shell configuration, metallic properties are observed only within the ET layers, which lie in the crystallographic ac-plane and correspond to the large face of the crystal. In the perpendicular direction to the referred layers, i.e. the b-direction eixo , the insulating anion layer partially blocks charge transfer, so that the electrical conductivity along this direction ( to the layers) is reduced by a factor of 100 – 1000, depending on the counter anion. Due to this anisotropy, these materials are called quasi-two-dimensional (quasi-2D) conductors.

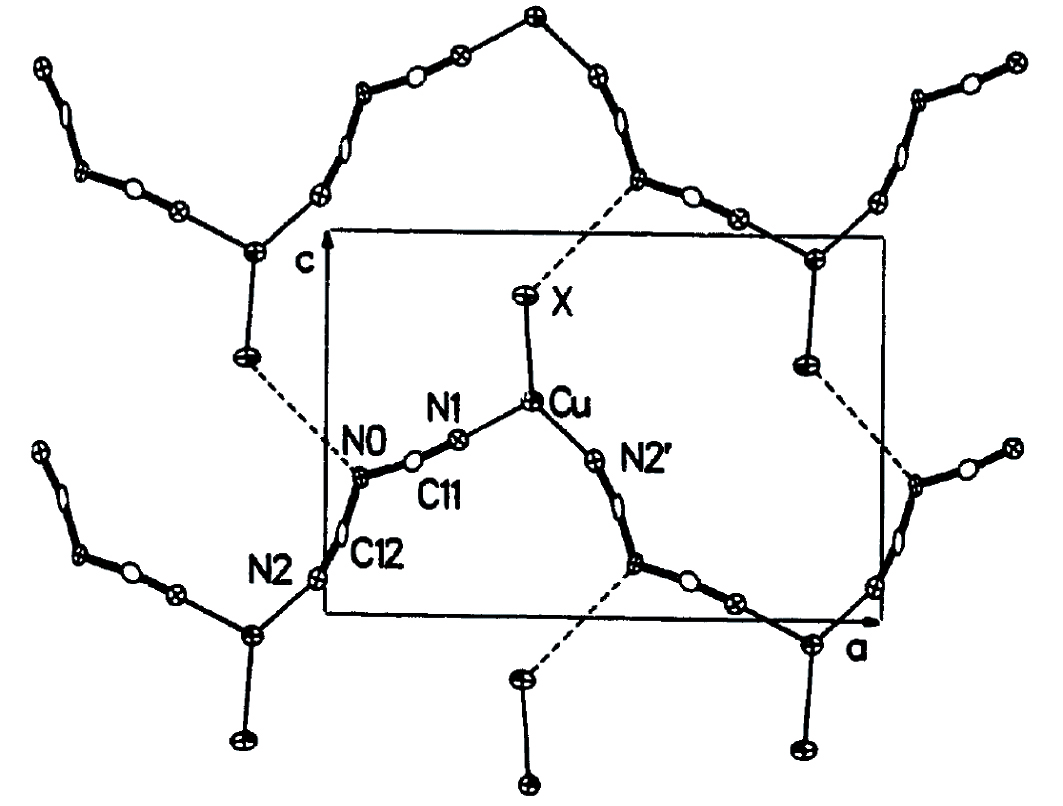
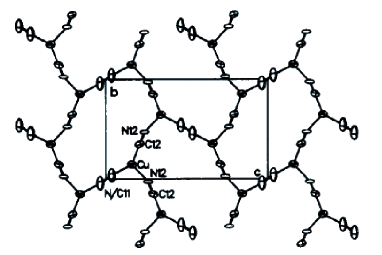
As displayed in Fig. 6, the Cu[N(CN)2]Br- (or Cu[N(CN)2]Cl-) polymeric anion structure is composed of planar triply-coordinated Cu(I) atoms with two bridging dicyanamide [(NC)N(CN)]- ligands, forming a zig-zag pattern chain along the a-axis. The terminal Br- ions, which overlap slightly with the central N atoms of neighboring polymeric chains, make the third bond at each Cu(I) atom Lang20a .
As shown in Fig. 6, the counter anion Cu2(CN) differs distinctly from theCu[N(CN)2]Br- anion in that it does not form chains, but a planar reticule of Cu(I) ions coordinated in a triangular fashion and bridging cyanide groups. Notably, one of the cyanide groups (labeled N/C11 in Fig. 6) is located on an inversion center and therefore must be crystallographically disordered Geiser1991 . As will be discussed in Section V, this particular arrangement is likely to be responsible for the absence of the so-called glass-like transition in -(ET)2Cu2(CN)3.
Directional-dependent thermal expansion experiments, to be discussed in Section III, will show that the more pronounced lattice effects, associated with the Mott MI transition for -D8-Br, occur along the in-plane direction which is parallel to the anion chains direction (a-axis). In addition, we will propose a model based on the collective vibration modes of the CN groups of the polymeric anion chains to explain the negative thermal expansion along the a-axis above 77 K.
For completeness, the lattice parameters of the -(ET)2X charge-transfer salts discussed in this work are listed in Table 1.
| Anion | a(Å) | b(Å) | c(Å) | V(Å3) | Struc. | |||
|---|---|---|---|---|---|---|---|---|
| D8-Br | - | - | - | - | Orth. | |||
| H8-Br | 12.949 | 30.016 | 8.539 | 3317 | Orth. | |||
| H8-Cl | 12.977 | 29.977 | 8.480 | 3299 | Orth. | |||
| CuCN | 16.117 | 8.5858 | 13.397 | 1701.2 | 113.42∘ | Monoc. |
I.2 Phase diagram of -(ET)2X
Charge-transfer salts of the -(ET)2X family have been recognized as strongly correlated electron systems. Among other features, the latter statement is based on the unusual metallic behavior inherent to these systems, as will be discussed below. Band structure calculations suggest that these materials should be metals down to low temperatures Powell2006-20 . However, due to correlation effects, the phase diagram embodies various phases, including the paramagnetic Mott insulator (PI), the antiferromagnetic Mott insulator (AF), the superconductor, and the anomalous metal, see the phase diagram depicted in Fig. 7.
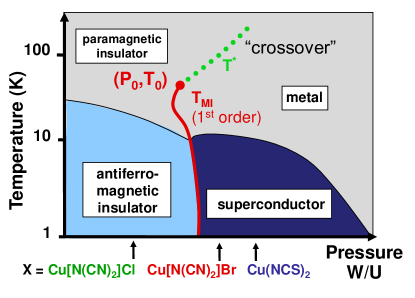
A remarkable feature is the competition between antiferromagnetic ordering and superconductivity. The similarities between the present charge-transfer salts and the high- cuprate superconductors have been discussed, see e.g. Refs. Mckenzie1998-20 ; Mackenzie20a ; Degoto20b1 . The major difference, however, between these two classes of materials is that while for the cuprate superconductors one deals with a doping-controlled Mott transition, for the charge-transfer salts to be discussed here one has a bandwidth-controlled Mott transition. In addition, no spin-glass phase is observed in organic conductors between the antiferromagnetic and superconducting phases. The symmetry of the superconducting order parameter in these materials is still a topic of debate, see e.g. LABEL:Taylor2007-20 and references therein. From the experimental point of view, a remarkable feature is the tunability of such systems. In contrast to the cuprate superconductors, where the ground states are tuned by doping, i.e. band filling, and therefore disorder is unavoidable, the ground states of organic conductors can be tuned by chemical substitution, namely counter anion substitution, and/or by applying external pressure. Pressure mainly induces strain which in turn leads to modified hopping matrix elements and and thereby modifies the bandwidth . As a consequence, applying pressure leads to a change of the ratio . A pressure of a few hundred bar, which is easily attainable by employing the 4He-gas pressure technique, is enough to make a wide sweep over relevant regions of the pressure versus temperature (-) phase diagram pressao .
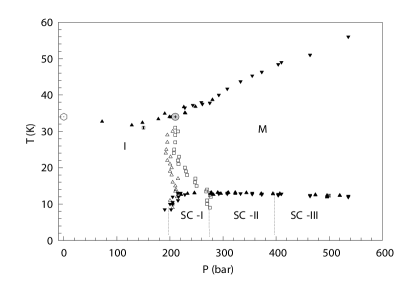
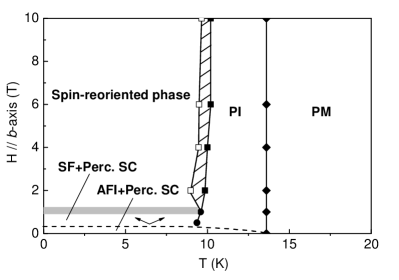
The phase diagram shown in Fig. 8 has been mapped by NMR and ac susceptibility Lefebvre7 , transport Limelette2003-20 and ultra-sonic Fournier2003-20 measurements under helium gas pressure on the salt with X=Cu[N(CN)2]Cl. In this generic phase diagram, the antiferromagnetic transition line, not observed in ultra-sound experiments Fournier2003-20 , was obtained from the NMR relaxation rate Lefebvre7 . From the splitting of NMR lines, the estimated magnetic moment per dimer is (0.4 – 1.0) . The superconducting transition line was determined from the ac susceptibility Lefebvre7 and its fluctuations in the immediate vicinity of the Mott transition by means of Nernst effect measurements BlundNature , whereas the S-shaped first-order MI transition line via ultra-sound Fournier2003-20 , transport Limelette2003-20 and ac susceptibility Lefebvre7 measurements.
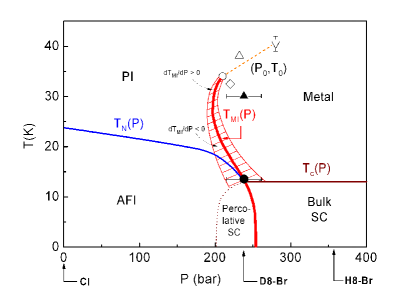
This first-order Mott MI transition line ends in a critical point (), which has been studied by several groups Lefebvre7 ; Limelette2003-20 ; Fournier2003-20 ; Kagawa2004-20 ; Kagawa2005_20 . Among possible scenarios, this critical end-point has been discussed in analogy with the liquid-gas transition, see e.g. LABEL:Papanikolaou2008_20. In this scenario, above () the metallic state cannot be distinguished from the paramagnetic insulating state. More recent studies suggest that lattice effects are relevant close to the Mott critical end-point Mariano20f1 ; Bartosch ; Zacharias .
By means of resistivity measurements under pressure, the critical behavior in the proximity of the point (, ) was investigated by Kagawa et al. Kagawa2005_20 . These authors found critical exponents which do not fit in the most common universality classes, and they assigned this to the quasi-2D structure of the present substances. Such a scenario shall be examined in more detail in Section IV. The possibility of tuning the system from the insulating to the metallic side of the versus phase diagram, i.e. crossing the first-order Mott MI line by application of pressure, is indicative of a bandwidth-controlled Mott MI transition. Owing to the position of the salts with different counter anions X, as shown in Fig. 8, the fully hydrogenated salt with X = Cu[N(CN)2]Br superconducts below 12 K, the highest under ambient pressure among all organic conductors till the present date, whereas the salt with counter anion X = Cu[N(CN)2]Cl is a Mott insulator with 24 K. It has very recently been shown that the antiferromagnetic Néel state is accompanied by charge ordering, i.e. the salt -(ET)2Cu[N(CN)2]Cl is in fact a multiferroic Lunke .
Interestingly enough, fully deuteration of the ethylene end groups of the ET molecules in the salt with X = Cu[N(CN)2]Br, as described in detail above, results in a shift of the latter towards the boundary of the S-shaped first-order Mott MI transition line. It is due to their close position to this line Kawamoto1997-20 that the deuterated salt with X = Cu[N(CN)2]Br, hereafter named -D8-Br, has attracted particular interest. As a matter of fact, the C-H and C-D bond lengths are slightly different. It is well known that the deuterium nucleus has one proton and one neutron, while the hydrogen nucleus is formed simply by one proton. Thus deuterium has a higher mass than hydrogen and, as consequence C-D chemical bonds have a smaller eigen-frequency than the C-H bonds. Hence, the displacement of the deuterium atoms from their equilibrium positions during the vibration process is smaller than that estimated for the hydrogen atoms. Thus the C-D chemical bonds are slightly smaller than the C-H bonds. Furthermore, the contact between the C-D2 end groups and the anions is weaker than that between the C-H2 end groups and the anions. As a consequence, the lattice of the fully deuterated salt is softer than the lattice of the fully hydrogenated salt. This process of exchanging atoms is usually called applying “chemical pressure”. In fact, application of pressure (chemical or external) changes the distance between the ET molecules so that the overlap between -orbitals’ is increased and, as a consequence, the bandwidth (W) is changed. The ratio is considered the pivotal parameter which defines the various phases of these substances Kanoda97-20 .
Interestingly enough, for the salt with the anion X = Cu2(CN)3, magnetic ordering is absent in the whole insulating region. The versus phase diagram of the -(ET)2Cu2(CN)3 salt is depicted in Fig. 9.
I.3 Key experimental results
As mentioned above, the metallic state of -(ET)2X presents some distinct properties as compared to those of conventional metals. For instance, in the -H8-Br salt, the out-of-plane resistance as a function of temperature has a non-monotonic behavior Strack20d with a maximum around 90 K, which was observed to be sample-dependent. Decreasing temperature, this maximum is followed by a sudden drop and the resistivity sharply changes its slope around 40 K. Below 11.5 K superconductivity is observed. On applying pressure, shifts to higher temperatures and disappears at roughly 2 kbar. From about 40 K down to 11.5 K the resistance obeys a behavior which is frequently assigned to a coherent Fermi liquid state. NMR studies revealed a peak in the spin-relaxation rate divided by temperature around for the present compound Kawamoto95-20d . The anomalous metallic behavior around was also observed by thermal, magnetic, elastic, and optical measurements, cf. LABEL:Strack20d and references therein. The origin of the anomaly is still controversial. Ultrasonic velocity measurements under pressure on the compound -(ET)2Cu[N(CN)2]Cl performed by Fournier et al. Fournier2003-20 revealed the existence of two new lines in the phase diagram (not indicated in Fig. 8) which merge at the critical end point. These lines indicate the softening of the lattice response and should therefore coincide with anomalies expected in future dilatometric studies under pressure. It is important to keep in mind that the two lines observed in ultrasound experiments are different from the metal-to-insulator crossover line above .
The experimental findings obtained by Fournier et al. are shown in Fig. 10. From this data set, pronounced anomalies, depending on the pressure, are observed below around K. The maximum amplitude of the softening in the sound velocity (at 34 K, 210 bar) marks the critical end point (, ) and corresponds to a softening of roughly 20 % of the sound velocity. On increasing the pressure, the peak position shifts its position to higher temperatures. Below the anomaly becomes gradually less pronounced and saturates at around 32 K. The peak position was thus used by the authors to draw the two crossover lines in the - phase diagram (see Fig. 11).
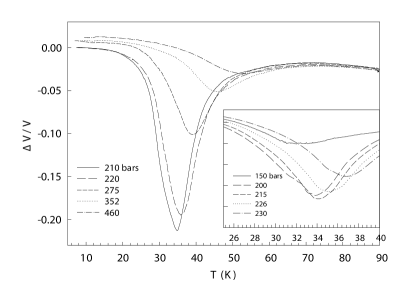
The large anomalies in the sound velocity observed by Fournier et al. were discussed in terms of a diverging electronic compressibility. As a matter of fact, acoustic and lattice anomalies are, according to dynamical mean-field theory (DMFT) calculations, expected at the Mott MI transition as a reaction to the softening of the electronic channel, cf. Refs. Hassan2005-20 ; Merino2000-20 . The explanation for this is that in the metallic state the conduction electrons contribute more to the cohesion of the solid than in the insulating one. Based on this argument, according to LABEL:Hassan2005-20, as an effect of the localization, abrupt changes of the lattice parameters are expected at the Mott MI transition. We shall discuss the lattice effects for the present material in Section III.
Regarding the Fermi surface, the weak interlayer transfer integrals were nicely estimated from magnetoresistance measurements for deuterated -(ET)2Cu(NCS)2 (Fig. 12).
From a more fundamental point of view, the determination of the interlayer transfer integral in a quasi-2D system is quite helpful, for instance, to understand the validity of the criterion usually adopted to classify whether the interlayer charge transport in quasi-2D systems is incoherent or coherent. For a detailed discussion, see e.g. Ref. Single and references cited therein. Thus charge-transfer salts of the -(ET)2X phase serve as a good platform to investigate the fermiology of quasi-2D systems. Furthermore, knowing precisely the relevant parameters that govern the Mott Physics, theoretical approaches can be employed to understand the fundamental aspects of the Mott transition, see e.g. Harald .
Owing to the magnetic properties of the -(ET)2X family, several studies employing different experimental methods have been carried out on the salt with X = Cu[N(CN)2]Cl Welp20i ; Pinteric20j ; Miyagawa20k .
By means of resistance measurements, a magnetic-field-induced Mott MI transition was
observed by Kagawa et al.
Kagawa20l
by varying temperature, pressure and
the magnetic field.
From an
analysis of their NMR line shape, relaxation rate and
magnetization data, Miyagawa et al. Miyagawa20k
were able to describe the spin structure of this state. Below
– K, they found a commensurate antiferromagnetic ordering
with a moment of (0.4 – 1.0) /dimer, as already mentioned
above. The observation
of an abrupt jump in the magnetization curves for fields applied
perpendicular to the conducting layers, i.e. along the
b-axis, was discussed in terms of a spin-flop (SF)
transition. Furthermore, a detailed discussion about the SF
transition, taking into account the Dzyaloshinskii-Moriya exchange
interaction, was presented by Smith et al.
Dylan20m ; Dylan20n . Similarly to that for the pressurized
chlorine salt, a magnetic-field-induced MI transition was also
observed in partially deuterated
-(ET)2Cu[N(CN)2]Br Kawamoto20o . In
addition, a discussion on the phase separation and SF transition
in -D8-Br was reported in the literature
Miyagawa20g .
As already mentioned above, the organic charge-transfer salt -(ET)2Cu2(CN)3 has the peculiarity that the ratio of its hopping matrix elements to is close to unity, more precisely 0.83 Kandpal09 ; Nakamura09 , leading to a strongly frustrated isotropic = 1/2 triangular lattice with the coupling constant = 250 K, where this coupling constant is obtained by fitting the magnetic susceptibility using the triangular-lattice Heisenberg model. Magnetic susceptibility and NMR measurements revealed no traces of long-range magnetic ordering down to 32 mK Shimzu2003 . Based on these results, this system has been proposed to be a candidate for the realization of a spin-liquid state Anderson1973 .
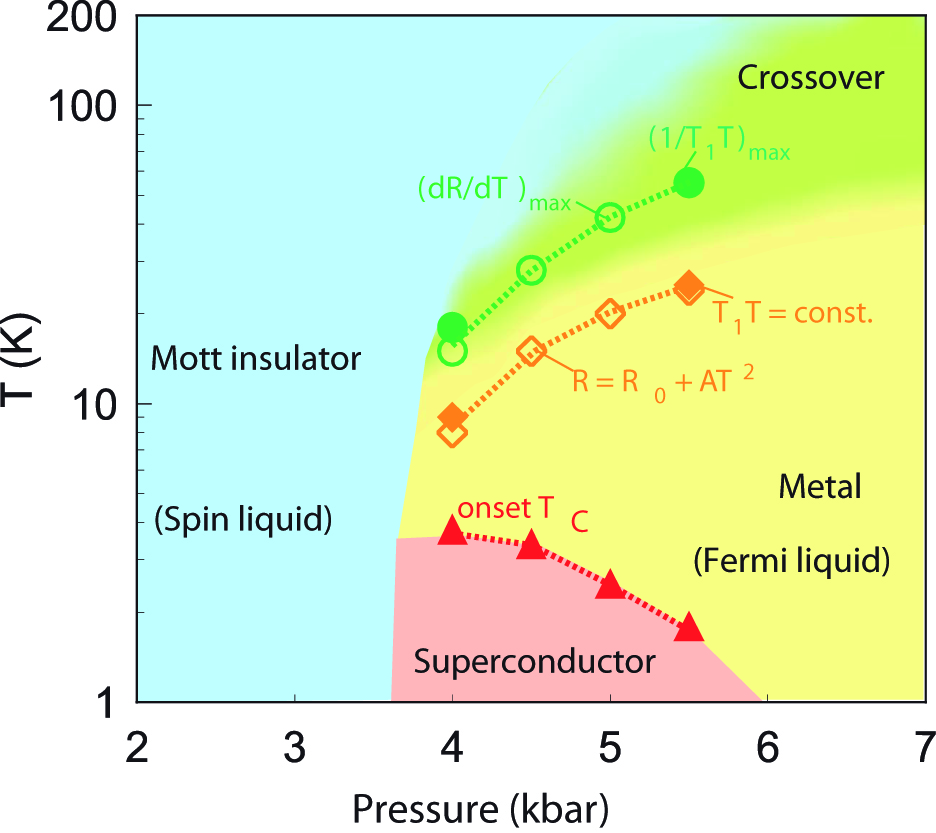
Interestingly, upon applying pressure (see Fig. 9), the system becomes a superconductor Kurosaki2005 , i.e. superconductivity appears in the vicinity of a spin-liquid state. As shown in Fig. 13, specific heat experiments revealed the existence of a hump at 6 K, insensitive to magnetic fields up to 8 T.
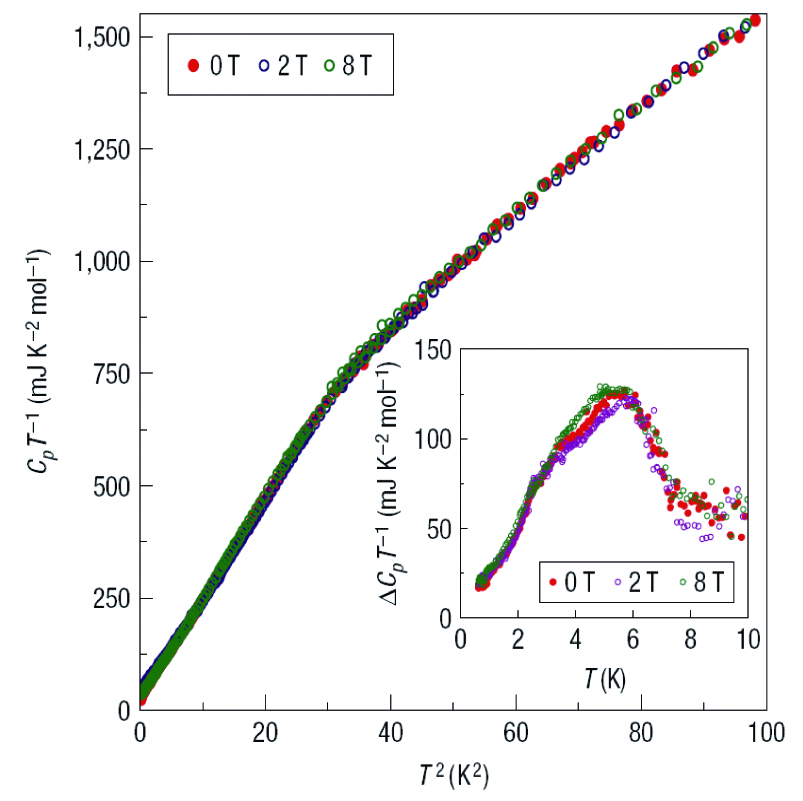
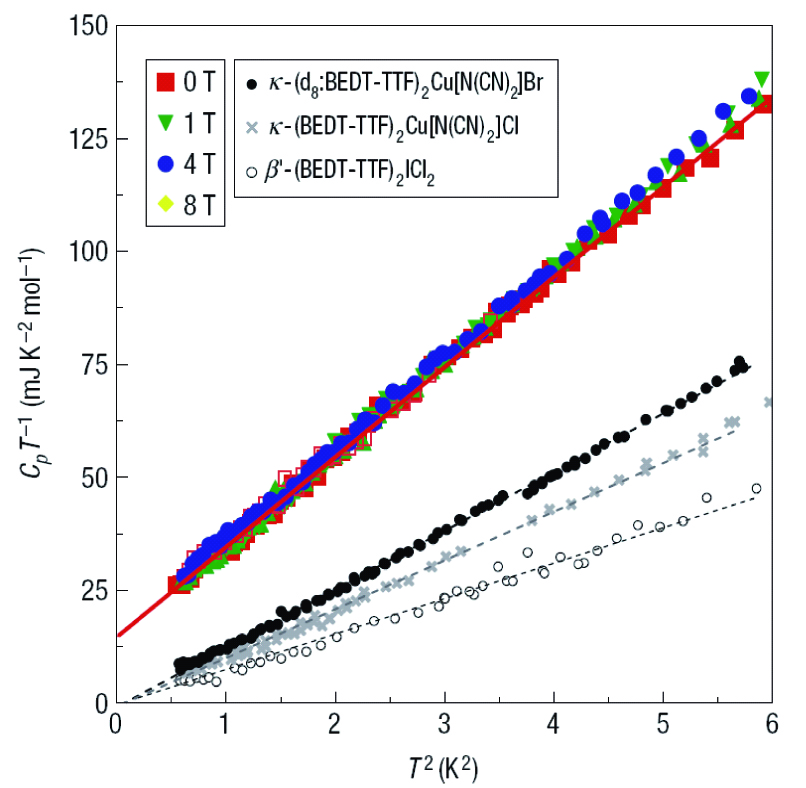
This feature was assigned to a crossover from the paramagnetic Mott insulating to the quantum spin-liquid state Yamashita2008 . Such a “crossover” has been frequently referred to as “hidden ordering”. Below 6 K, the specific heat presents a distinct -dependence, including a -linear dependence in the temperature window 0.3 – 1.5 K, as predicted theoretically for a spin-liquid Anderson1987 . The spin entropy in this -range is roughly 2.5% of ln 2 Ramirez2008 , indicating that below 6 K only 2.5% of the total spins contribute to the supposed spin-liquid state. Extrapolating the low- specific heat data, the authors of LABEL:Yamashita2008 found a linear specific heat coefficient = (20 5) mJ mol-1 K-2. The latter is sizable given the insulating behavior of the material and contrasts with a vanishing value for the related compounds -(ET)2Cu[N(CN)2]Cl and fully deuterated -(ET)2Cu[N(CN)2]Br. A finite could indicate a spinon Fermi surface.
A gauge theory with an attractive interaction between spinons mediated via a non-compact gauge field was proposed by Lee et al. Lee2007 to describe a possible spin-liquid state in -(ET)2Cu2(CN)3. Within this model, a pairing of spinons on the same side of the Fermi surface should occur at low temperatures. The attractive interaction between spinons with parallel momenta is quite analogous to Ampère’s force law which states that two current carrying wires with parallel currents attract. The authors deduce that the pairing of spinons is accompanied by a spontaneous breaking of the lattice symmetry, which in turn should couple to a lattice distortion (analogously to the Spin-Peierls transition) and should be detectable experimentally via X-ray scattering. While Lee et al. Lee2007 derive a specific heat which scales as and therefore contributes even stronger than linear at low , it should be kept in mind that the very-low temperature behavior of -(ET)2Cu2(CN)3 is dominated by a diverging nuclear contribution to the specific heat. Indeed, the data set reported by Yamashita et al. Yamashita2008 is also reasonably well described by a behavior at intermediate temperatures Ramirez2008 .
Even though specific heat measurements by S. Yamashita et al. Yamashita2008 are compatible with a spinon Fermi surface with gapless excitations, thermal conductivity measurements reported by M. Yamashita et al. in Ref. Yamashita09 show a vanishing low-temperature limit of the thermal conductivity divided by temperature, indicating the absence of gapless excitations. The excitation gap was estimated to be K. Applying a theory based on spin liquids, Qi et al. argued that thermal transport properties should be dominated by topological vison excitations Qi09 . The gap found by M. Yamashita et al. Yamashita09 should therefore be interpreted as a vison gap. It was pointed out by Ramirez Ramirez2008 that before a final declaration of -(ET)2Cu2(CN)3 as a spin-liquid is made some points should be clarified, among them the anomaly observed in the specific heat at 6 K. We will come back to the system -(ET)2Cu2(CN)3 in Section V where we will discuss its thermal expansion properties. Regarding the fascinating properties of this salt, recently the existence of two magnetic field-induced quantum critical points was reported in the literature Blund . Yet, based on a careful analysis of their muon spin rotation results, performed under extreme conditions, the authors of Ref. Blund discuss a possible interpretation for the features observed in several physical quantities around 6 K in terms of the formation of bosonic pairs emerging from a portion of the fermionic spins in -(ET)2Cu2(CN)3.
The remainder of this article is organized as follows: In Section II, we discuss experimental aspects like sample preparation and high-resolution thermal measurements. Section III is dedicated to an exhaustive discussion on the thermal expansivity of fully deuterated salts of -(ET)2Cu[N(CN)2]Br, while in Section IV the Mott criticality is comprehensively reviewed. Section V is devoted to the discussion of the thermal expansivity of the spin-liquid candidate -(ET)2Cu2(CN)3. Finally, conclusions and perspectives are presented in Section VI.
II Experimental setup
II.1 Sample Preparation
As thermal expansion measurements under external hydrostatic pressure are extremely challenging, using compounds of different chemical composition currently represents the most practical way to probe the phase diagram of the -(ET)2X family via dilatometry. Deuterated (98%) bis(ethylenedithiolo)-tetrathiofulvalene (D8-ET) was grown according to Hartke et al. Hartke20a1 and Mizumo et al. Mizuno20b , making the reduction of carbon disulfide with potassium in dimethylformamide and subsequent reaction with deuterated (98%) 1.2-dibromoethane. The intermediate thione C5D4S5 was mixed with triethylphosphite in an inert atmosphere kept at C and recrystallized several times from chlorobenzene. By investigating the CH2 and CD2 stretch vibration modes, no signs of any CH2 or CDH vibrations could be detected, cf. LABEL:Gartner20c. Hence, the grade of deuteration of -(D8-ET)2Cu[N(CN)2]Br is at least 98 % Griesshaber20e . As discussed in detail in LABEL:Strack20d, by employing the preparation technique described above, hydrogenated single crystals of the same substance resulted in samples whose resistivity revealed reduced inelastic scattering and enhanced residual resistivity ratios. In general, the crystals have bright surfaces in shapes of distorted hexagons with typical dimensions of approximately 1 1 0.4 mm3. Due to the small size and fragility of the crystals, the experimental challenge lies in assembling them in the dilatometer. The samples of the deuterated and hydrogenated variants of -(ET)2Cu[N(CN)2]Br and -(ET)2Cu2(CN)3 salts used for measurements discussed in this work are listed in Table 2. The fully deuterated (hydrogenated) salts of -(ET)2Cu[N(CN)2]Br will be subsequently referred to as -D8-Br (-H8-Br). Samples of -(ET)2Cu2(CN)3 studied here were prepared according to LABEL:Geiser1991.
| Anion X | Crystal Number | Direction | Batch |
|---|---|---|---|
| D8-Br | 1 | a, b, c | A2907∗ |
| D8-Br | 2 | a, b | A2995∗ |
| D8-Br | 3 | a, b, c | A2907∗ |
| D8-Br | 4 | - | A2907∗ |
| H8-Br | 7 | b | A2719∗ |
| H8-Cu2(CN)3 | 1 | a | SKY 1050∗∗ |
| H8-Cu2(CN)3 | 1 | c | KAF 5078∗∗ |
| H8-Cu2(CN)3 | 2 | b | KAF 5078∗∗ |
II.2 Thermal Expansion Measurements
As already mentioned in the introduction, thermal expansion coefficient measurements are a very useful and powerful tool to explore phase transitions in solid state physics research Barron9f ; Mariano2008 ; Mott ; Thesis ; SL ; RSI ; Bartosch ; Lunke ; Matej ; Anton1 ; Anton2 ; MarianoP ; Anton3 ; Haghi ; Review2013 ; Field2012 . For instance, combining specific heat and thermal expansion data one can employ the Ehrenfest relation to determine the pressure dependence of a second-order phase transition temperature. Such an analysis may serve also as a check of its direct measurement as a function of hydrostatic pressure. Furthermore, contrasting with specific heat which is an isotropic property, anisotropic effects may be studied via thermal expansion measurements. Regarding the charge-transfer salts of the -phase, to our knowledge, the first high-resolution thermal expansion experiments along the three crystallographic directions were carried out about twenty years ago by Kund and collaborators Kund .
The measurements presented in the present work were textcolorredcarried out by making use of an ultra-high-resolution capacitance dilatometric cell, built after LABEL:Pott9e, with a maximum resolution of , in the temperature range 1.3 (pumping of Helium bath) to 200 K under magnetic fields up to 10 T. In order to avoid external vibrations, the cryostat is equipped with shock absorbers. A detailed description of the dilatometer used in this work has been presented in several works LangPhD ; Jens9f1 ; Andreas9h . The principle of measurement is described in the following. As sketched in Fig. 15, the cell, which is entirely made of high-purity copper to ensure good thermal conductivity and covered with gold is constituted basically of a frame (brown line) and two parallel pistons (orange), the upper one being movable. As a matter of fact, the gold layer should work like a protection, avoiding oxidation of the cell. Nevertheless, after some years in use, two striking anomalies have been observed at 212 K and 230 K. These anomalies are assigned to the formation of copper-oxide (CuO) Loram1989 in the body of the cell. Due to this, experimental data taken in this window are not reliable.
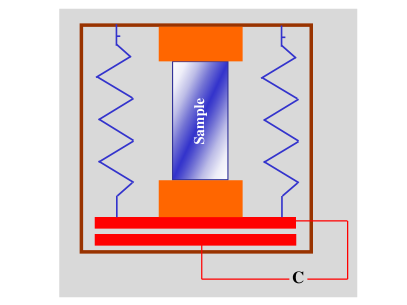
The sample is placed between these two pistons and by moving the upper piston carefully, the starting capacitance is fixed. The lower piston is mechanically linked to a parallel plate capacitor, as schematically represented by springs in Fig. 15. The variation of the sample length, i.e. contraction or expansion, as the temperature is lowered or increased, together with cell effects corresponds exactly to the change of the distance between the plates of the capacitor and consequently to a change of the capacitance, so that very tiny length changes can be detected. In this construction, the distance between the plates of the capacitor is about 100 m. For the sake of avoiding stray electric fields, the parallel plate capacitor is surrounded by guard rings Pott9e . The most remarkable characteristic in this capacitance dilatometer, however, is its high resolution (), corresponding to absolute length changes of = 0.01 Å for a specimen of length 10 mm. This resolution is roughly five orders of magnitude higher than that of conventional methods like neutrons or X-ray diffraction Barron9f and is mainly due to the high resolution of the capacitance bridge and the high quality of the plate capacitor in the dilatometer cell, which allows the detection of very small changes, i.e. changes of about 10-7 pF can be detected in the capacitance of the system. Two different high precision capacitance bridges have been used in these experiments: (i) Andeen Hagerling - Model 2500A 1 kHz and (ii) General Radio - Model 1616. However, the above-mentioned resolution holds only until 40 K, where a precise PID temperature control becomes difficult due to the large time constant involved in the experiment. As deduced in LABEL:Pott9e, the sensitivity of the measurements is proportional to the square of the starting capacitance (). This means that the higher the starting capacitance, the higher the sensitivity. However, specimens of the molecular conductors investigated here are quite sensitive to the pressure applied by the dilatometric cell so that one cannot set a starting capacitance too high since this would consequently lead to a break in the sample. Hence, the starting capacitance for measurements under normal pressure (see Subsection II.3) was limited to 18 pF. Just for completeness, it is worth mentioning that the empty capacitance of the system reads 16.7 pF.
For measurements under magnetic fields, a magnet power supply (model PS120-3) supplied by Oxford Instruments was used. In all performed measurements under magnetic fields reported here the field was applied parallel to the measured direction. For the direction-dependent thermal expansion measurements, the alignment of the crystal orientation was made using an optical microscope and guaranteed with an error margin of . To obtain the intrinsic thermal expansivity of the investigated specimen the thermal expansivity of copper of the dilatometric cell body was subtracted from the raw data. Apart from that, no further treatments like splines or any other kind of mathematical fittings were done.
The linear thermal expansion coefficient in the direction at constant is defined as
| (1) |
where l refers to the sample length. The physical quantity described by Eq. (1) will be frequently used in this work. From the length changes of the sample ( is a fixed temperature), which is the physical quantity measured, the linear thermal expansion coefficient [Eq. (1)] was approximated by the differential quotient as
| (2) |
where , and and are two subsequent temperatures of data collection. Unless otherwise stated, in order to guarantee thermal equilibrium in all thermal expansion measurements reported here, a very low temperature sweep rate ( 1.5 K/h) was employed.
II.3 Thermal Expansion Measurements Under Quasi-Uniaxial Pressure
One of the challenges in the context of thermodynamic measurements is the realization of high-resolution thermal expansion measurements under hydrostatic pressures, see e.g. LABEL:TEP.
However, by changing the starting capacitance and taking into account the contact area between the dilatometer and the sample, one can perform quasi-uniaxial thermal expansion experiments under pressures up to bar employing the above-described setup, see e.g. LABEL:Koeppen. The term “quasi-uniaxial” is used here in the sense that one may have a pressure-gradient on the sample volume. The dependence between the force () exerted by the springs and the capacitance change () can be easily measured and is given by
| (3) |
Making use of Eq. (3), the pressure applied by the dilatometric cell on the sample can be estimated. For example, taking a contact area of 0.2 10-6 m2 and a capacitance change of 2 pF and using the definition of pressure results in a quasi-uniaxial pressure of roughly 12 bar.
Hence, a slight change of the contact area and/or starting capacitance results in a significant change of the pressure exerted by the dilatometer on the sample. The crucial point of such experiments lies in the assembling and disassembling of the sample holder from the cryostat without damaging the sample, as such procedure is necessary to set the new starting capacitance (new pressure). As depicted in Fig. 11, for the (BEDT-TTF) based charge-transfer salts a hydrostatic pressure of a few hundred bar is enough to make a significant sweep across a wide range of the pressure-temperature phase diagram. Measurements under quasi-uniaxial pressure, to be discussed in Section III.4, will show that a quasi-uniaxial pressure of a few tenth of bar changes the shape of the thermal expansion coefficient curves dramatically, indicating therefore that the properties of this material are altered.
III Thermal Expansion Measurements on Fully Deuterated Salts of -(ET)2Cu[N(CN)2]Br (“-D8-Br”)
As otherwise stated, in order to reduce cooling-speed dependent effects, the temperature was decreased by a rate of 3 K/h through the so-called glass-like transition around 80 K footnote1 in all experiments reported here. Fig. 16 depicts the linear thermal expansivity (upper part) along the in-plane a-axis for crystals #1 and #3 together with the out-of-plane (b-axis) electrical resistivity Strack (lower part) for crystal #1. As depicted in Fig. 16, upon cooling, achieves a broad maximum centered at 45 K, then abruptly drops and levels out at 30 K. The electrical resistivity remains metallic, i.e. d/d 0, down to 20 K, below which increases again (cf. upper inset in Fig. 16), indicating a phase transition to an insulating state. A comparable behavior was observed for the single crystal #3 as well as for the crystal investigated in LABEL:Lang20f, except for small differences around the maximum and some details in the insulating regime. Interestingly enough, for all three crystals studied, vanishes below 11.5 K. A zero electrical resistivity followed by a very small feature in the thermal expansivity suggests percolative superconductivity coexisting with an antiferromagnetic insulating phase for -D8-Br Miyagawa20g , cf. the phase diagram presented in Fig. 8. In LABEL:Kawamoto1997-20, Kawamoto et al. performed a.c. magnetic susceptibility measurements on -D8-Br under two distinct conditions: (i) cooling the system slowly, namely employing a cooling-rate of 0.2 K/min; and (ii) using a high cooling-rate of 100 K/min. From the measurements carried out after slow cooling, below the onset of superconductivity at = 11.5 K, they did not observe a jump in the real part of the a.c. magnetic susceptibility, as expected for bulk superconductivity, but a gradual transition towards low temperatures. From the latter behavior they estimated a percolative superconducting volume fraction of 20 % . In the case of measurements after rapid cooling, according to the authors, the superconducting volume fraction is reduced to 1 – 2 %.
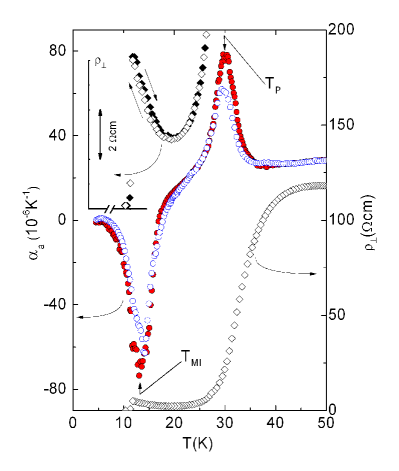
As can be seen in Fig. 16, some features observed in the electrical resistivity manifest themselves in the coefficient of thermal expansion as well. Indeed, the rather abrupt drop of is accompanied by a pronounced maximum in centered at a temperature K. As will be discussed in more detail below, this behavior can be assigned to a crossover phenomenon in the vicinity of a nearby critical point. Upon cooling the system further, reveals a huge negative peak, indicating a phase transition, see the phase diagram depicted in Fig. 8. The concomitant change in from metallic to insulating behavior indicates that the peak in the expansivity data, , is due to the Mott MI transition C . Note that a similar behavior of is observed for crystal #2, albeit with somewhat reduced () peak anomalies at and . This reduction might be related to small misalignments of the crystal as well as to different pressures exerted by the dilatometer cell on the crystals, approximately 4 bar for crystal #1 and 6 bar for crystal #2. More information on the nature of such transitions can be obtained via investigation of possible anisotropic lattice effects, namely by measuring and analysing the relative length changes along the three crystallographic directions, i.e. = (0 K))/(300 K) (with ), as depicted in Fig. 17.
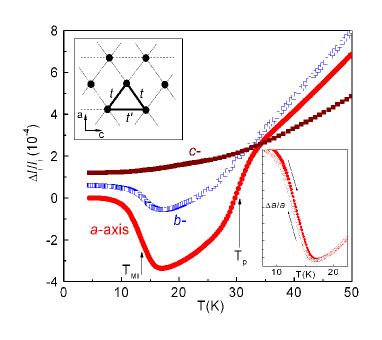
As can be seen in Fig. 17, the most pronounced effects appear along the -axis (in-plane), i.e. parallel to the polymeric (Cu[N(CN)2]Br) anion chains, see Fig. 6. Of special interest is the “S-shaped” anomaly near which corresponds to the peak at in (see Fig. 16) and does not show any trace of hysteresis upon cooling or warming, at least within the resolution of the present experiments. This is a generic feature of strong fluctuations in the vicinity of a critical end point. Upon further cooling through , the length of the crystal along the -axis shows a distinct increase of roughly within a very limited -window, consistent with a broadened first-order phase transition. The assumption of a first-order phase transition is also supported by the observation of a hysteresis around of 0.4 K, as depicted in the lower inset of Fig. 17, which nicely agrees with the hysteresis observed in (see upper inset of Fig. 16). The associated anomalies observed along the -axis (out-of-plane) are clearly less pronounced. Notably, for the second in-plane direction (-axis), anomalous behavior in can neither be detected at nor at . The reliability of the previous results is supported by the same anisotropy observed for crystal #3, investigated in LABEL:Lang20f. Based on the quasi-2D electronic structure of the present material, the observed anisotropic lattice effects at the Mott MI transition are very intriguing and deserve to be analyzed in more detail. The pronounced effects observed in the expansivity data along the in-plane a-axis, along which dimer-dimer overlap is absent, agree with the hypothesis that the diagonal hopping transfer integrals, , play a crucial role in this process. Considering that these transfer integrals carry a net component along the in-plane c-axis, which is expected to be softer than the out-of-plane b-axis and second in-plane a-axis, a noticeable effect along the c-axis would then be naturally expected at . According to the authors of LABEL:Chasseau1991-20ga, the uniaxial isothermal compressibilities for the superconducting compound -(ET)2Cu(NCS)2 are robustly anisotropic with : : = 1 : 0.53 : 0.17 (ratio estimated under 1 bar), where refers to the isothermal compressibility along the in-plane c direction, along the second in-plane b-axis and along the direction parallel to a projection of the long axis of the ET donor molecules, i.e. along the out-of-plane a-axis for this salt, since its crystallographic structure is monoclinic Taka . Note that along the c-axis a direct dimer-dimer interaction , as indicated in the upper inset of Fig. 17, exists, making a zero-effect along this axis even more surprising. A possible explanation for this feature would be a cancellation of counteracting effects related to the transfer integrals and , which seems to be improbable. Furthermore, it is not clear how these in-plane interactions may produce comparatively strong effects in the out-of-plane b-axis.
These findings provide strong evidence that other degrees of freedom, namely the lattice, should be somehow coupled to the electrons, thus indicating that the Mott MI transition in the present material cannot be completely understood solely by taking into account a purely 2D electronic scenario Mariano20f1 .
III.1 Anisotropic Lattice Effects in -D8-Br and Rigid-Unit Modes
In Fig. 18 TEref the relative length changes in the -range 4.2 K 200 K for the a-, b- and c-axes are shown. In the following, a possible explanation for the unusual anisotropic lattice effects observed in -D8-Br is presented.
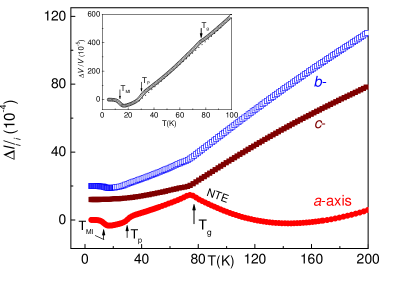
Upon cooling, strongly anisotropic effects are observed in the whole temperature range. The more pronounced effects are observed along the in-plane a-axis, which is marked by a minimum around 150 K and an abrupt change in slope at . This feature will be discussed in more detail below. An interpretation in terms of disorder due to the freezing-out of the ethylene groups of the ET molecules either in the staggered or in the eclipsed configuration was proposed by Müller et al. Jens2002-20 . By substituting the terminal (CH2)2 groups by (CD2)2, one observes a shift of to higher temperatures. A feature that is expected because of the higher mass of the (CD2)2 in comparison to the mass of the (CH2)2 groups, which in turn implies a higher relaxation time at a given temperature. Hence, the model proposed by Müller et al. is supported by the so-called isotope effect. However, it does not explain the negative expansivity along the a-axis (in-plane) observed above , namely in the interval 150 K. More recently, high-resolution synchrotron X-ray diffraction experiments Wolter20g1 have provided indications that such an anomaly is not solely linked to the ethylene groups freezing-out. Essentially, the claims of the authors are based on the comparison between the estimated number of the disordered ethylene groups (staggered configuration) at 100 K (11 %) with those at extrapolated zero temperature (3 3 %). They conclude that such a transition is most likely related to structural changes, probably involving the insulating polymeric anion chains. Upon further cooling, the anomalies at and , already discussed in detail in the previous section, show up. From Fig. 18 it becomes clear that the lattice effects at , and are more pronounced along the polymeric anion chain a-axis, with negative thermal expansion (NTE), i.e. a decrease of length with increasing temperature, observed below (due to charge carrier localization) and also in the temperature window 150 K. It should be noted that the in-plane anisotropy at both and corresponds to an orthorhombic distortion. Recently, NTE was also observed by Goodwin et al. in other materials containing cyanide bridges in their structures, cf. Refs. Goodwin2008-20g1a ; Goodwin2005 and references therein. These authors proposed a simple model Goodwin2005 to explain the origin of this unusual behavior. In this model, the transverse vibrational displacement of the CN units, away from the metal-metal axes (Fig. 19 b) and c)), is assigned to be the mechanism responsible for NTE in these materials. As a matter of fact, NTE is also observable in other materials. For example, the NTE of liquid water below C is connected with a breaking of the tetrahedral H bonding. Below C, NTE is required to overcompensate the increase of entropy due to such a structural transition NTE . Another example can be found in ZrW2O8. This material exhibits NTE over a wide temperature window of 50 – 400 K Mary1996 . The origin of this anomalous behavior is assigned to its structural arrangement, which is built up by WO4 tetrahedra and rigid ZrO6 octahedra. Rigid-unit modes in this material show up due to the fact that each WO4 unit has one vertex not shared by another unit.
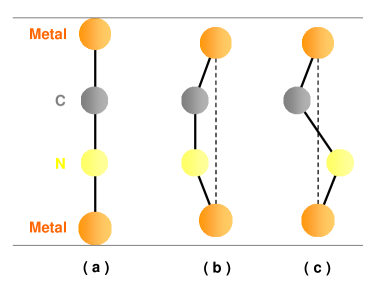
The displacement of the C and N atoms aside from the metal-metal axis has the effect of decreasing the distance between the metal atoms as the temperature is increased, cf. Fig. 19 b) and c). According to the authors of LABEL:Goodwin2005, in polymeric crystalline materials, these vibrational modes will not occur separately, but rather they will affect the vibration modes of other metal-CN-metal linkages, giving rise to the NTE phenomenon. Nevertheless, the deformation of the metal-cyanide bridge will carry a high-energy penalty. Hence, assuming that the metal coordination geometries are preserved, the vibration modes illustrated in Fig. 19 b) and c) can be observed only if they are coupled with the crystal lattice in the form of phonon modes. Yet, according to Goodwin et al., such modes are referred to as rigid-unit modes (RUM) and can be experimentally observed in the low-energy window 0 – 2 THz, i.e. in the range of typical phonon frequencies Roth . Since the Cu[N(CN)2]Br- (Fig. 6) counter anion has a polymeric nature, the above-described model is a good candidate to explain why NTE is observed only along the in-plane anion chain a-axis. The latter might have their origin in the RUM of dicyanamide [(NC)N(CN)]- ligands along the anion polymeric chain. Note that the contraction of the lattice with growing above along the a-axis is accompanied by an expansion along the b- and c-axes. In addition, preliminary Raman studies (not shown here), carried out on -D8-Br (crystal #4), revealed the appearance of a double peak structure in the frequency window 50 – 200 cm-1 at 20 K (below ), not observed at 130 K (above , but below the onset of NTE) Raman . Further systematic studies are required to verify if such splitting shows up above or below . Note that this frequency window fits roughly into the above-mentioned energy window predicted for RUM. Interestingly enough, the double peak structure is not observed at 5 K (below ), indicating that vibration modes in this energy window are no longer active below . Hence, these results support the idea of strong coupling between lattice and electronic degrees of freedom at the Mott transition. Still owing to the anomalous lattice effects above , based on the above discussion, it seems that the freezing-out of the degrees of freedom of the ethylene end-groups of the ET molecules in the staggered/eclipsed configuration alone cannot be responsible for a NTE along the a-axis. Indeed, as pointed out in LABEL:Jens2000-9c, the glass-like anomaly is not observed in the organic superconductors -(ET)2SF5CH2CF2SO3 ( = 5 K, large discrete anion) and in -(ET)2I3 ( = 3.5 K, linear anion) as well as in the nonsuperconducting -(ET)2KHg(SCN)4 (polymeric anion). For such materials, a smooth Debye-like behavior along the three crystallographic directions up to 200 K is observed, i.e. no glass-like transition is observed. It is appropriate to mention here that the glass-like anomaly is not observed in the -(ET)2Cu2(CN)3 salt, to be discussed in Section V. Thus, a possible scenario to explain this feature for the -(ET)2Cu[N(CN)2]Z salts would be the existence of a complicated entwinement between the ethylene end groups and the vibration modes of the polymeric anion chain, not knowingly reported as yet in the literature. According to this idea, the ethylene end groups delimit cavities, where the anions are trapped Geiser1991a , so that below an anion ordering transition occurs in a similar way to the anion ordering transition observed in the quasi-1D (TMTCF)2X charge-transfer salts Pouget96 . Further systematic Raman and infra-red studies are necessary to provide more information about the nature of the glass-like transition.
III.2 Entropy Change Associated with the Mott MI Transition
More information about the Mott physics in the present materials can be obtained by estimating the amount of entropy linked to the Mott MI transition. Such entropy change is directly associated with the slope of the first-order phase transition line in the universal - phase diagram Fig. 8 and the volume change associated with the Mott MI transition by the Clausius-Clapeyron equation, which reads
| (4) |
Here, () refer to the difference in volume (entropy) between the insulating (I) and metallic (M) states. Employing K/MPa, as obtained from the slope of the S-shaped line at in Fig. 8 and = 10-4, as estimated from the inset of Fig. 18, one obtains Jmol-1K-1. This small entropy change at represents a subtle fraction of the full entropy related to the metallic state of the -H8-Br salt at 14 K of 0.375 Jmol-1K-1, using the Sommerfeld coefficient = 0.025 Jmol-1K-2 Elsinger20h . Electronic specific heat data by Y. Nakazawa et al. Nakazawa20h1 revealed that by means of gradual deuteration it is possible to tune the system from the Mott insulating state to the metallic regime of the phase diagram. As observed in these experiments, decreases towards zero in the insulating phase. Based on these literature results, of the fully deuterated salt discussed in this work should actually be somewhat smaller than that of the fully hydrogenated salt. It follows that the small entropy change of 0.074 Jmol-1K-1, estimated as above-described, demonstrates that the spin entropy of the paramagnetic insulating state at elevated must be almost completely removed. In addition, this result is consistent with the Néel temperature coinciding with at this point in the phase diagram Lang20h2 .
III.3 Magnetic Field Effects on -D8-Br
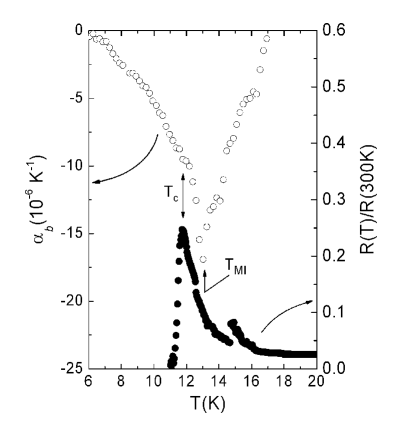
Having detected unusual features in the thermal expansivity of -D8-Br, additional information about the role played by lattice degrees of freedom for the Mott MI transition in -D8-Br can be obtained by carrying out thermal expansion measurements under magnetic fields. In what follows we discuss the effects of magnetic fields in the expansivity data at the immediate vicinity of the Mott transition. However, before doing so, let us consider first the low-temperature case at zero magnetic fields. The thermal expansivity along the b-axis (out-of-plane) for = 0 is shown in Fig. 20 together with the electrical resistance Strack data normalized to its value at room temperature. Upon cooling, a negative anomaly in the expansivity data at around = 13.6 K is observed. The latter is linked to the Mott MI transition and mimics the lattice response upon crossing the first-order Mott MI transition line in the phase diagram, cf. the discussion in the previous sections. Note that the anomaly in is directly connected to an enhancement of the electrical resistance around the same temperature, which corroborates the assumption that the anomaly in the expansivity is triggered by the Mott MI transition. The drop of the electrical resistance at = 11.6 K, accompanied by a very small kink (indicated by an arrow) in , are fingerprints of percolative SC in small portions of the sample volume coexisting with the AF ordered insulating state, see e.g. LABEL:Taniguchi20g2. In the temperature window 12 K 16 K, jumps in the electrical resistance are noticeable. In fact, such jumps in () are frequently observed in organic charge-transfer salts. The huge expansivity of the crystal, which in turn is due to the softness of this class of materials, induces stress on the electrical contacts, giving rise to such jumps. In general, the appearance of jumps in resistivity data are attributed to cracks in the crystal. For the quasi one-dimensional (TMTTF)2X and (TMTSF)2X salts, in particular, such jumps in the resistivity data are assigned to stress caused by localized defects and/or to mechanical twinning Ishiguro20 .
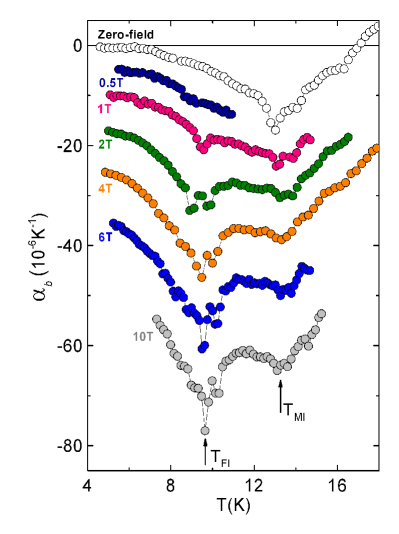
The thermal expansivity data along the b-axis (out-of-plane) at low- under external magnetic fields of 0, 0.5, 1, 2, 4, 6, and 10 T Field2012 is depicted in Fig. 21. From this data one can directly see that upon reducing under a magnetic field up to 10 T, the Mott MI transition temperature stands essentially unaffected. Nevertheless, upon reducing further under a low magnetic field of 0.5 T, a second field-induced anomaly at around = 9.5 K is observed. Increasing the magnetic field, this anomaly becomes more and more pronounced, until it saturates at around 4 T. A careful analysis of the data shown in Fig. 21 reveals the presence of a double-peak structure for magnetic fields higher than 1 T. However, further experiments are necessary to gain more insights into this feature. No such magnetic field-induced effects were observed along the in-plane a- and c-axis (not shown). As known from the literature, see e.g. LABEL:Blundell, orientational field-dependent magnetic phenomena may indicate a spin-flop (SF) transition. Such a transition takes place when the system is in an AFI state and a magnetic field, exceeding a certain critical value (critical field), is applied parallel to the so-called easy-axis. In the present case, this field dependence of the thermal expansivity is suggestive of a SF transition with strong magneto-elastic coupling. As can be directly seen from Fig. 21, the magnetic critical field is smaller than 0.5 T for -D8-Br, which is consistent with 0.4 T for the -(ET)2Cu[N(CN)2]Cl salt, as obtained by Miyagawa et al. in LABEL:Miyagawa20k. The physical explanation why the anomaly in the expansivity at = becomes more evident for magnetic fields higher than , however, cannot be based solely in terms of a SF transition, so that a possibly different mechanism might be related to this feature. It was pointed out by Ramirez et al. in LABEL:Ramirez99 that the emergence of pronounced anomalies under finite magnetic fields in thermodynamic quantities, like the specific heat or thermal expansion, have only been observed in a few systems and can be considered as unusual physical phenomena. Let us discuss two possible distinct scenarios to explain this unusual feature:
i) First of all, electrical resistance measurements carried out on partially deuterated -(ET)2Cu[N(CN)2]Br salts under magnetic field sweeps, being the magnetic field applied along the out-of-plane b-axis and the temperature fixed at = 5.50 K and 4.15 K for 50% and 75% salts, respectively, unveiled a sudden change from SC to high resistive-states for magnetic fields of about 1 T Taniguchi1 ; Field2012 . Such a state was found to transform into a high-resistive state via jump-like increases in the electrical resistance upon further increasing the applied magnetic field to 10 T Taniguchi1 . The authors of LABEL:Taniguchi1 interpreted this behavior as a magnetic field-induced first-order SC-to-Insulator transition and related it to the theoretical description based on the SO(5) symmetry for superconductivity and antiferromagnetism, as proposed for the high- cuprates by Zhang Zhang . Moreover, upon tuning the -(ET)2Cu[N(CN)2]Cl salt close to the Mott MI transition by hydrostatic pressure Kagawa2004-20 a pronounced -induced increase in the electrical resistance was observed also for this salt. In the latter case, it was proposed that minor metallic/superconducting phases near the Mott MI transition undergo a magnetic field-induced localization transition cf. theoretical predictions, see, e.g. LABEL:Georges96 and references cited therein. Thus, based on these findings, it is natural to expect that also for the fully deuterated -(ET)2Cu[N(CN)2]Br salt, located on the verge of the Mott MI transition line in the phase diagram, the electronic states may undergo drastic changes upon increasing the strength of the applied magnetic field. Based on the above discussion, the growth of the anomaly in (T) with increasing fields may be related with the sensitivity of the electronic channel to applied magnetic fields in this particular region of the phase diagram. In fact, the initial rapid growth and the tendency to saturation for field above about 4 T is quite similar to the evolution of the electrical resistance, i.e. the increase of with field observed in the above-mentioned transport studies Taniguchi1 ; Kagawa2004-20 . It is worth mentioning that no such magnetic field-induced effects were observed for fields applied parallel to the in-plane a- and c-axis (not shown), supporting thus the hypothesis of a SF transition. Indeed, it was pointed out in LABEL:Dylan1 that the type of the inter-layer magnetic ordering strongly depends on the direction of the applied magnetic field. In particular, based on a detailed analysis of NMR and magnetization data, taking into account the Dzyaloshinskii-Moriya interaction, the atuhors of Refs. Taniguchi1 ; Kagawa2004-20 found that inter-plane antiferromagnetic ordering can be observed only for magnetic fields exceeding applied along the out-of-plane b-axis. We stress that the term ”inter-plane afm ordering” is used here as defined in Figs. 4 and 5 of LABEL:Dylan1. Thus, given the absence of lattice effects at for magnetic fields applied along the in-plane a- and c-axis, the present results suggest a close relation between inter-plane antiferromagnetic ordering and the lattice response observed at . Employing the same notation used by the authors of LABEL:Dylan1, the magnetization of the () sublattice at the layer is ., being the staggered and ferromagnetic moments given by = ( )/2 and = ( )/2, respectively. For fields above applied along the out-of-plane -axis, is along the -axis and lies in the - plane. and are antiparallel, giving rise to an inter-plane antiferromagnetic ordering. The pronounced negative peak anomaly in observed at = suggests that in order to obtain this particular spin configuration, the increase in exchange energy forces the (ET) layers to move apart from each other.
ii) A possible second interpretation for the sharp peaks in induced by a magnetic field is that upon exceeding the critical field , percolative superconductivity is destroyed, the remaining electron spins do not couple with the applied magnetic field due to the correlated motion among them. These field-decoupled spins are strongly coupled to the lattice and give rise to the minimum at . The term field-decoupled spins is used in LABEL:Ramirez99 to refer to a similar effect (double peak structure) observed in specific heat measurements under magnetic field for the “spin ice” compound Dy2Ti2O7. According to the authors of LABEL:Ramirez99, for magnetic fields applied parallel to the [100] crystallographic direction, due to correlated motion among the spins, half the spins have their Ising-axis orientated perpendicular to the magnetic field. The latter are called decoupled-field spins. It was observed that magnetic fields exceeding a certain critical value lead to the ordering of these field-decoupled spins. Monte Carlo calculations, also reported by the authors in LABEL:Ramirez99, support the proposed model. The term “spin ice” is used by the authors to refer to the spin orientations in analogy with the degeneracy of ground states observed in ice (H2O in solid phase), where hydrogen atoms are highly disordered and give rise to a finite entropy as 0. This is because the oxygen atoms in water form a well defined structure, while the hydrogen atoms remain disordered as a result of the two inequivalent O-H bond lengths, as first pointed by Pauling Pauling . The present results do not enable us to determine the exact orientation of these field-decoupled spins.
It is worth mentioning that the above-discussed scenarios should be seen as “possible scenarios” and that the concrete physical origin of the features observed at remain elusive. Another particularity in the data presented in Fig. 21 is that for magnetic fields , in a temperature range between and , an intermediary phase appears, probably paramagnetic, as depicted in the schematic phase diagram in Fig. 22. It is tempting to speculate that this feature can be seen as a separation of the and lines in the phase diagram. A possible physical description to this would be related to the energetic competition between the AFI ordered phase and the paramagnetic phases after crossing the MI first-order line, resulting thus in a decrease of with increasing magnetic field. Similar experiments were performed in two other -D8-Br crystals (crystals #1 and #2). However, for both crystals, in contrast to the pronounced anomaly observed at 9.5 K under magnetic fields (Fig. 21), the application of magnetic fields results in a smooth change of the out-of-plane expansivity around the same temperature. In this regard, two factors should be considered as a possible explanation for the absence of the above-described effects:
i) As described in e.g. LABEL:Pankhurst20g4, the SF transitions are very sensitive to the alignment between the applied magnetic field and the easy-axis. A subtle misalignment between the magnetic field and the easy-axis can therefore give rise to a suppression of the transition;
ii) The absence of a sharp transition can also be due to sample inhomogeneities and defects. Sample inhomogeneities would imply, for instance, that portions of percolative SC may vary from sample to sample, reflecting therefore differences in their magnetic properties Kawamoto1997-20 .
The present findings are compiled in the schematic versus diagram shown in Fig. 22. The dashed line around 0.5 T defines the separation boundary between the AFI and the SF phases. The thick line indicates the suppression of percolative SC giving place to field-decoupled and/or flopped spins, here referred to as mixed states.
Concluding this section, the thermal expansion results on -D8-Br along the out-of-plane b-axis under a magnetic field show that the Mott MI transition in this salt is largely field-independent under magnetic fields up to at least 10 T. Such findings are consistent with the picture of a Mott insulator formed by a set of hole localized in dimers formed by two ET molecules Lang4 . At = 9.5 K a phase transition induced by a magnetic field is observed, indicative of a SF transition with strong magneto-elastic coupling, accompanied by an enhancement of due to the suppression of the percolative SC under magnetic fields above 1 T. Further experiments, like magnetostriction measurements above and below are highly desired to shed more light on the above-discussed magnetic field-induced lattice effects.
III.4 Thermal Expansion Under Quasi-Uniaxial Pressure
Given the high anisotropy of the -(ET)2X charge-transfer salts, thermal expansion measurements under quasi-uniaxial pressure could provide more insights to better understand the transitions at , and . The effect of quasi-uniaxial pressure on the sample was studied for crystal #2 as shown in Fig. 23. In these experiments, a pressure of (65 5) bar was applied along the out-of-plane b-axis. Roughly speaking, pressure application along the b-axis means a change of the contact between the polymeric-anion chains and the ET molecules and/or enhancement of the tilt of the ET molecules.
As shown in the main panel of Fig. 23, the shape of the expansivity curves at and is dramatically changed by applying a quasi-uniaxial pressure of 65 bar. These findings reveal that the anomalies observed in the out-of-plane expansivity at and are strongly affected upon applying pressure, while remains practically unaffected. Since -D8-Br is located on the boundary of the Mott MI transition (Fig. 8), this feature might be associated with a slight shift of its position from the insulating to the metallic side of the phase diagram. Assuming the peak position = 13.6 K as the transition temperature under ambient pressure (actually under a pressure of roughly 10 bar) and = 11.8 K as the transition temperature under quasi-uniaxial pressure (65 bar), one obtains 33 K/kbar. Such a value is roughly one order of magnitude smaller than the hydrostatic pressure dependence of ( 380 K/kbar), estimated from the slope of the Mott MI transition line in Fig. 8 at = 11.8 K. Such discrepancy might reflect the anisotropy in the uniaxial-pressure effects. However, the shift of () to high (low) temperatures is in perfect agreement with a positive (negative) pressure dependence of () in the phase diagram (Fig. 8). Applying a magnetic field of 10 T (pink curve in the inset of Fig. 23), the peak position of the transition, indicated by black and pink dashed arrows, shifts to lower temperatures. As is insensitive to magnetic fields up to 10 T (Section III.3), this observation suggests that the anomaly in under quasi-uniaxial pressure should be triggered by superconductivity. The present thermal expansion results under quasi-uniaxial pressure can be seen as a starting point for experiments under hydrostatic pressure, which will provide important information about the physics in the vicinity of the Mott MI transition region in the phase diagram.
III.5 Influence of the Cooling Speed on in -D8-Br
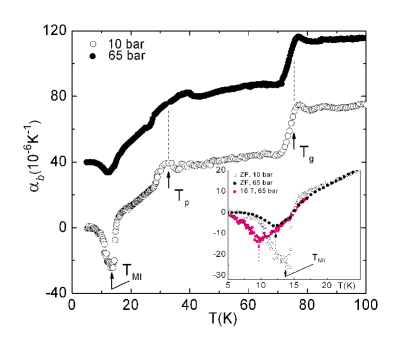
In this section, the influence of the cooling speed below the glass-like transition at 77 K on and is discussed. In fact, the role of the cooling speed on the physical properties of fully and partially deuterated salts of -(ET)2Cu[N(CN)2]Br has been intensively discussed in the literature, see e.g. Refs. Taniguchi20g2 ; Su1998-20g . As shown in Fig. 24, the expansivity along the in-plane a-axis for a crystal of -D8-Br was measured after cooling the sample through the so-called glass-like phase transition by employing two distinct cooling speeds (3 K/h and 100 K/h).
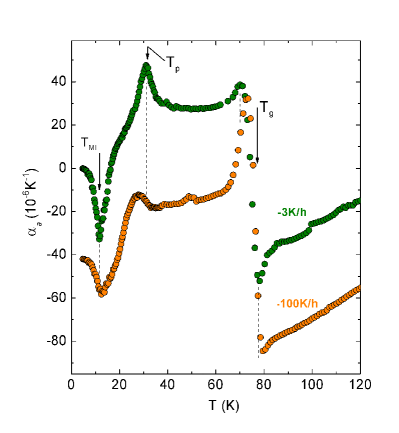
A broadening of the transition, accompanied by a reduction in the size of the peak anomaly at 30 K, which is related to the critical end-point of the first-order Mott MI transition line in the phase diagram, and the Mott MI temperature 13.6 K, is observed for fast cooling ( K/h). Another remarkable feature is that the peak position of the = 30 K anomaly shifts toward lower temperatures, while the anomaly at = 13.6 K shifts slightly to higher temperatures. Based on these observations, one can conclude that the increase of the cooling speed through results in an opposite effect to that observed upon applying quasi-uniaxial pressure (Section III.4). The observed shift of towards higher temperatures under fast cooling is in agreement with literature results Jens2002-20 . Resistivity measurements on -D8-Br salts Griesshaber20e ; Griesshaber99 , synthesized by employing the same method as that used for the salts studied in this work, revealed that under a fast cooling speed TEref the resistance increases dramatically below 80 K, superconductivity is suppressed, giving way to a residual resistance ratio of 5. This feature together with the observed enhancement of the anomaly in on fast cooling (Fig. 24) can be assigned to an increase of the scattering provoked by the randomly distributed potential of the polymeric Cu[N(CN)2]Br- anion. A similar situation is encountered in the quasi-1D (TMTSF)2ClO4 superconductor salt, where by rapid cooling (50 K/min) superconductivity is destroyed, giving way to a first-order anion-ordering transition at = 24 K, which is accompanied by a spin-density wave transition around 6 K Ishiguro20 .
IV Mott Criticality
Before discussing the Mott criticality in detail, let us first present a general discussion about critical behavior and universality classes.
IV.1 Critical Behavior and Universality Classes
Continuous phase transitions involve fluctuations on all length scales, leading to the remarkable phenomenon called universality. While details of the interaction do not matter, only robust properties of the system like its effective dimensionality, the absence or presence of long-range interactions or the symmetry of relevant low-energy fluctuations determine the low-energy behavior. As a consequence, it is possible to classify continuous phase transitions according to their universality classes.
In real materials, upon approaching the critical temperature, fluctuations are no longer negligible. The more the critical temperature is approached, the stronger are the fluctuations. Finally, fluctuations succeed in destroying the original phase and a new phase, often with distinct symmetries, emerges. To distinguish the two different phases, one usually tries to introduce an order parameter as the expectation value of some field which vanishes in one phase but not the other.
The transition is, in many cases, accompanied by broadening effects due to crystal defects or inhomogeneities. Amazingly, around some physical quantities tend to obey power laws in the reduced temperature , which measures the relative distance to the transition temperature. As a consequence of universality, the divergence of the compressibility of water in the vicinity of its critical point is described by exactly the same power-law dependence as the divergence of the susceptibility of a uniaxial magnet in the vicinity of the Curie temperature. In such a uniaxial magnet, the spins can only align themselves parallel or anti-parallel to a given crystal axis. As the magnetization is finite in the symmetry-broken state below and vanishes above , the expectation value of the magnetization may serve as an order parameter.
Concerning thermodynamic properties, one usually defines the four critical exponents , , , and , which in the case of magnets are related to the specific heat (at constant pressure) , the spontaneous magnetization , and the susceptibility . More generally, and describe the order parameter and the order parameter susceptibility. Usually, is used in the literature to refer to the specific heat critical exponent. In order to avoid any confusion with the linear thermal expansion coefficient , here, is used to refer to the specific heat critical exponent.
Close to criticality, one expects the following power-law behavior,
| (5) |
| (6) |
| (7) |
| (8) |
While the amplitudes , , , and are non-universal and the coefficients and governing the behavior for are generally different from the corresponding coefficients and for , the ratios and are in fact universal, i.e. they are not material-specific and only depend on the underlying universality class. In fact, not all of the above exponents are independent. Using concepts of scaling or the renormalization group, the following identities can be derived Huang1b ; GoldenfeldBook ; CardyBook ; KardarBook ; KopietzBook ,
| (9) |
| (10) |
These two relations are frequently called the Rushbrooke and Widom identities. It is striking to note that in the study of critical behavior near a second-order phase transition, materials displaying completely different crystal structures as well as quite different subsystems obey the same critical behavior near , giving thus rise to the universality classes. The theoretical values for the critical exponents of different universality classes accompanied by an example of a phase transition are listed in Table 3. It should be noted that sufficiently far away from the transition, fluctuations can largely be ignored and mean field behavior prepails. More precisely, corrections to mean field theory can only be expected to become important for temperatures satisfying
| (11) |
where
| (12) |
is the Ginzburg scale. Here, is the effective dimensionality of the system, is the jump of the specific heat across the phase transition, and is the bare coherence length. In three dimensions, the universal dimensionless proportionality constant introduced here is given by Levanyuk59 ; Ginzburg60 , which is much smaller than 1.
Quite generally, a crossover is expected near from mean field to non-mean field behavior. If, however, the bare coherence length is sufficiently large, the non-mean field regime can turn out to be unmeasurably small. In conventional superconductors, for example, the size of the bare coherence length can be one thousand the size of the lattice spacing, leading to . As a consequence, mean field theory is essentially exact.
| Universality class | Examples of phase transition | ||||
| Mean-field | 0 | 0.5 | 1.0 | 3.0 | Superconducting transition in conventional superconductors or Mott MI transition in (V1-xCrx)2O3 Limelette03-9d3 |
| 2D Ising | 0 | 0.125 | 1.75 | 15 | Preroughening transition in GaAs Labella2000-9d |
| 3D Ising | 0.110(1) | 0.3265(3) | 1.2372(5) | 4.789(2) | Liquid-gas transition |
| 3D XY | -0.0151(3) | 0.3486(1) | 1.3178(2) | 4.780(1) | Superfluid transition in 4He Lipa96 |
| 3D Heisenberg | -0.1336(15) | 0.3689(3) | 1.3960(9) | 4.783(3) | Ferromagnetic transition in a clean and isotropic ferromagnet |
| Unconventional Criticality | 1 | 1 | 1 | 2 | Mott MI transition in -(BEDT-TTF)2Cu[N(CN)2]Cl Kagawa2005_20 |
From the experimental point of view, the estimate of critical exponents can be a hard task. For instance, owing to the specific heat critical exponent , a reliable estimate of the phonon background can be one of the crucial points. In addition, for a reliable estimate of the critical behavior of a system, fine measurements close to are necessary. Accurate measurements of e.g. the specific heat are required over several orders of magnitude of . For real materials, a broadening of the transition due to inhomogeneities (impurities or crystal defects) is frequently observed. Due to this, cannot be measured directly, but is rather obtained indirectly via self consistent fittings.
IV.2 Scaling ansatz for the Mott metal-insulator transition
In 2005, in a stimulating article entitled “Unconventional Critical Behaviour in a Quasi-2D Organic Conductor”, Kagawa and collaborators reported on the criticality at the pressure-induced Mott transition in the organic -(BEDT-TTF)2Cu[N(CN)2]Cl charge-transfer salt Kagawa2005_20 . In this study, the authors made use of the isothermal pressure-sweep technique, using helium as a pressure transmitting medium, to explore the critical behavior of this organic salt through conductance measurements. The pressure-sweep technique had been previously applied by Limelette and collaborators Limelette03-9d3 to study the Mott critical behavior of Cr-doped V2O3, which is now recognized as a canonical Mott insulator system and behaves mean-field like. Very close to the transition the authors also claim Ising universality. In contrast to -(BEDT-TTF)2Cu[N(CN)2]Cl, chromium-doped vanadium sesquioxide is a truly three-dimensional material. In the study of the quasi-two-dimensional charge-transfer salt -(BEDT-TTF)2Cu[N(CN)2]Cl, the critical behavior of the conductance data at the critical endpoint was analyzed in the framework of the scaling theory of the liquid-gas transition Kadanoff9d1 . For simplicity, in the so-called non-mixing approximation, the rescaled pressure and the rescaled temperature were used as two independent scaling variables to obtain the critical exponents , , and , as listed in Table 3. Substituting these values in the Rushbrooke relation one obtains = 1. As pointed out by the authors, the obtained critical exponents do not fit in the well-known universality classes, indicating the experimental discovery of a new universality class. A possible explanation of the experimentally observed exponents of unconventional criticality was given by Imada and collaborators Imada05 ; Imada10 .
The appearance of unconventional critical exponents came as a surprise to many who expected Ising universality. This expectation was based on an argument by Castellani et al. Castellani79 who argued that, even though there is no symmetry breaking, the double occupancy of lattice sites can serve as an order parameter. While doubly occupied (or empty) sites are localized on the insulating side of the phase transition, they do proliferate on the metallic site. The order parameter was therefore expected to be of an Ising type. The Mott criticality was also studied in the framework of dynamical mean-field theory of the Hubbard model by Kotliar et al. Kotliar . These authors confirmed the statement that the Mott transition should lie in the Ising universality class. Having a phase transition between a low-density gas of localized doubly occupied or empty lattice sites to a high-density fluid of unbound doubly occupied or empty lattice sites is quite analogous to the well-known liquid-gas transition which lies also in the Ising universality class.
An attempt to reconcile the experimentally observed unconventional critical exponents , , and with the well-established two-dimensional Ising universality class was made by Papanikolaou and collaborators Papanikolaou2008_20 . These authors pointed out that the critical exponents derived from transport measurements do not necessarily coincide with the thermodynamic critical exponents which are defined in terms of an order parameter. According to Papanikolaou et al. Papanikolaou2008_20 , the singular part of the conductivity does not only depend on the singular part of the order parameter, but also depends on the related energy density. As a consequence, is given by
| (13) |
Here, and are non-universal coefficients, is the order parameter and . In an extended regime not too close to the critical point the first term on the r.h.s. can be much smaller than the second one such that
| (14) |
It then follows that the critical exponents as obtained from the conductivity can be expressed in terms of the thermodynamic critical exponents as follows Papanikolaou2008_20 : , , and . In particular, for the 2D Ising universality class one obtains with the exponents , , and which within the experimental resolution are consistent with the exponents obtained by Kagawa et al. Kagawa2005_20 .
To explain the lattice response in the vicinity of the MI finite temperature critical end point and explain the corresponding peak in the thermal expansivity a description in terms of critical exponents is not sufficient unless the pressure is tuned to its critical value. Instead, the usage of a scaling theory was proposed in LABEL:Bartosch. While such an approach is extremely general and can be applied to any universality class, it was shown in LABEL:Bartosch that the expansivity data of LABEL:Mariano20f1 is in fact consistent with 2D Ising criticality: Within the scenario of two-parameter scaling, the Gibbs free energy can be written as
| (15) |
Here, is a universal scaling function which only depends on the universality class, and are the two (suitably normalized) scaling variables, and and are their corresponding RG eigenvalues. These are the two relevant eigenvalues of the underlying universality class and determine all critical exponents. For example, or (see e.g. Refs. GoldenfeldBook ; CardyBook ; KardarBook ; KopietzBook ). Conventionally, and can be thought of as temperature- and pressure-like quantities, but more generally there are also linear mixing terms such that and . In fact, very close to the transition Hooke’s law of elasticity breaks down and one should expect compressive strain to enter linearly the scaling variables instead of pressure, see below and LABEL:Zacharias.
The appearance of the mixing terms is a consequence of the experimental fact that the first-order transition line ending in the critical point is not parallel to the axis, see Fig. 7. While the linear mixing terms turn out to be important for a quantitative description of the expansivity data Bartosch , let us for simplicity focus here on the much simpler case of no mixing. For the Ising universality class, and . Having one integer-valued RG eigenvalue, logarithmic corrections to scaling should be expected CardyBook . As it turns out, the scaling ansatz for the Ising universality class requires a correction term and reads Fonseca03
| (16) |
Differentiating twice with respect to and setting equal to zero one then obtains the well-known logarithmic divergence of the specific heat . Assuming no mixing terms, the singular part of the thermal expansivity is given by Papanikolaou2008_20
| (17) |
As a consequence, the Grüneisen ratio diverges for as Bartosch
| (18) |
Let to emphasize here that the true divergence of the Grüneisen parameter is a consequence of neglecting linear mixing terms. Including such mixing terms effectively leads to a saturation of the Grüneisen parameter at a very large value. It was estimated in LABEL:Bartosch that the crossover scale for the D8-Br crystals is of order 0.1 bar and thus for most practical purposes beyond experimental resolution. The smallness of this crossover scale can be related via the Clausius-Clapeyron equation to comparatively small entropy differences between the metallic and insulating phases.
The Grüneisen ratio is also known to diverge at a quantum critical point Zhu03 .
In the case there is no divergence in the specific heat, implying that the specific heat is bounded and can safely be replaced by a constant. This has interesting consequences for the universality class of unconventional criticality for which and . In this case both the expansivity and the specific heat stay finite such that there is no divergence of the Grüneisen ratio. Still, there is no reason to expect the expansivity to be proportional to the specific heat, i.e. Grüneisen scaling breaks down.Bartosch
To describe the expansivity of the -ET salts away but close to criticality, i.e. for , we can express the singular part of the expansivity in terms of derivatives of the scaling function . Differentiating Eq. (16) with respect to and , one obtains Bartosch
| (19) |
with the scaling function given by
| (20) |
Even though the 2D Ising model can be solved exactly, there is no known exact expression for the scaling function and hence no exact expression for . Nevertheless [and hence ] can be calculated with very high accuracy numericallyFonseca03 ; Bartosch , for a plot see Fig. 25.

With this scaling function at hand, the singular part of the thermal expansivity can now be plotted as a function of and , see Fig. 26. This singular part of the thermal expansivity corresponds to the critical region in the pressure-temperature phase diagram. The first-order transition line is simply represented by the jump in for and which describes the change in volume . It should be noted that every cut of the graph for constant is just a rescaled version of the scaling function , as shown graphically in Fig. 25. Also, the change of sign of with a change of sign of can clearly be seen. While a constant pressure corresponds to a constant in the non-mixing approximation, in the case of linear mixing terms a constant corresponds to cutting the graph in Fig. 26 at an angle.
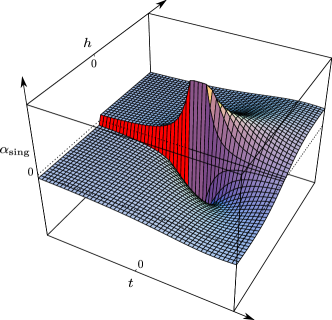
Fitting the thermal expansivity of the D8-Br crystals Mariano20f1 # 1 and # 3 by a scaling form of the thermal expansivity based on Eq. (19) on top of a linear background including linear mixing terms gives indeed an excellent fit for the Ising universality class Bartosch , see Fig. 27.
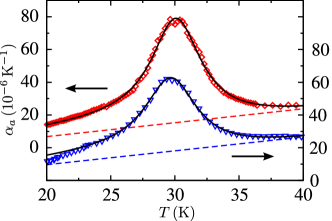
Even though the Ising universality class leads to an excellent fit of the dilatometric data, we would like to stress here that this is by far no proof of Ising universality. NMR mearsurements of obey roughly , with , as also obtained from conductance measurements Kagawa2005_20 . As far as we know, the NMR measurements have not found a natural explanation based on Ising criticality yet.
Notwithstanding the analogy between the Mott MI and the liquid-gas transition, differences do exist and the compressible MI with its long-range shear forces should rather be classified as a solid-solid transition Zacharias . Hopping matrix integrals do depend on the distance between neighboring atoms, such that the Mott MI transition is sensitive to elastic strain and couples only indirectly to the applied stress, e.g. compressive pressure. As described in detail in LABEL:Zacharias and similarly also in the context of the compressible Hubbard model in LABEL:Hassan2005-20, the homogeneous component of the strain can be obtained by minimizing the effective potential density
| (21) |
where both and are linear functions of and , is the bare bulk modulus, and is an offset pressure. For simplicity, we have replaced all tensorial quantities by scalars. It was shown in LABEL:Zacharias that while not too close to the critical end point Hooke’s law holds and our above treatment was legitimate, the feedback of the electronic subsystem back on the lattice drives the effective bulk modulus to zero even above the phase transition described by alone, thereby leading to a violation of Hooke’s law and a preempted phase transition. This phase transition was explicitly shown to be governed by Landau criticality with mean-field exponents.
While there is no final answer on the universality class underlying the Mott transition in the -ET charge-transfer salts yet, we hope that future experiments will shed more light on this issue.
V Thermal Expansion Measurements on -(ET)2Cu2(CN)3
The thermal expansion coefficient along the in-plane c-axis for crystal #1 of the salt -(ET)2Cu2(CN)3 is shown in Fig. 28. Recall that this is the spin-liquid candidate. Upon cooling, decreases monotonously down to 30 K. Around = 150 K, indications of a small and broad hump are observed. In LABEL:Shimzu2003, Shimizu and collaborators observed an enhancement of the spin relaxation rate above 150 K, which was attributed to the freezing of the thermally activated vibration of the ethylene end groups. Note that no traces of a glass-like anomaly around = 77 - 80 K are observed. This behavior is quite distinct from that observed in -(ET)2Cu[N(CN)2]Cl (see LABEL:Jens2002-20) and -D8-Br (discussed in Section III) and -H8-Br Jens2002-20 , where clear signatures in the thermal expansion coefficient show up at 77 K. This discrepancy indicates that the lattice dynamic for the -(ET)2Cu2(CN)3 salt is different from that of the above-mentioned compounds. In fact, according to the RUM model, introduced in Section III.1, the absence of a glass-like anomaly in the -(ET)2Cu2(CN)3 salt can be understood in the following way: the anion Cu2(CN) (Fig. 6) consists of a 2D network of Cu(I) and bridging cyanide groups Geiser1991 . As the Cu2(CN) anion is arranged in a network fashion, which is quite different from the polymeric arrangement of Cu[N(CN)2]Cl- and Cu[N(CN)2]Br- (Fig. 6), the vibration modes of the CN groups are confined between nearest Cu(I) atoms, so that they cannot propagate along the structure. Hence, the formation of RUM in -(ET)2Cu2(CN)3 is very unlikely and as a consequence no signatures of the glass-like transition can be observed. Cooling the system further, another broad hump is observed at 70 K. The latter coincides roughly with a broad maximum observed in magnetic susceptibility measurements Shimzu2003 . Below 50 K, assumes negative values. Cooling the system further, a broad minimum is observed at 30 K. Below 14 K, starts to assume positive values. A possible scenario for explaining the negative thermal expansion in the temperature range 14 K 50 K is discussed in the following. In this temperature range, lattice vibration modes (most likely from the anion) become soft, the Grüneisen parameter in turn assumes negative values and the lattice expands upon cooling. Interestingly enough, negative thermal expansion has been also observed in amorphous Y100-xFex (x = 92.5 and 84) alloys over the temperature range in which these systems go from the paramagnetic to the spin-glass state. The latter feature is assigned to the thermal dependence of the spin fluctuations Fujita1994 . Thus, for the spin-liquid candidate the hypothesis of negative thermal expansion driven by spin degrees of freedom cannot be ruled out. In fact, the connection between negative thermal expansion and frustration has been reported in the literature, but a theory able to describe these phenomena is still lacking Schlesinger2008 . Upon further cooling, a huge anomaly is observed at 6 K. The latter coincides with the hump anomaly observed in specific heat measurements Yamashita2008 . This finding constitutes the first observation of lattice effects associated with the transition (or crossover/hidden ordering) at 6 K. A further analysis of the present data is difficult because the actual phonon background cannot be estimated. The low-temperature data will be discussed in more detail in the following. Fig. 29 shows the thermal expansion coefficient below 14 K on expanded scales.
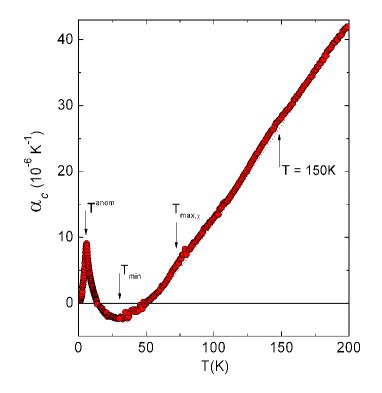
Upon cooling below 6 K, a hump at 2.8 K is observed. Several runs were performed in order to check for reproducibility. The latter feature has not been observed in specific heat measurements Yamashita2008 , most likely due to the lack of resolution of such experiments.
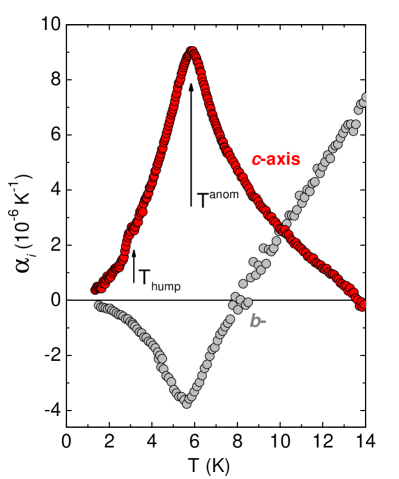
The signatures observed in have their direct correspondence in the spin-lattice relaxation rate () and magnetic susceptibility () Shimzu2003 . Below 50 K, both quantities decrease monotonously with temperature down to 4 K, where starts to increase and shows a broad maximum at 1 K, while varies smoothly Shimzu2003 . Thermal expansion measurements under magnetic fields (inset of Fig. 30) revealed that under 8 T, the peak position around 6 K as well as the hump at 2.8 K remain unaltered, in agreement with specific heat measurements under a magnetic field Yamashita2008 , indicating that the anomaly at 6 K is unlikely to be due to long-range magnetic ordering, at least for magnetic fields applied parallel to the c-axis. At this point, it is worthwhile mentioning that for the “spin ice” system Dy2Ti2O7 Ramirez99 , already mentioned previously, the spins’ disorder is suppressed when a magnetic field is applied perpendicular to their Ising axis. In addition, measurements on cooling and warming (main panel of Fig. 30) revealed no traces of hysteretic behavior, at least in the resolution of the present experiments, so that the hypothesis of a first-order transition can be ruled out.
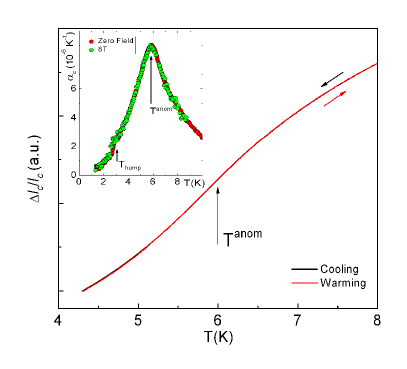
Hence, the actual origin of the anomaly in at 6 K remains unclear. However, at first glance, the present thermal expansion findings appear to fit in the model proposed by Lee et al. Lee2007 , which we described briefly at the end of the introduction. According to this model, spin pairing on the Fermi surface generates a spontaneous breaking of the lattice symmetry, giving rise to a phase transition at finite temperature, which in turn is coupled to a lattice distortion. In other words, upon cooling, the spin entropy has to be (partially) frozen. The only way for this, without long-range magnetic ordering, is to introduce a lattice distortion. This process presents some similarities with a classical Spin-Peierls transition, where the formation of a singlet state requires that the spin entropy of the triplet state goes to zero by introducing a lattice distortion. In the present case, the amount of entropy in the temperature range 0.3 K 1.5 K corresponds to only a few percent of ln 2 Yamashita2008 , indicating therefore that only a minor part of the total number of spins contribute to the spin-liquid phase. Interestingly enough, the shape of the transition at 6 K (Fig. 29) resembles the shape of the anomaly in the thermal expansion coefficient associated with the Spin-Peierls transition for the quasi-1D organic conductors (TMTTF)2X (X = PF6 and AsF6) Mariano2008 . Hence, the sharp lattice distortion at 6 K seems to be associated with a real phase transition and not with a crossover, as proposed in LABEL:Yamashita2008. In fact, thermal expansion measurements along the second in-plane b-axis revealed striking anisotropic in-plane lattice effects SL . Interestingly enough, along the in-plane b-axis (see Fig. 29) a negative anomaly is observed at 6 K, indicating that below a lattice expansion (shrinkage) along the c-axis (b-axis) occurs. The observed distinct in-plane anisotropy implies that the hopping integral terms and are strongly affected.
It remains to be seen whether -(ET)2Cu2(CN)3 is in fact in a spin-liquid state for . In this sense, thermal expansion measurements at very low temperatures along the a-, b- and c-axes are required in order to achieve a better understanding of the physics of this exciting material. Such experiments will reveal, for example, whether below 1.3 K / behaves linearly and remains finite as 0, as observed in specific heat measurements Yamashita2008 or if / decreases exponentially. As already mentioned at the end of the introduction, it was more recently reported Yamashita09 that the thermal conductivity of -(ET)2Cu2(CN)3 is described by an activated behavior with a gap 0.46 K. The latter results are at odds with the specific heat measurements performed by S. Yamashita et al. Yamashita2008 . Based on such results, one can see that a full picture of the fundamental aspects of the spin-liquid phase in -(ET)2Cu2(CN)3 is still incomplete and requires further investigations.
VI Conclusions and Perspectives
In this review, we have addressed one of the central questions in the field of strongly correlated electron systems, whether lattice degrees of freedom play a role for several physical phenomena, among them the Mott MI transition. Molecular conductors of the -(BEDT-TTF)2X family have been revealed as model systems for the study of the latter phenomena. The main findings discussed in this review are summarized below.
High-resolution thermal expansion measurements on fully deuterated salts of -(BEDT-TTF)2Cu[N(CN)2]Br revealed pronounced lattice effects at the Mott metal-to-insulator transition temperature = 13.6 K, accompanied by a striking anisotropy. While huge effects are observed along the in-plane a-axis, along which the polymeric anion chains are aligned, an almost zero effect is observed along the second in-plane c-axis, along which the polymeric anion chains are linked via Br-N weak contacts. Still more amazing is the observation of pronounced lattice effects along the out-of-plane b-axis. These findings provide strong evidence that the Mott transition for the present class of materials cannot be fully understood in the frame of a purely 2D electronic triangular dimer model. Even though there is still an ongoing debate about the universality class and possible crossover scales of the Mott transition, the scaling theory reviewed here can be used with any universality class. Candidates suggested for the Mott transition in the -ET salts are unconventional criticality Kagawa2005_20 ; Imada05 ; Imada10 , 2D Ising Papanikolaou2008_20 , and a crossover to Landau criticality Zacharias . It was explicitly shown that the thermal expansivity data for the -D8-Br salt is consistent with 2D Ising criticality Bartosch , which of course does not provide a proof of this universality class. Finally, the experimentally observed critical exponent was also argued to be due to subleading quantum effects preceding an asymptotic critical regime Semon12 .
In order to achieve a better understanding of the Mott transition in the present material, thermal expansion measurements were taken under magnetic field, quasi-uniaxial pressure as well as by employing different cooling speeds across the glass-like transition. For example, measurements under magnetic field reveal that the Mott MI insulator transition temperature is insensitive to magnetic fields up to 10 T, which is in agreement with the picture of a Mott insulator with a hole localized on a dimer formed by an ET molecule. A magnetic field-induced first-order phase transition at 9.5 K for a field applied along the out-of-plane b-axis was observed, indicative of a spin-flop transition with strong magneto-elastic coupling. Measurements under quasi-uniaxial pressure applied along the out-of-plane b-axes revealed effects in contrast to those observed upon increasing the cooling speed across the glass-like transition. While quasi-uniaxial pressure shifts towards lower temperatures and to higher temperatures, the opposite situation is observed upon fast cooling through the glass-like transition. Interestingly enough, the so-called glass-like transition temperature remains unaffected under quasi-uniaxial pressure. Although by means of thermal expansion measurements one has access to the macroscopic behavior of the sample studied, the strong anisotropic lattice effects observed, marked by a negative thermal expansion above , enable us to draw some conclusions at the microscopic level. Hence, a model within the rigid-unit-mode scenario, taking into account the low-energy vibration modes of the cyanide ligands of the polymeric anions Cu[N(CN)2]Br-, was proposed to describe the negative thermal expansion above the 77 K. In this model, low-energy vibration modes of the cyanide groups of the polymeric anion chains become frozen upon cooling down to , shrinking thus the a lattice parameter upon warming the system above .
Additional experiments, including magnetostriction measurements both above and below the magnetic field-induced phase transition temperature as well as magnetic measurements with thoroughly aligned along the out-of-plane -axis, will certainly help to achieve a better understanding of the behavior of almost localized correlated electrons in this interesting region of the phase diagram of the -phase of (BEDT-TTF)2X charge-transfer salts. A theoretical study of the stability of the Mott insulating state and the neighboring superconducting phase, taking into account magnetic field-induced lattice effects, is highly desired as well. We have here presented a phenomenological description of the Mott metal-insulator transition within a scaling theory. While transport measurements revealed unconventional critical exponents, it would be desirable to have direct access to thermodynamic quantities. In particular, we hope that future expansivity measurements under pressure might give rise to a better understanding.
We have also examined in this review thermal expansion measurements on the -(BEDT-TTF)2Cu2(CN)3 salt, a system which is proposed as a candidate for the realization of a spin-liquid ground state. Measurements taken along the in-plane c-axis reveal some interesting aspects, which can be of extreme importance for a wider understanding of the physical properties of this material. For example, the absence of the so-called glass-like transition in -(BEDT-TTF)2Cu2(CN)3 is in line with the above-mentioned model within the rigid-unit modes scenario. While the anion Cu[N(CN)2]Br- is arranged in form of chains weakly linked via Br-N contacts, the anions Cu2(CN) are arranged in a 2D network fashion, so that the cyanide groups are confined between the Cu atoms and therefore the vibration modes associated with the cyanide groups cannot propagate along the structure as it occurs, for example, in fully deuterated salts of -(BEDT-TTF)2Cu[N(CN)2]Br, cf. the discussion above. A negative thermal expansion is observed in the temperature range 14 50 K. In addition, the thermal expansion coefficient reveals a huge anomaly, indicative of a phase transition at = 6 K, coinciding nicely with a hump in the specific heat, which has been assigned to a crossover to the quantum spin-liquid state. Last but not least, during the preparation of the final version of this article, a theoretical treatment for the thermal expansivity of the charge-transfer salts of the -(BEDT-TTF)2X family based on electronic correlations was proposed by Kokalj and McKenzie Mac . These authors consider both the dependence of the system entropy on the Hubbard parameters , , and the dependence with temperature of the double occupancy and bond-orders to describe the thermal expansion of these materials.
Acknowledgements
We would like to thank A. Brühl, M. Dressel, R.M. Fernandes, M. Garst, A.A. Haghighirad, K. Kanoda, S. Köhler, P. Kopietz, R.S. Manna, R.E.L. Monaco, J. Müller, R. Paupitz, J.-P. Pouget, B. Powell, T. Sasaki, J.A. Schlueter, J. Schmalian, D. Schweitzer, A.C. Seridonio, Ch. Strack, R. Urbano, B. Wolf, M. Zacharias
and in particular M. Lang
for valuable discussions and collaborations along the years.
MdS acknowledges financial support from the DFG via SFB/TRR 49, São Paulo
Research Foundation – Fapesp (Grants No. 2011/22050-4) and National Counsel of Technological and Scientific Development – CNPq (Grants No. 308977/2011-4).
References
- (1) A. Kawamoto, K. Miyagawa and K. Kanoda, Phys. Rev. B 55, 14140 (1997).
- (2) M. de Souza, A. Brühl, Ch. Strack, B. Wolf, D. Schweitzer and M. Lang, Phys. Rev. Lett. 99, 037003 (2007).
- (3) M. de Souza, Ph.D. Thesis (2008) University of Frankfurt. [http://publikationen.ub.uni-frankfurt.de/volltexte/2009/6240/].
- (4) L. Bartosch, M. de Souza and M. Lang, Phys. Rev. Lett. 104, 245701 (2010).
- (5) M. Zacharias, L. Bartosch, and M. Garst, Phys. Rev. Lett. 109, 176401 (2012).
- (6) S. Yamashita, Y. Nakazawa, M. Oguni, Y. Oshima, H. Nojiri, Y. Shimizu, K. Miyagawa and K. Kanoda, Nature Physics 4, 459 (2008).
- (7) H.O. Jeschke, M. de Souza, R. Valentí, R.S. Manna, M. Lang, J. A. Schlueter, Phys. Rev. B 85, 035125 (2012).
- (8) Y. Shimizu, K. Miyagawa, K. Kanoda, M. Maesato and G. Saito, Phys. Rev. Lett. 91, 107001-1 (2003).
- (9) L. Balents, Nature 464, 199 (2010).
- (10) M. Lang, Superconductivity Review 2, 1 (1996).
- (11) M. Lang and J. Müller, Organic Superconductors in The Physics of Superconductors Vol. II, K.H. Bennemann, J.B. Ketterson (eds.) p. 435-554 (Springer-Verlag), Berlin (2004).
- (12) T. Ishiguro and K. Yamaji, Organic Superconductors in Springer Series in Solid-State Sciences 88, Springer-Verlag, Germany (1990).
- (13) D. Jérome, The Physics of Organic Superconductors, in Science, New Series 252, 1509 (1991).
- (14) R.H. McKenzie, Comments Condensed Matter Physics 18, 309-337 (1998).
- (15) J. Wosnitza, Studies of High Temperature Superconductors 34, Nova Science Publishers, 97-131 (2000).
- (16) J. Singleton, Journal of Solid State Chemistry 168, 675 (2002).
- (17) K. Miyagawa, K. Kanoda and A. Kawamoto, Chem. Rev. 104, 5635-5653 (2004).
- (18) H. Fukuyama, J. Phys. Soc. Jpn. 75, 051001-1 (2006).
- (19) H. Mori, J. Phys. Soc. Jpn. 75, 051003-1 (2006).
- (20) K. Kanoda, J. Phys. Soc. Jpn. 75, 051007-1 (2006).
- (21) B.J. Powell and R.H. McKenzie, J. Phys.: Condens. Matter 18, R827-R866 (2006).
- (22) N. Toyota, M. Lang and J. Müller, Low-Dimensional Molecular Metals, Springer, Germany (2007).
- (23) K. Kanoda and R. Kato, Annu. Rev. Condens. Matter Phys. 2, 167 (2011).
- (24) B. J. Powell and R. H. McKenzie, Rep. Prog. Phys. 74, 056501 (2011).
- (25) J. Müller, M. Lang, F. Steglich, J. A. Schlueter, A.M. Kini and T. Sasaki, Phys. Rev. B 65, 144521 (2002).
- (26) T. Sasaki, N. Yoneyama, N. Kobayashi, Y. Ikemoto and H. Kimura, Phys. Rev. Lett. 92, 227001 (2004).
- (27) B. Salameh, Ph.D. Thesis, University of Stuttgart (2005).
- (28) H. C. Kandpal, I. Opahle, Y.-Z. Zhang, H. O. Jeschke, and R. Valenti, Phys. Rev. Lett. 103, 067004 (2009).
- (29) K. Nakamura, Y. Yoshimoto, T. Kosugi, R. Arita, and M. Imada, J. Phys. Soc. Jpn. 78, 083710 (2009).
- (30) J.A. Schlueter, U. Geiser, M.A. Whited, N. Drichko, B. Salameh, K. Petukhov and M. Dressel, Dalton Transactions 2007, 2580 (2007).
- (31) J.A. Schlueter, L. Wiehl, H. Park, M. de Souza, M. Lang, H.J. Koo and M.H. Whangbo, Journal of the American Chemical Society 132, 16308 (2010).
- (32) A. M. Kini, U. Geiser, H.H. Wang, K.D. Carlson, J.M. Williams, W.K. Kwok, K.G. Vandervoort, J.E. Thompson, D.L. Stupka, D. Jung and M.-H. Whangbo, Inorg. Chem. 29, 2555 (1990).
- (33) U. Geiser, H.H. Wang, K.D. Carlson, J.M. Williams, H.A. Charlier, J.E. Heindl, G.A. Yaconi, B.J. Love, M.W. Lathrop, J.E. Schirber, D.L. Overmyer, J. Ren and M.-H. Whangbo, Inorg. Chem. 30, 2586 (1991).
- (34) For the -(ET)2Cu2(CN)3 salt, the a-axis is the out-of-plane direction.
- (35) U. Geiser, A.J. Schutz, H.H. Wang, D.M. Watkins, D.L. Stupka, J.M. Williams, J.E. Schirber, D.L. Overmyer, D. Jung, J.J. Novoa and M.-H, Whangbo, Physica C 174, 475 (1991).
- (36) K. Kanoda, Hyperfine Interact. , 235 (1997).
- (37) R.H. Mckenzie, Science 278, 820 (1997).
- (38) E. Dagoto, Science 309, 257 (2005).
- (39) O.J. Taylor, A. Carrington and J.A. Schlueter, Phys. Rev. Lett. 99, 057001 (2007).
- (40) For the Mott insulator V2O3, for example, a pressure of a few kbar is required to cross the first-order line in the - phase diagram Limelette03-9d3 .
- (41) S. Lefebvre, P. Wzietek, S. Brown, C. Bourbonnais, Jérome, C. Méziere, M. Fourmigué and P. Batail, Phys. Rev. Lett. 85, 5420 (2000).
- (42) M.-S. Nam, A. Ardavan, S.J. Blundell and J.A. Schlueter, Nature 449, 584 (2007).
- (43) P. Limelette, P. Wzietek, S. Florens, A. Georges, T.A. Costi, C. Pasquier, D. Jérome, C. Mézière and P. Batail, Phys. Rev. Lett. 91, 016401 (2003).
- (44) D. Fournier, M. Poirier, M. Castonguay and K.D. Truong, Phys. Rev. Lett. 90, 127002 (2003).
- (45) M. Lang, M. de Souza, A. Brühl, Ch. Strack, B. Wolf, J.A. Schlueter, J. Müller and D. Schweitzer, Proceedings of the 8th Intern. Conf. on Materials and Mechanisms of Superconductivity - High Temperature Superconductors, Physica C 460-462, 129 (2007).
- (46) F. Kagawa, T. Itou, K. Miyagawa and K. Kanoda, Phys. Rev. B 69, 064511 (2004).
- (47) F. Kagawa, K. Miyagawa and K. Kanoda, Nature 436, 534 (2005).
- (48) S. Papanikolaou, R.M. Fernandes, E. Fradkin, P.W. Phillips, J. Schmalian and R. Sknepnek, Phys. Rev. Lett. 1, 026408 (2008).
- (49) P. Lunkenheimer, J. Müller, S. Krohns, F. Schrettle, A. Loidl, B. Hartmann, R. Rommel, M. de Souza, C. Hotta, J.A. Schlueter and M. Lang, Nature Materials 11, 755 (2012).
- (50) Y. Kurosaki, Y. Shimizu, K. Miyagawa, K. Kanoda and G. Saito, Phys. Rev. Lett. 95, 177001-1 (2005).
- (51) Ch. Strack, C. Akinci, V. Pashchenko, B. Wolf, E. Uhrig, W. Assmus, M. Lang, J. Schreuer, L. Wiehl, J. A. Schlueter, J. Wosnitza, D. Schweitzer, J. Müller and J. Wykhoff , Phys. Rev. B 72, 054511 (2005).
- (52) A. Kawamoto, K. Miyagawa, Y. Nakazawa and K. Kanoda, Phys. Rev. B 52, 15522 (1995).
- (53) S.R. Hassan, A. Georges and H.R. Krishnamurthy, Phys. Rev. Lett. 94, 036402 (2005).
- (54) J. Merino and R.H. McKenzie, Phys. Rev. B 62, 16442 (2000).
- (55) J. Singleton, P.A. Goddard, A. Ardavan, N. Harrison, S.J. Blundell, J.A. Schlueter and A. M. Kini, Phys. Rev. Lett. 88, 037001 (2002).
- (56) U. Welp, S. Fleshler, W.K. Kwok, G.W. Crabtree, K.D. Carlson, H.H. Wang, U. Geiser, J.M. Williams and V.M. Hitsman, Phys. Rev. Lett. 69, 840 (2000).
- (57) M. Pinterić, M. Miljak, N. Bis̃kup, O. Milat, I. Aviani, S. Tomić, D. Schweitzer, W. Strunz, and I. Heinen, Eur. Phys. J. B 11, 217 (2000).
- (58) K. Miyagawa, A. Kawamoto, Y. Nakazawa and K. Kanoda, Phys. Rev. Lett. 75, 1174 (1995).
- (59) F. Kagawa, T. Itou, K. Miyagawa and K. Kanoda, Phys. Rev. Lett. 93, 127001 (2004).
- (60) D.F. Smith, S.M. De Soto, C.P. Slichter, J.A. Schlueter, A.M. Kini and R.G. Daugherty, Phys. Rev. B 68, 024512 (2000).
- (61) D.F. Smith, C.P. Slichter, J.A. Schlueter, A.M. Kini and R.G. Daugherty, Phys. Rev. Lett. 93, 167002 (2004).
- (62) A. Kawamoto, M. Yamasita and K.-I. Kumagai, Phys. Rev. B 70, 212506 (2004).
- (63) K. Miyagawa, A. Kawamoto and K. Kanoda, Phys. Rev. Lett. 89, 017003 (2002).
- (64) P.W. Anderson, Mat. Res. Bull. 8, 153 (1973).
- (65) P.W. Anderson, Science 235, 1196 (1987).
- (66) A.P. Ramirez, Nature Physics 4, 442 (2008).
- (67) S.-S. Lee, P.A. Lee and T. Senthil, Phys. Rev. Lett. 98, 067006 (2007).
- (68) M. Yamashita, N. Nakata, Y. Kasahara, T. Sasaki, N. Yoneyama, N. Kobayashi, S. Fujimoto, T. Shibauchi, and Y. Matsuda, Nat. Phys. 5, 44 (2009).
- (69) Y. Qi, C. Xu, and S. Sachdev, Phys. Rev. Lett. 102, 176401 (2009).
- (70) F.L. Pratt, P.J. Baker, S.J. Blundell, T. Lancaster, S. Ohira-Kawamura, C. Baines, Y. Shimizu, K. Kanoda, I. Watanabe, and G. Saito, Nature 471, 612 (2011).
- (71) K. Hartke, Th. Kissel, J. Quante and R. Matusch, Chem. Ber. 113, 1898 (1980).
- (72) M. Mizuno, A. Garito and M. Cava, J. Chem. Soc. Chem. Commun. 1978, 18 (1978).
- (73) S. Gärtner, D. Schweitzer and H.J. Keller, Synthetic Metals 44, 227 (1991).
- (74) E. Grießhaber, Ph.D. Thesis (in German), University of Stuttgart (2000).
- (75) T.H.K. Barron , J.G. Collins and G.K. White, Thermal Expansion of Solids at Low Temperatures, Adv. Phys. 29, 609-730 (1980).
- (76) M. de Souza, P. Foury-Leylekian, A. Moradpour, J.-P. Pouget and M. Lang, Phys. Rev. Lett. 101, 216403 (2008).
- (77) M. de Souza, A. Brühl, Ch. Strack, B. Wolf, D. Schweitzer and M. Lang, Phys. Rev. Lett. 99, 037003 (2007).
- (78) R. S. Manna, M. de Souza, A. Bruehl, J. A. Schlueter and M. Lang, Phys. Rev. Lett. 104, 016403 (2010).
- (79) R. Manna, B. Wolf, M. de Souza and M. Lang, Rev. of Scientific Instr. 83, 085111 (2012).
- (80) M. Pregelj, A. Zorko, O. Zaharko, Z. Kutnjak, M. Jagodic, Z. Jaglicic, H. Berger, M. de Souza, C. Balz, M. Lang, and D. Arcon, Phys. Rev. B 82, 144438 (2010).
- (81) A. Jesche, C. Krellner, M. de Souza, M. Lang, C. Geibel, Physical Review B 81, 134525 (2010).
- (82) A. Jesche, T. Förster, J. Spehling, M. Nicklas, M. de Souza, R. Gumeniuk, H. Luetkens, T. Goltz, C. Krellner, M. Lang, J. Sichelschmidt, H.-H. Klauss, C. Geibel, Phys. Rev. B 86, 020501(R) (2012).
- (83) M. de Souza, D. Hofmann, P. Foury-Leylekian, A. Moradpour, J.-P. Pougetb, M. Lang, Physica B 405, S92 (2010).
- (84) A. Jesche, C. Krellner, M. de Souza, M. Lang, C. Geibel, New J. Phys. 11, 103050 (2009).
- (85) M. de Souza, A.-A. Haghighirad, U. Tutsch, W. Assmus, M. Lang, The European Physical Journal B-Condensed Matter and Complex Systems 77, 101 (2010).
- (86) M. de Souza and J.-P. Pouget, Journal of Physics: Condensed Matter 25, 343201 (2013).
- (87) M. de Souza, Andreas Brühl, Ch. Strack, D.Schweitzer, and M. Lang, Phys. Rev. B 86, 085130 (2012).
- (88) M. Kund, H. Mtiller, N. D. Kushch, K. Andres, and G. Saito, Synthetic Metals 70, 951 (1995).
- (89) R. Pott and R. Schefzyk, J. Phys. E 16, 445 (1983).
- (90) W. H. Fietz, K. Grube, and H. Leibrock, High Press. Res. 19, 373 (2000).
- (91) M. Köppen, M. Lang, R. Helfrich, F. Steglich, P. Thalmeier, B. Schmidt, B. Wand, D. Pankert, H. Benner, H. Aoki, and A. Ochiai, Phys. Rev. Lett. 82, 4548 (1999).
- (92) M. Lang, Ph.D. Thesis (in German), Darmstadt Technical University, Darmstadt (1991).
- (93) J. Müller, Ph.D. Thesis (in German), Max-Planck-Institute, Dresden, Germany (2001).
- (94) A. Brühl, Ph.D. Thesis (in German), University of Frankfurt (2007).
- (95) J.W. Loram, K.A. Mirza, C.P. Joyce and A.J. Osborne, Europhys. Lett. 8, 263 (1989).
- (96) This cooling speed ( 3 K/h) was employed in the temperature range 85 - 65 K. From room temperature down to 85 K as well as from 65 K down to 4.2 K, an average cooling speed of 40 K/h was employed.
- (97) Resistance measurements shown in Fig. 20 were carried out by C. Strack.
- (98) In employing = 80 10-6 K-1, obtained from the height of the anomaly in the thermal expansion coefficient for crystal #1 (Fig. 16), using the entropy change Jmol-1K-1 at the Mott MI transition, whose detailed deduction is presented in Section III.2, results in a jump of the specific heat of about 0.2 Jmol-1K-1. Details of this estimate are provided in Appendix 2. This value corresponds roughly to 0.4% of the background at in the specific heat (specific heat measurements on -D8-Br crystal #1 were performed by S. Köhler) employing ac calorimetric method, so that no signatures in the specific heat at could be detected.
- (99) D. Chasseau, Synth. Met., 42, 2039 (1991).
- (100) N. Toyota, Y. Watanabe, and T. Sasaki, Synthetic Metals 55, 2536 (1993).
- (101) R. Lakes, Sience 235, 1038 (1987).
- (102) In LABEL:Griesshaber20e Grießhaber refers to a cooling rate of 1 K/min as a slow cooling, while the rapid cooling rate is not mentioned.
- (103) A.U.B. Wolter, R. Feyerherm, E. Dudzik, S. Süllow, Ch. Strack, M. Lang and D. Schweitzer, Phys. Rev. B 75, 104512 (2007).
- (104) A.L. Goodwin, M. Calleja, M.J. Conterio, M.T. Dove, J.S.O. Evans, D.A. Keen, L. Peters and M.G. Tucker, Science 319, 794 (2008).
- (105) A.L. Goodwin and C.J. Kepert, Phys. Rev. B 71, 140301 (2005).
- (106) M. de Souza et al., unpublished results.
- (107) J.S.O. Evans, J. Chem. Soc., Dalton Trans. 19, 3317 (1999); G.D. Barrera, J.A.O Bruno, T.H.K. Barron and N.L. Allan, J. Phys.: Condens. Matter 17, R217 (2005).
- (108) T.A. Mary, J.S.O. Evans, T. Vogt and A.W. Sleight, Science 272, 90 (1996).
- (109) S. Roth, One-Dimensional Metals, VCH Publishers, Germany (1995).
- (110) J. Müller, M. Lang, F. Steglich, J.A. Schlueter, A.M. Kini, U. Geiser, J. Mohtashman, R.W. Winter, G.L. Gard, T. Sasaki and N. Toyota, Phys. Rev. B 61, 11739 (2000).
- (111) J.-P. Pouget and S. Ravy, J. Phys. I (France) 6, L393 (1984).
- (112) H. Elsinger, J. Wosnitza, S. Wanka, J. Hagel, D. Schweitzer and W. Strunz, Phys. Rev. Lett. 84, 6098 (2000).
- (113) Y. Nakazawa, H. Taniguchi, A. Kawamoto and K. Kanoda, Phys. Rev. B 61, R16295 (2000).
- (114) M. Lang, M. de Souza, A. Brühl, Ch. Strack, B. Wolf and D. Schweitzer, Physica B 403, 1384 (2008).
- (115) H. Taniguchi, A. Kawamoto and K. Kanoda, Phys. Rev. B 59, 8424 (1999).
- (116) S. Blundell, Magnetism in Condensed Matter. Oxford University Press (2001); Q. A. Pankhurst, C. E. Johnson, D. H. Jones and M. E. Thomas, Hyperfine Interactions 41, 505 (1988).
- (117) A.P. Ramirez, A. Hayshi, R.J. Cava, R. Siddharthan and B.S. Shastry, Nature 399, 333 (1999).
- (118) H. Taniguchi et al., Phys. Rev. B 67, 014510 (2003).
- (119) S.-C. Zhang, Science 275, 1089 (1997).
- (120) A. Georges et al., Rev. of Mod. Phys. 68, 13 (1996).
- (121) D. F. Smith et al., Phys. Rev. B 68 , 024512 (2000).
- (122) L. Pauling, J. of the Am. Chem. Soc. 57, 2680 (1935).
- (123) Q.A. Pankhurst, C.E. Johnson, D.H. Jones and M.F. Thomas, Hyperfine Interact. 41, 505 (1988).
- (124) X. Su, F. Zuo, J.A. Schlueter, A.M. Kini and J.M. Williams, Phys. Rev. B 58, R2944 (1998).
- (125) E. Griesshaber, M. Schiller, D. Schweitzer, I. Heinen and W. Strunz, Phyisica C 317, 421 (1999).
- (126) K. Huang, Statistical Mechanics Wiley, New York (1987).
- (127) N. Goldenfeld, Lectures on Phase Transitions and the Renormalization Group, Addison-Wesley, Reading (1992).
- (128) J. L. Cardy, Scaling and Renormalization in Statistical Physics, Cambridge University Press, Cambridge (1996).
- (129) M. Kardar, Statistical Physics of Fields, Cambridge University Press, Cambridge (2007).
- (130) P. Kopietz, L. Bartosch, and F. Schütz, Introduction to the Functional Renormalization Group, Springer Verlag, Berlin (2010).
- (131) A. P. Levanyuk, Zh. Eksperim. i Teor. Fiz. 36, 810 (1959) [English transl.: Soviet Phys.–JETP 9, 571 (1959)].
- (132) V. L. Ginzburg, Fiz. Tverd. Tela. 2, 2031 (1960) [English transl.: Soviet Phys.–Solid State 2, 1824 (1960)].
- (133) P. Limelette, A. Georges, D. Jerome, P. Wzietek, P. Metcalf and J.M. Honig, Science 302, 89 (2003).
- (134) V.P. LaBella, D.W. Bullock, M. Anser, Z. Ding, C. Emery, L. Bellaiche and P.M. Thibado, Phys. Rev. Lett. 84, 4152 (2000).
- (135) J. A. Lipa, D. R. Swanson, J. A. Nissen, T. C. P. Chui, and U. E. Israelsson, Phys. Rev. Lett. 76, 944 (1996).
- (136) A. Pelissetto and E. Vicari, Phys. Rep. 368, 549 (2002).
- (137) M. Campostrini, M. Hasenbusch, A. Pelissetto, and E. Vicari, Phys. Rev. B 74, 144506 (2006).
- (138) M. Campostrini, M. Hasenbusch, A. Pelissetto, P. Rossi, and E. Vicari, Phys. Rev. B 65, 144520 (2002).
- (139) L. Onsager, Phys. Rev. 65, 117 (1944).
- (140) L.P. Kadanoff, W. Götze, D. Hamblen, R. Hecht, E.A.S. Lewis, V.V. Palciauskas, M. Rayl and J. Swift, Rev. Mod. Phys. 39, 395-431 (1967).
- (141) M. Imada, Phys. Rev. B 72, 075113 (2005).
- (142) M. Imada, T. Misawa, and Y. Yamaji, J. Phys.: Cond. Mat. 22, 164206 (2010).
- (143) C. Castellani, C. Di Castro, D. Feinberg, and J. Ranninger, Phys. Rev. Lett. 43, 1957 (1979).
- (144) P. Fonseca and A. Zamolodchikov, J. Stat. Phys. 110, 527 (2003).
- (145) L. Zhu, M. Garst, A. Rosch, and Q. Si, Phys. Rev. Lett. 91, 066404 (2003).
- (146) G. Kotliar, E. Lange, and M.J. Rozenberg, Phys. Rev. Lett. 84, 5180 (2000).
- (147) A. Fujita, T. Suzuki, N. Kataoka and K. Fukamichi, Phys. Rev. B 50, 6199 (1994).
- (148) Z. Schlesinger, J.A. Rosen, J.N. Hancock and A.P. Ramirez, Phys. Rev. Lett. 101, 015501 (2008).
- (149) P. Sémon and A.-M. S. Tremblay, Phys. Rev. B 85, 201101 (2012).
- (150) J. Kokalj and R.H. McKenzie, arXiv:1411.1085.