Dynamic epistasis for different alleles of the same gene
Abstract
Epistasis refers to the phenomenon in which phenotypic consequences caused by mutation of one gene depend on one or more mutations at another gene. Epistasis is critical for understanding many genetic and evolutionary processes, including pathway organization, evolution of sexual reproduction, mutational load, ploidy, genomic complexity, speciation, and the origin of life. Nevertheless, current understandings for the genome-wide distribution of epistasis are mostly inferred from interactions among one mutant type per gene, whereas how epistatic interaction partners change dynamically for different mutant alleles of the same gene is largely unknown. Here we address this issue by combining predictions from flux balance analysis and data from a recently published high-throughput experiment. Our results show that different alleles can epistatically interact with very different gene sets. Furthermore, between two random mutant alleles of the same gene, the chance for the allele with more severe mutational consequence to develop a higher percentage of negative epistasis than the other allele is 50-70% in eukaryotic organisms, but only 20-30% in bacteria and archaea. We developed a population genetics model that predicts that the observed distribution for the sign of epistasis can speed up the process of purging deleterious mutations in eukaryotic organisms. Our results indicate that epistasis among genes can be dynamically rewired at the genome level, and call on future efforts to revisit theories that can integrate epistatic dynamics among genes in biological systems222This chapter is published as Xu et al. [1]. Brandon Barker and Lin Xu contributed equally to this work. It is additionally available in Xu [2, chapter 4]..
1 Introduction
Epistasis between two deleterious mutations is positive when a double mutant causes a weaker mutational defect than predicted from individual deleterious mutations, and is negative when the double mutant causes a larger defect [3, 4]. In a population with sexual reproduction, positive epistasis alleviates the total harm when multiple deleterious mutations combine together and thus reduces the effectiveness of natural selection in removing these deleterious mutations, whereas negative epistasis can lower average mutational load by efficiently purging deleterious mutants [5]. As a consequence, selective elimination of deleterious mutations would be especially effective if negative epistasis is prevalent. It is important to understand the distribution of epistasis among mutations, which plays a central role in genetics and theoretical descriptions for many evolutionary processes [3, 4].
Tremendous efforts have been put into genome-wide measurements for the sign and magnitude of epistasis among different genes in various species [6, 7, 8, 9, 10, 11, 12, 13, 14, 15, 16, 17]. A series of high-throughput experimental platforms have been developed, such as synthetic genetic array (SGA; Costanzo et al. 6, Tong et al. 7), diploid-based synthetic lethality analysis with microarrays [8, 9], synthetic dosage-suppression and lethality screen [10, 11, 12], and epistatic miniarray profiles [13, 14, 15]. The epistatic relations in these experiments were mostly measured based on one mutant type (deletion mutant) per gene. Few studies constructed multiple mutant alleles for single genes to examine the dynamics of epistatic relations among genes under different genetic perturbations. As a consequence, the global landscape of epistasis for different alleles of the same gene remains largely uninvestigated.
We address this issue by exploring epistatic differences among alleles in the same gene for a large part of the genome by combining experimental data with mathematical modeling using flux balance analysis (FBA). FBA involves the optimization of cellular objective functions and allows prediction of in silico flux values and/or growth [18, 19, 20]. FBA has been used to investigate the fitness consequence of single-deletion mutants [21, 22] and epistatic relations between metabolic reactions, genes, and functional modules [23, 24, 25, 26]. The FBA predictions show good agreement with genome-wide experimental studies [27, 28, 29, 30, 31, 32, 33, 34]. One essential advantage of FBA modeling is that it can simulate epistasis between genes based on different genetic mutants. Using this platform, together with data from a recently published experiment [6], we were able to show that epistasis can be rewired among genes, and that the sign of epistasis can change dramatically at the global scale, depending on the mutant alleles involved in the processes. Our study provides a genome-wide picture on the dynamic epistatic landscape of various mutant alleles for the same gene.
2 Results
2.1 Epistatic Relations Between Genes Are Largely Allele-Specific.
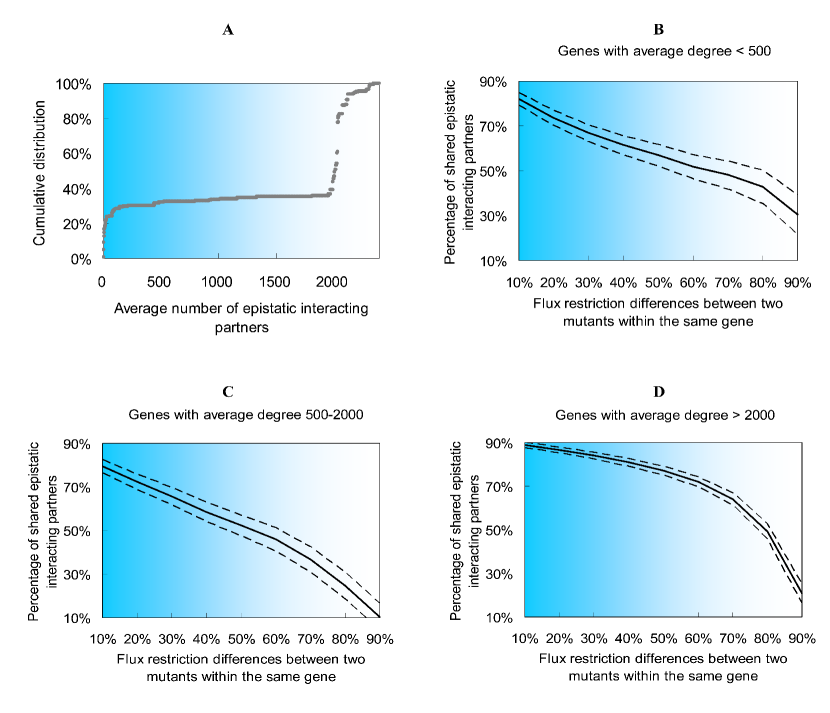
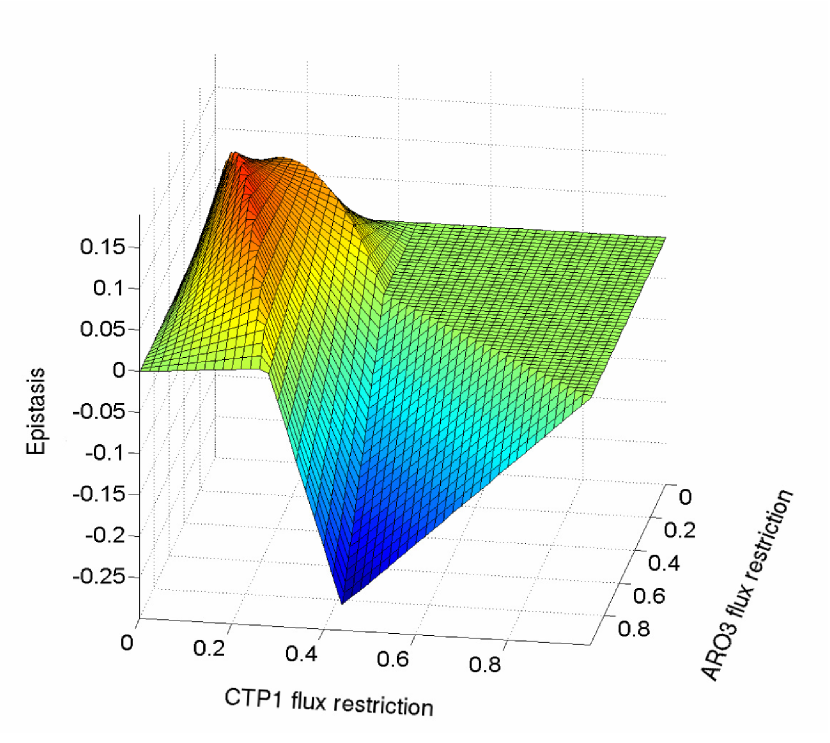
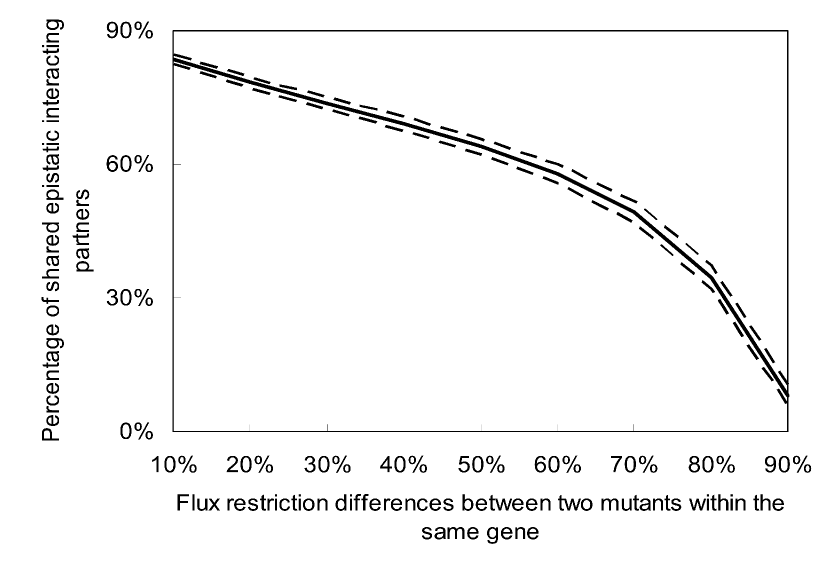
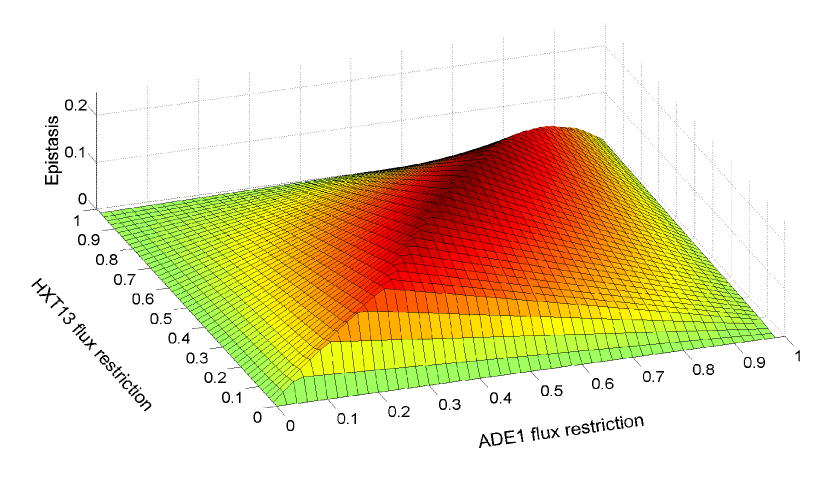
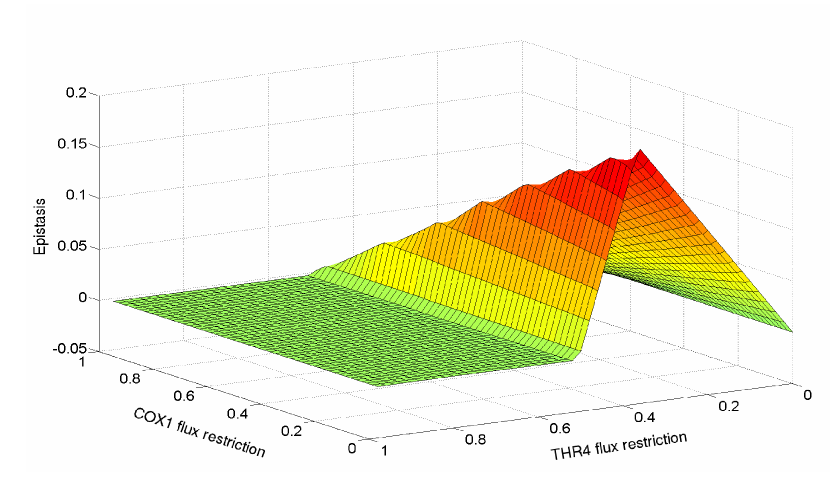
We first used the yeast Saccharomyces cerevisiae metabolic reconstruction iMM904 [18] to examine the distribution of epistasis under various genetic mutant alleles. The reconstruction is a genome-scale metabolic model, having 904 metabolic genes associated with 1,412 reactions. For each gene, we simulated genetic perturbations that retain the corresponding flux from 90% to 0% in decrements of 10% of its WT (optimal) flux. As a result, 10 different single mutants per nonessential gene and nine different single mutants per essential gene (the 0% flux mutants in these genes represent lethal deletion for which epistasis cannot be calculated) were simulated. We computed the fitness of the single mutants and double mutants with any possible pairwise allele combination of different genes. These data were used to infer the epistatic relationships among genes. In total, over 40 million simulations were conducted. To investigate the dynamics of epistasis among genes, we calculated the percentage of shared epistatic interaction partners between any two mutants within the same gene. Two mutant alleles are defined to share an epistatic interaction partner (a mutant from another gene) if they both epistatically interact with this mutant and the signs of epistasis are the same. The percentage of shared epistatic interaction partners between two mutants is calculated as the number of their shared epistatic interaction partners divided by the sum of their total epistatic interaction partners. As shown in Figure 1A, our results indicate that the percentage of shared epistatic interaction partners between two mutants of the same gene decreases as the flux difference between them increases. Two mutants of the same genes could have as low as only about 20% overlap between their epistatic interaction partners, indicating that the epistatic profile of a gene is largely dependent on the mutant types used. Our results also show that the average number of epistatic interaction partners per gene do not affect this conclusion (Figure 5). Interestingly, there are cases where the sign of epistasis between two genes can even change under varying mutant types (an example is in Figure 6, and all pairs with reversed sign of epistasis are listed in Dataset S1). However, such events are rare (about 1.2% of all gene pairs that show epistatic interactions). Furthermore, we repeated the above FBA analysis for another species, Escherichia coli, and the results confirmed the above trend (Figure 7).
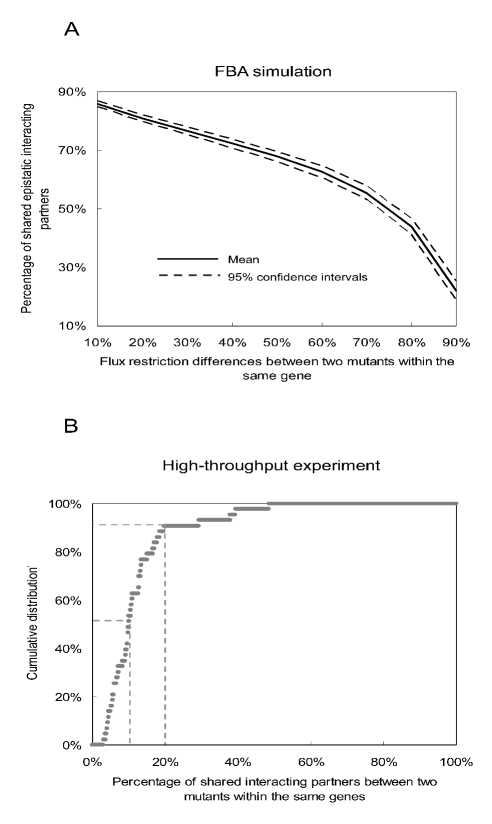
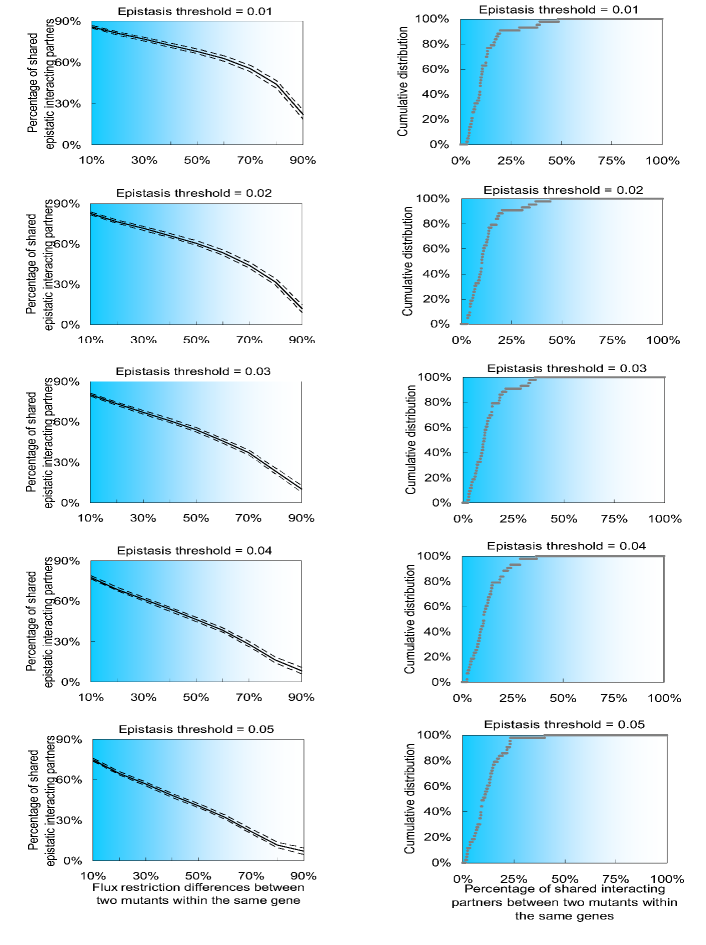
In a recently released high-throughput experiment that measured genome-wide epistatic relations among genes in S. cerevisiae [6], there were 43 mutant pairs having two different mutant alleles of the same gene (Dataset S2), each of which were experimentally crossed with 3,885 array gene deletion mutants to explore their epistatic relations in the genome. In total, over 200,000 double mutants were experimentally constructed. This dataset provides the most comprehensive experimental source for investigating the epistatic landscape of different mutant alleles in the same gene. Figure 1B shows the empirical cumulative distribution for the percentage of shared interaction partners between mutant pairs within the same gene. Our results indicate that more than 50% of mutant pairs within the same gene have less than 10% overlap of their epistatic interaction partners, and about 90% mutant pairs have less than 20% overlap (Figure 1B). As shown in Dataset S2, the functions of genes used in the experiments are very diverse, and not restricted to metabolic functions as genes in the FBA model. Nevertheless, the result from experimental studies confirms our FBA modeling prediction that different mutant alleles of the same gene can have very distinct epistatic interaction partners in the genome. In addition, the conclusions are robust under various epistasis thresholds (Figure 8).
2.2 Sign of Epistasis for Individual Genes Depends on Mutation Severity.
The relative prevalence of positive vs. negative epistasis is of tremendous importance for understanding many evolutionary processes [3, 4, 5]. In the following we addressed this issue for different alleles of the same gene. Based on the above high-throughput experimental dataset, we calculated the percentage of negative epistasis for each mutant, defined as the number of negative epistatic partners for this mutant divided by the overall number of its epistatic partners. We then compared the percentage of negative epistasis between different mutant alleles of the same gene in the experiment. Among 43 mutant pairs in the study, 35 mutant pairs have significantly different fitnesses between two mutants of the same gene. As shown in Figure 2.2A left, 21 mutant pairs (60%) show that alleles with more severe defects have a higher chance than the other allele in the same gene to develop negative epistasis in the genome.
![[Uncaptioned image]](/html/1411.6330/assets/x2.png)
To see if this result could be caused by a systematic trend in the high-throughput experiments, we randomly selected 35 pairs of mutants from distinct genes that have the same fitness level for single-deletion mutant and fitness difference between two mutants as the above 35 pairs of mutants within the same genes, and compared their relative prevalence of negative epistasis. The permutation was repeated 100,000 times, and the result is depicted in Figure 2.2B. Among all repeats of randomly selected 35 mutant pairs, only a small percentage (4.1%) have 21 or more mutant pairs where the mutant with more severe defects has a higher chance than the other mutant to develop negative epistasis in the genome, indicating that our observation for different mutant alleles of the same gene is not likely caused by the overall pattern in the high-throughput experiments.
Using results from the above FBA simulation, we also confirmed the same pattern that between mutant alleles of the same gene, the mutant allele with more severe defect is more likely than the other allele to develop negative epistasis in the genome (Figure 2.2A, right). Indeed, an even higher percentage of mutant allele pairs in the FBA simulation (about 70%) than in real experiments (60%) support this conclusion. To avoid possible bias from the definition of epistasis and fitness differences between mutant alleles in the FBA simulation, we repeated the calculations based on multiple criteria and our conclusion remains the same (Figure 2.2C).
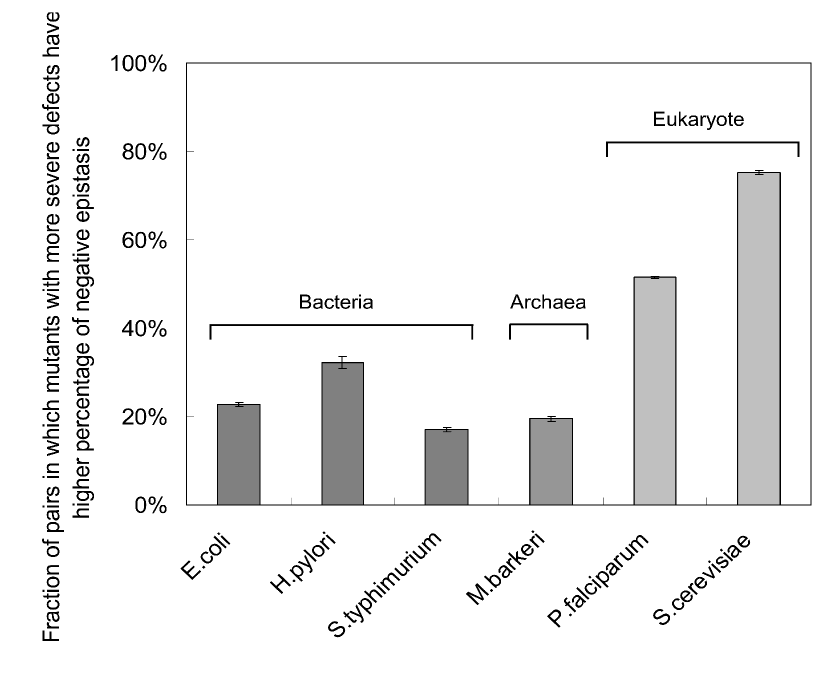
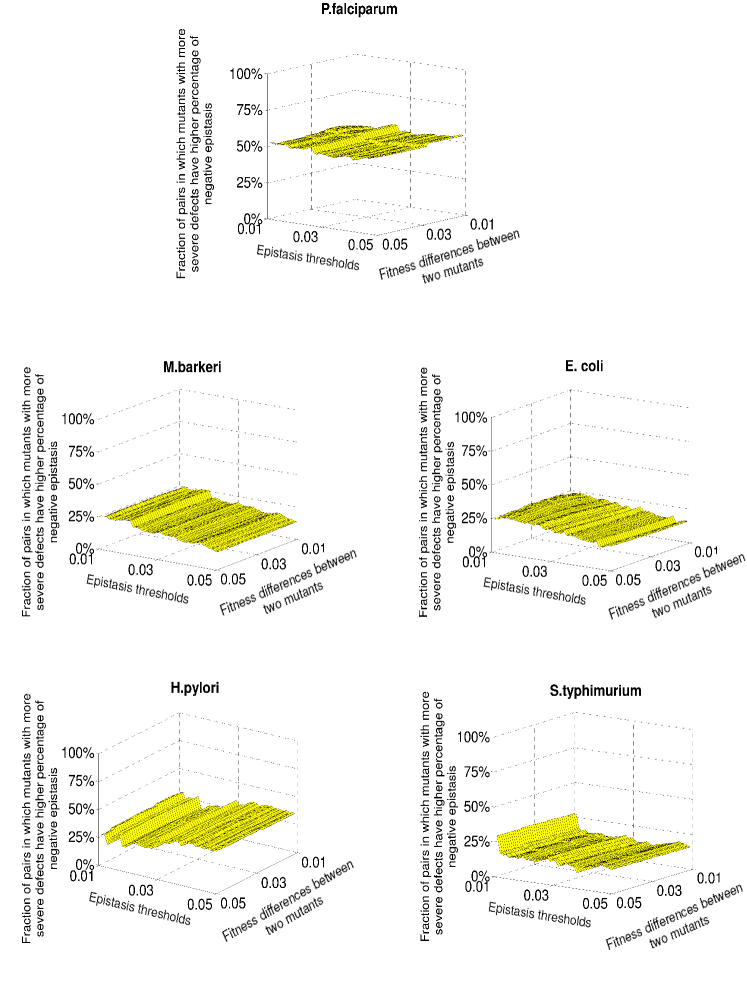
Our observation is surprising given that previous results based on virus models or gene network simulations proposed a totally opposite pattern at the genome level, i.e., mutations with larger mutational defects are more likely to develop positive epistasis [35, 36, 37, 38, 39]. We further used the FBA simulations to explore the dynamics of epistasis for various mutant alleles of the same gene in different species. High-quality genome-wide metabolic networks in three bacteria (Escherichia coli [40], Salmonella typhimurium [41], and Helicobacter pylori [42]), one archaea (Methanosarcina barkeri [43]), and another single-cell eukaryote (Plasmodium falciparum [44]) were used in our simulation. As shown in Figure 3, when two mutant alleles of the same gene are compared, in 22%, 17%, 32%, and 19% of cases for E. coli, S. typhimurium, H. pylori, and M. barkeri, respectively, mutant alleles with more severe defects display higher percentages of negative epistasis than the other allele, indicating that more deleterious mutant alleles in the same gene indeed tend to develop positive epistasis in these species. However, these numbers are significantly smaller than that of yeast and another eukaryotic organism, P. falciparum (52%). The conclusion is robust under various epistasis thresholds (Figure 9).
2.3 Self-Purging Mechanism for Deleterious Mutations at the Population Level
Our above results indicate that between two random mutant alleles of the same gene, the chance for the allele with more severe mutational consequence to develop a higher percentage of negative epistasis than the other allele is 50-70% in eukaryotic organisms, but only 20-30% in bacteria and archaea. In other words, mutant alleles with more severe defects in the same gene might have a higher chance to develop negative epistasis in eukaryotic organisms than in bacteria and archaea. We constructed a simple population genetic model as in Figure 2.3A to address the evolutionary significance of this observation. The genetic system has two genes: a query gene A, which contains three different alleles (AS: mutants with severe defects; AD: mutants with weak defects; AWT: WT), and a gene X, which has two different alleles (mutant, XM, and WT, XWT). We simulated the ratio of allele frequency between the severe and the weak mutant alleles in gene A under different probabilities of having negative epistasis between these two alleles and the mutant allele in the gene X.
![[Uncaptioned image]](/html/1411.6330/assets/x4.png)
Our results in Figure 2.3B depict the simulation results. The six panels in the figure represent the ratio of AS to AD alleles in the 50th, 100th, 150th, 200th, 250th, and 300th generations, respectively. Our simulations indicate that if the percentage of negative epistasis for the severe mutant is kept as a constant, as the percentage of negative epistasis for the weak mutation increases (as shown by the arrow A), the ratio of the severe to the weak allele frequency would increase. However, this ratio would decrease, indicating a faster removal of the severe mutants from the population, in another direction (as shown by the arrow B), i.e., the percentage of negative epistasis for the weak mutant is kept as a constant, but the percentage of negative epistasis for the severe mutant increases. Therefore, the distribution for the sign of epistasis among different alleles of the same gene observed in this study might represent an efficient way for eukaryotic organisms to purge deleterious mutations from populations.
3 Discussion
Our study represents a genome-wide theoretical survey for the dynamics of global epistatic effects under various mutant alleles of the same gene. We show that the epistatic profiling of a gene at the genome level is largely dependent on mutant types involved. Our results indicate that previous conclusions inferring epistatic relations among genes based on only one mutant type per gene can be greatly improved by using multiple mutant alleles. More importantly, our study shows that mutant alleles with severe defects have a higher chance to develop negative epistasis in eukaryotic organisms than in bacteria and archaea. It has been speculated that eukaryotic organisms might have more negative epistasis due to their increased complexity over prokaryotic organisms [45, 46]. Even if this hypothesis is true, however, our results for different mutant alleles of the same gene cannot be directly inferred from this complexity argument.
Even though the mechanism underlying our observation remains to be determined, we argue that such distributions for negative epistasis among different alleles of the same genes have significant evolutionary consequences, as shown in our population genetics simulations (Figure 2.3). The origin and maintenance of sexual reproduction remains one of the central issues in evolutionary biology. Population genetics models have been proposed to explore the impact of epistasis on the maintenance of sexual reproduction [47, 48, 49, 50]. The mutational deterministic hypothesis posits that sex enhances the ability of natural selection to purge deleterious mutations by bringing them together into single genome through recombination [47]. This explanation requires the prevalence of negative epistasis at the genome level. Here we found that the mutations with larger deleterious defects within the same gene have a higher chance to develop negative epistasis in eukaryotic organisms than bacteria and archaea. The model we proposed in Figure 2.3, which is based on the population genetics theory from Kondrashov [47], indicates that such distribution of negative epistasis among different alleles of the same gene in eukaryotic organisms might lead to more efficient purging of deleterious mutations from populations, thus providing a previously unappreciated evolutionary advantage for sexual reproduction. We emphasize that these findings do not necessarily provide sufficient evidence to explain the cause for the emergence of sexual reproduction during evolution.
Although we found several unique characteristics regarding the global epistatic landscape of different mutant alleles in the same gene, three caveats need to be addressed. First, the FBA modeling used in this study, which has been successfully applied to various research problems [21, 22, 23, 24, 25, 26], includes only metabolic genes in the simulation. However, results from our analysis on the experimentally defined epistatic relations among roughly 0.2 million double mutants comprising about 4,000 S. cerevisiae genes, which nearly represent all functional categories in the budding yeast, confirmed our major FBA modeling predictions.
Second, even though FBA is one of the most comprehensive computational tools for simulating epistatic interactions among genes, there are still many aspects that can be improved to aid in capturing the full set of empirical genetic interactions [51]. For example, rules for transcriptional regulation and physical interactions can be integrated into the current FBA framework to improve its accuracy [52]. In addition, mapping between individual alleles and metabolic flux reduction is a complex process and difficult to measure experimentally [53]. It is noteworthy that in our simulations we have uniformly evaluated fitness consequence based on the percentage of WT flux attainable in a specific background. Depending on the regulation dynamics of individual genes, such uniform sampling may be unlikely to correspond to random sampling of mutant alleles. For instance, a mutation that limits the availability of a ligand that activates an enzyme following a Hill equation with early saturation may have a very high frequency of neutral or mildly deleterious mutations compared with a similar enzyme with late saturation. Nevertheless, uniform sampling in our study is still useful in illustrating the main evolutionary ideas presented here, which all have to do with relative severity of mutations rather than their absolute fitness.
Third, measuring the presence of epistasis is subject to a choice of threshold. Does the flux smoothly influence epistasis, or can epistasis abruptly change or become zero? We have seen evidence of both trends in our simulations. Though there are many different trends in the magnitude of epistasis that we are currently investigating, we present two cases to explore this issue (Figures 10 and 11 and Datasets S3 and S4). However, based on Figure 8 and 9, we have confirmed that our major results are robust to a variety of epistasis thresholds. As a result, although the choice of thresholds is a common problem for research on epistasis, we are still confident that our conclusion is unlikely to be significantly influenced by this factor. With these limitations in mind, our observations identified several important features for the epistasis among genes, and call on future experimental and theoretical efforts to revisit genetics and evolutionary theories that can integrate epistatic dynamics among genes in biological systems.
4 Methods
4.1 Experimental Dataset
The experimental data were extracted from a global survey for the epistatic interactions among genes in S. cerevisiae [6]. In this original SGA study, the authors screened 1,712 S. cerevisiae query gene mutants against 3,885 array gene mutants to generate a total of more than 5 million gene mutant pairs spanning all biological processes. In each gene mutant pair, the epistasis value is calculated based on the equation , in which is the fitness of an organism with two mutations in genes X and Y, and or refers to the fitness of the organism with mutation only at gene X or Y, respectively. In addition, a statistical confidence measure (-value) was assigned to each interaction based on the observed variation of each double mutant across four experimental replicates and estimates of the background error distributions for the corresponding query and array mutants. Finally, a defined confidence threshold (, P 0.05) was applied to generate epistatic interactions [6].
4.2 Flux Balance Analysis
FBA frames the stoichiometric equations that describe the biological reactions of a system as the following matrix equations, which is possible because stoichiometric equations are linear [18, 19, 20].
|
(1) |
The vector of concentration change over time () is found by multiplying the stoichiometric matrix by a flux vector . has columns corresponding to each reaction in the system, and rows corresponding to metabolites. Typically, one or more enzymes correspond to each reaction, which allows us to see how a genetic perturbation, such as a knockout, may affect the system. The vector consists of reaction fluxes and is subject to upper and lower bounds and . If we want to simulate the knockout or knockdown of an enzyme, the fluxes corresponding to that enzyme can be constrained to be zero or lower than WT, respectively. It is assumed that the change in concentration over time is at steady state, therefore in the FBA simulation [20].
The linear objective is written in terms of the with weight coefficients . Modified versions of COBRA and COBRA2 scripts, popular FBA software packages written for MATLAB, were used to implement our simulation framework [19]. The method for calculating a realistic WT flux for a given environment and organism model is taken from Smallbone and Simeonidis 20. This method, termed geometric FBA, attempts to choose a flux vector that is close to the average of all optimal flux vectors. The geometric FBA solution is also a minimal -norm solution, which has been previously heralded as a good choice because it minimizes the total amount of flux needed to achieve the objective, based on the fact that cells would avoid having much unnecessary flux and wasted energy [20]. A minimal -norm solution is advantageous in this study because restricting fluxes for mutants based on unnecessarily large WT fluxes may not constrain the system. Finally, the minimal -norm solution avoids the problem of having futile cycles, which are thermodynamically infeasible [20].
Mutations of genes are simulated by the use of gene-reaction mapping and flux constraints. Enzymes may be involved in multiple reactions (i.e., pleiotropy). Although we often have Boolean rules describing the relationship between genes in an enzyme complex, it is currently extremely difficult to ascertain the exact contribution of each enzyme to each reaction [53]. Choosing the simplest unbiased approach, we used gene-reaction mapping and uniformly constrained the flux through each reaction associated to the gene being mutated. With one notable exception [26], most research relating to simulation of mutations with FBA has focused on null mutants [21, 22, 23, 24, 25, 27, 28]. Our simulation approach, though simplifying the actual dynamics that result in decreased fluxes in vivo, allows us to see behavior that was not previously possible. To be consistent, we used the same equation and threshold () to calculate epistasis for FBA results as we did for the experimental data.
4.3 Population Genetics Model
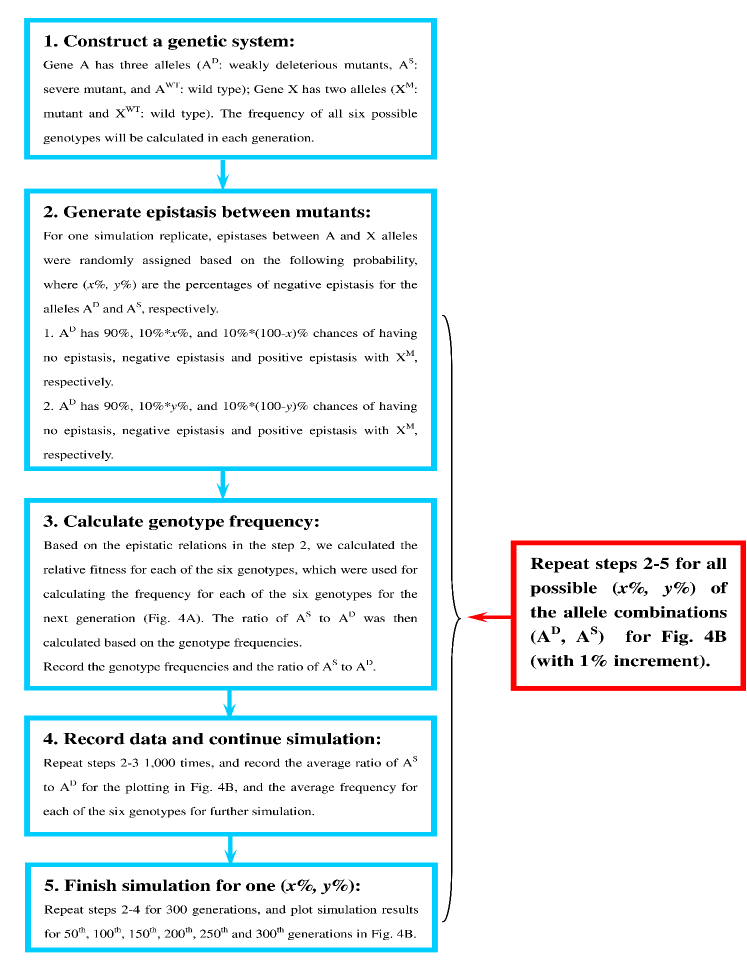
A flowchart in Figure 12 provides more illustration of the simulation procedure. We constructed a genetic system with a query gene A, which contains three different alleles (AS: severe mutant; AD: weakly deleterious mutants; and AWT: WT) and a gene X that has two different alleles (XM: mutant and XWT: WT). The table in Figure 2.3A explains how genotype frequencies could be calculated from generation to generation under natural selection. In the figure, and represent allele frequency and fitness, respectively. The average fitness in generation could be calculated [54]. We simulated the ratio of allele frequency for the severe (AS) to the weak (AD) mutant alleles of the A gene under all possible combinations of the percentages of negative epistasis for these two alleles, as shown on the and axis of Figure 2.3B. For each possible combination in each generation (a specific location on each panel of Figure 2.3B), the following two-step procedure was repeated 1,000 times. First, the epistatic relations (negative, positive, and no epistasis) between the mutant alleles of the genes A and X were randomly determined as the following: either A allele is assumed to have 10% possibility of having epistasis (either positive or negative) with the allele XM [6]; when A and X alleles do have epistasis, the likelihoods for the epistasis being negative (and the remaining epistases are positive) are assigned independently for AS and AD alleles according to their location on Figure 2.3B. Second, the fitness of each genotype was calculated, which was then used to infer the genotype frequencies in the next generation according to Figure 2.3A. The average genotype frequencies among 1,000 randomizations were then recorded for simulations in the next generation. The ratio of allele frequency for the severe to the weak mutant alleles of the A gene in each generation was calculated based on genotype frequencies in that generation.
To make the simulation simple, the initial allele frequencies for the severe, weak, and WT alleles of the A gene were assumed to be equal (one-third), and the initial allele frequencies for the mutant and WT of the X gene were also assumed to be equal (one-half). The fitness was assumed to be 1, 0.99, and 0.98 for the WT, weak, and severe mutant alleles of gene A, respectively, and 1 and 0.99 for the WT and the mutant alleles of gene X, respectively. The positive and negative epistasis values between A and X gene mutants were assumed to be 0.01 and −0.01, respectively. A variety of fitness differences between the severe and weak alleles and epistasis values have also been used in the simulations, and the trend remains the same.
5 Acknowledgments
We thank Dr. Ricardo Azevedo for his insights and critical comments on the paper; Dr. Huifeng Jiang and Mr. Kaixiong Ye for discussion; and the editor and two anonymous reviewers for constructive comments. This work was supported by a startup fund from Cornell University, National Science Foundation Grant DEB-0949556, and National Institutes of Health Grant 1R01AI085286 (to Z.G.).
6 Supporting Figures
7 Supporting Data
Supporting datasets S1-S4 are available online (DOI: 10.1073/pnas.1121507109).
References
- Xu et al. [2012] Lin Xu, Brandon Barker, and Zhenglong Gu. Dynamic epistasis for different alleles of the same gene. Proceedings of the National Academy of Sciences of the United States of America, 109(26):10420–10425, June 2012. ISSN 1091-6490. doi: 10.1073/pnas.1121507109. URL http://www.ncbi.nlm.nih.gov/pubmed/22689976.
- Xu [2012] Lin Xu. Dynamics of epistasis from duplicate genes to genome-wide networks. PhD thesis, Cornell University, Ann Arbor, 2012. URL http://search.proquest.com/docview/1013994495?accountid=10267.
- Phillips [2008] Patrick C Phillips. Epistasis–the essential role of gene interactions in the structure and evolution of genetic systems. Nat Rev Genet, 9(11):855–867, November 2008. ISSN 1471-0064. doi: 10.1038/nrg2452. URL http://dx.doi.org/10.1038/nrg2452http://www.ncbi.nlm.nih.gov/pubmed/18852697.
- Boone et al. [2007] Charles Boone, Howard Bussey, and Brenda J Andrews. Exploring genetic interactions and networks with yeast. Nature reviews. Genetics, 8(6):437–49, June 2007. ISSN 1471-0056. doi: 10.1038/nrg2085. URL http://www.ncbi.nlm.nih.gov/pubmed/17510664.
- Kimura and Maruyama [1966] Motoo Kimura and Takeo Maruyama. The mutational load with epistatic gene interactions in fitness. Genetics, 54(6):1337–1351, June 1966. ISSN 00754617. doi: 10.1002/jlac.19666940111. URL http://doi.wiley.com/10.1002/jlac.19666940111.
- Costanzo et al. [2010] Michael Costanzo, Anastasia Baryshnikova, Jeremy Bellay, Yungil Kim, Eric D Spear, Carolyn S Sevier, Huiming Ding, Judice L Y Koh, Kiana Toufighi, Sara Mostafavi, Jeany Prinz, Robert P St Onge, Benjamin VanderSluis, Taras Makhnevych, Franco J Vizeacoumar, Solmaz Alizadeh, Sondra Bahr, Renee L Brost, Yiqun Chen, Murat Cokol, Raamesh Deshpande, Zhijian Li, Zhen-Yuan Lin, Wendy Liang, Michaela Marback, Jadine Paw, Bryan-Joseph San Luis, Ermira Shuteriqi, Amy Hin Yan Tong, Nydia van Dyk, Iain M Wallace, Joseph A Whitney, Matthew T Weirauch, Guoqing Zhong, Hongwei Zhu, Walid A Houry, Michael Brudno, Sasan Ragibizadeh, Balázs Papp, Csaba Pál, Frederick P Roth, Guri Giaever, Corey Nislow, Olga G Troyanskaya, Howard Bussey, Gary D Bader, Anne-Claude Gingras, Quaid D Morris, Philip M Kim, Chris A Kaiser, Chad L Myers, Brenda J Andrews, and Charles Boone. The genetic landscape of a cell. Science (New York, N.Y.), 327(5964):425–31, 2010. ISSN 1095-9203. doi: 10.1126/science.1180823. URL http://www.ncbi.nlm.nih.gov/pubmed/20093466.
- Tong et al. [2004] Amy Hin Yan Tong, Guillaume Lesage, Gary D Bader, Huiming Ding, Hong Xu, Xiaofeng Xin, James Young, Gabriel F Berriz, Renee L Brost, Michael Chang, YiQun Chen, Xin Cheng, Gordon Chua, Helena Friesen, Debra S Goldberg, Jennifer Haynes, Christine Humphries, Grace He, Shamiza Hussein, Lizhu Ke, Nevan Krogan, Zhijian Li, Joshua N Levinson, Hong Lu, Patrice Ménard, Christella Munyana, Ainslie B Parsons, Owen Ryan, Raffi Tonikian, Tania Roberts, Anne-Marie Sdicu, Jesse Shapiro, Bilal Sheikh, Bernhard Suter, Sharyl L Wong, Lan V Zhang, Hongwei Zhu, Christopher G Burd, Sean Munro, Chris Sander, Jasper Rine, Jack Greenblatt, Matthias Peter, Anthony Bretscher, Graham Bell, Frederick P Roth, Grant W Brown, Brenda Andrews, Howard Bussey, and Charles Boone. Global Mapping of the Yeast Genetic Interaction Network. Science, 303(5659):808–813, February 2004. doi: 10.1126/science.1091317. URL http://www.sciencemag.org/content/303/5659/808.abstract.
- Pan et al. [2004] Xuewen Pan, Daniel S. Yuan, Dong Xiang, Xiaoling Wang, Sharon Sookhai-Mahadeo, Joel S. Bader, Philip Hieter, Forrest Spencer, and Jef D. Boeke. A robust toolkit for functional profiling of the yeast genome. Molecular Cell, 16:487–496, 2004. ISSN 10972765. doi: 10.1016/j.molcel.2004.09.035.
- Pan et al. [2006] Xuewen Pan, Ping Ye, Daniel S. Yuan, Xiaoling Wang, Joel S. Bader, and Jef D. Boeke. A DNA integrity network in the yeast Saccharomyces cerevisiae. Cell, 124:1069–1081, 2006. ISSN 00928674. doi: 10.1016/j.cell.2005.12.036.
- Measday and Hieter [2002] V Measday and P Hieter. Synthetic dosage lethality. In GUIDE TO YEAST GENETICS AND MOLECULAR AND CELL BIOLOGY, PT B, volume 350 of METHODS IN ENZYMOLOGY, pages 316–326. ACADEMIC PRESS INC, 525 B STREET, SUITE 1900, SAN DIEGO, CA 92101-4495 USA, 2002.
- Measday et al. [2005] Vivien Measday, Kristin Baetz, Julie Guzzo, Karen Yuen, Teresa Kwok, Bilal Sheikh, Huiming Ding, Ryo Ueta, Trinh Hoac, Benjamin Cheng, Isabelle Pot, Amy Tong, Yuko Yamaguchi-Iwai, Charles Boone, Phil Hieter, and Brenda Andrews. Systematic yeast synthetic lethal and synthetic dosage lethal screens identify genes required for chromosome segregation. Proceedings of the National Academy of Sciences of the United States of America, 102:13956–13961, 2005. ISSN 0027-8424. doi: 10.1073/pnas.0503504102.
- Sopko et al. [2006] Richelle Sopko, Dongqing Huang, Nicolle Preston, Gordon Chua, Balázs Papp, Kimberly Kafadar, Mike Snyder, Stephen G. Oliver, Martha Cyert, Timothy R. Hughes, Charles Boone, and Brenda Andrews. Mapping pathways and phenotypes by systematic gene overexpression. Molecular Cell, 21:319–330, 2006. ISSN 10972765. doi: 10.1016/j.molcel.2005.12.011.
- Collins et al. [2007] Sean R Collins, Kyle M Miller, Nancy L Maas, Assen Roguev, Jeffrey Fillingham, Clement S Chu, Maya Schuldiner, Marinella Gebbia, Judith Recht, Michael Shales, Huiming Ding, Hong Xu, Junhong Han, Kristin Ingvarsdottir, Benjamin Cheng, Brenda Andrews, Charles Boone, Shelley L Berger, Phil Hieter, Zhiguo Zhang, Grant W Brown, C James Ingles, Andrew Emili, C David Allis, David P Toczyski, Jonathan S Weissman, Jack F Greenblatt, and Nevan J Krogan. Functional dissection of protein complexes involved in yeast chromosome biology using a genetic interaction map. Nature, 446:806–810, 2007. ISSN 0028-0836. doi: 10.1038/nature05649.
- Kornmann et al. [2009] Benoît Kornmann, Erin Currie, Sean R Collins, Maya Schuldiner, Jodi Nunnari, Jonathan S Weissman, and Peter Walter. An ER-mitochondria tethering complex revealed by a synthetic biology screen. Science (New York, N.Y.), 325:477–481, 2009. ISSN 0036-8075. doi: 10.1126/science.1175088.
- Fiedler et al. [2009] Dorothea Fiedler, Hannes Braberg, Monika Mehta, Gal Chechik, Gerard Cagney, Paromita Mukherjee, Andrea C Silva, Michael Shales, Sean R Collins, Sake van Wageningen, Patrick Kemmeren, Frank C P Holstege, Jonathan S Weissman, Michael-Christopher Keogh, Daphne Koller, Kevan M Shokat, and Nevan J Krogan. Functional organization of the S. cerevisiae phosphorylation network. Cell, 136(5):952–63, 2009. ISSN 1097-4172. doi: 10.1016/j.cell.2008.12.039. URL http://www.ncbi.nlm.nih.gov/pubmed/19269370.
- Bonhoeffer et al. [2004] Sebastian Bonhoeffer, Colombe Chappey, Neil T Parkin, Jeanette M Whitcomb, and Christos J Petropoulos. Evidence for positive epistasis in HIV-1. Science (New York, N.Y.), 306:1547–1550, 2004. ISSN 0036-8075. doi: 10.1126/science.1101786.
- Roguev et al. [2008] Assen Roguev, Sourav Bandyopadhyay, Martin Zofall, Ke Zhang, Tamas Fischer, Sean R Collins, Hongjing Qu, Michael Shales, Han-Oh Park, Jacqueline Hayles, Kwang-Lae Hoe, Dong-Uk Kim, Trey Ideker, Shiv I Grewal, Jonathan S Weissman, and Nevan J Krogan. Conservation and rewiring of functional modules revealed by an epistasis map in fission yeast. Science (New York, N.Y.), 322:405–410, 2008. ISSN 0036-8075. doi: 10.1126/science.1162609.
- Mo et al. [2009] Monica L Mo, Bernhard ØPalsson, and Markus J Herrgå rd. Connecting extracellular metabolomic measurements to intracellular flux states in yeast. BMC Systems Biology, 3(1):37, 2009. ISSN 1752-0509. doi: 10.1186/1752-0509-3-37. URL http://www.biomedcentral.com/1752-0509/3/37.
- Becker et al. [2007] Scott A Becker, Adam M Feist, Monica L Mo, Gregory Hannum, Bernhard ØPalsson, and Markus J Herrgå rd. Quantitative prediction of cellular metabolism with constraint-based models: the COBRA Toolbox. Nature protocols, 2(3):727–38, 2007. ISSN 1750-2799. doi: 10.1038/nprot.2007.99. URL http://www.ncbi.nlm.nih.gov/pubmed/17406635.
- Smallbone and Simeonidis [2009] Kieran Smallbone and Evangelos Simeonidis. Flux balance analysis: a geometric perspective. Journal of theoretical biology, 258(2):311–5, 2009. ISSN 1095-8541. doi: 10.1016/j.jtbi.2009.01.027. URL http://www.ncbi.nlm.nih.gov/pubmed/19490860.
- Papp et al. [2004] Balázs Papp, Csaba Pál, and Laurence D Hurst. Metabolic network analysis of the causes and evolution of enzyme dispensability in yeast. Nature, 429(6992):661–4, June 2004. ISSN 1476-4687. doi: 10.1038/nature02636. URL http://www.ncbi.nlm.nih.gov/pubmed/15190353.
- Ibarra et al. [2002] Rafael U Ibarra, Jeremy S Edwards, and Bernhard ØPalsson. Escherichia coli K-12 undergoes adaptive evolution to achieve in silico predicted optimal growth. Nature, 420(6912):186–189, November 2002. ISSN 0028-0836. URL http://dx.doi.org/10.1038/nature01149.
- Harrison et al. [2007] Richard Harrison, Balázs Papp, Csaba Pál, Stephen G Oliver, and Daniela Delneri. Plasticity of genetic interactions in metabolic networks of yeast. Proceedings of the National Academy of Sciences of the United States of America, 104(7):2307–12, February 2007. ISSN 0027-8424. doi: 10.1073/pnas.0607153104. URL http://www.pubmedcentral.nih.gov/articlerender.fcgi?artid=1892960\&tool=pmcentrez\&rendertype=abstract.
- Deutscher et al. [2006] David Deutscher, Isaac Meilijson, Martin Kupiec, and Eytan Ruppin. Multiple knockout analysis of genetic robustness in the yeast metabolic network. Nature genetics, 38(9):993–8, September 2006. ISSN 1061-4036. doi: 10.1038/ng1856. URL http://www.ncbi.nlm.nih.gov/pubmed/16941010.
- Segrè et al. [2005] Daniel Segrè, Alexander Deluna, George M Church, and Roy Kishony. Modular epistasis in yeast metabolism. Nature genetics, 37(1):77–83, January 2005. ISSN 1061-4036. doi: 10.1038/ng1489. URL http://www.ncbi.nlm.nih.gov/pubmed/15592468.
- He et al. [2010] Xionglei He, Wenfeng Qian, Zhi Wang, Ying Li, and Jianzhi Zhang. Prevalent positive epistasis in Escherichia coli and Saccharomyces cerevisiae metabolic networks. Nature genetics, 42(3):272–6, 2010. ISSN 1546-1718. doi: 10.1038/ng.524. URL http://www.ncbi.nlm.nih.gov/pubmed/20101242.
- Edwards et al. [2001] J S Edwards, R U Ibarra, and B ØPalsson. In silico predictions of Escherichia coli metabolic capabilities are consistent with experimental data. Nature biotechnology, 19:125–130, 2001. ISSN 1087-0156. doi: 10.1038/84379.
- Segrè et al. [2002] Daniel Segrè, Dennis Vitkup, and George M Church. Analysis of optimality in natural and perturbed metabolic networks. Proceedings of the National Academy of Sciences of the United States of America, 99(23):15112–7, November 2002. ISSN 0027-8424. doi: 10.1073/pnas.232349399. URL http://www.pubmedcentral.nih.gov/articlerender.fcgi?artid=137552\&tool=pmcentrez\&rendertype=abstract.
- Shlomi et al. [2005] Tomer Shlomi, Omer Berkman, and Eytan Ruppin. Regulatory on/off minimization of metabolic flux. Proceedings of the National Academy of Sciences, 102(21):7695–7700, 2005.
- AbuOun et al. [2009] Manal AbuOun, Patrick F Suthers, Gareth I Jones, Ben R Carter, Mark P Saunders, Costas D Maranas, Martin J Woodward, and Muna F Anjum. Genome scale reconstruction of a Salmonella metabolic model: comparison of similarity and differences with a commensal Escherichia coli strain. The Journal of biological chemistry, 284:29480–29488, 2009. ISSN 0021-9258. doi: 10.1074/jbc.M109.005868.
- Durot et al. [2009] Maxime Durot, Pierre-Yves Bourguignon, and Vincent Schachter. Genome-scale models of bacterial metabolism: reconstruction and applications. FEMS microbiology reviews, 33:164–190, 2009. ISSN 0168-6445. doi: 10.1111/j.1574-6976.2008.00146.x.
- Feist and Palsson [2008] Adam M Feist and Bernhard ØPalsson. The growing scope of applications of genome-scale metabolic reconstructions using Escherichia coli. Nature biotechnology, 26:659–667, 2008. ISSN 1087-0156. doi: 10.1038/nbt1401.
- Fong et al. [2005a] Stephen S Fong, Anthony P Burgard, Christopher D Herring, Eric M Knight, Frederick R Blattner, Costas D Maranas, and Bernhard ØPalsson. In silico design and adaptive evolution of Escherichia coli for production of lactic acid. Biotechnology and bioengineering, 91:643–648, 2005a. ISSN 0006-3592. doi: 10.1002/bit.20542.
- Fong et al. [2005b] Stephen S Fong, Andrew R Joyce, and Bernhard ØPalsson. Parallel adaptive evolution cultures of Escherichia coli lead to convergent growth phenotypes with different gene expression states. Genome research, 15(10):1365–72, October 2005b. ISSN 1088-9051. doi: 10.1101/gr.3832305. URL http://www.pubmedcentral.nih.gov/articlerender.fcgi?artid=1240078\&tool=pmcentrez\&rendertype=abstract.
- Burch and Chao [2004] Christina L Burch and Lin Chao. Epistasis and its relationship to canalization in the RNA virus phi 6. Genetics, 167:559–567, 2004. ISSN 0016-6731. doi: 10.1534/genetics.103.021196.
- You and Yin [2002] Lingchong You and John Yin. Dependence of epistasis on environment and mutation severity as revealed by in silico mutagenesis of phage t7. Genetics, 160:1273–1281, 2002. ISSN 0016-6731.
- Sanjuán [2006] Rafael Sanjuán. Quantifying antagonistic epistasis in a multifunctional RNA secondary structure of the Rous sarcoma virus. The Journal of general virology, 87:1595–1602, 2006. ISSN 0022-1317. doi: 10.1099/vir.0.81585-0.
- Azevedo et al. [2006] Ricardo B R Azevedo, Rolf Lohaus, Suraj Srinivasan, Kristen K Dang, and Christina L Burch. Sexual reproduction selects for robustness and negative epistasis in artificial gene networks. Nature, 440(7080):87–90, March 2006. ISSN 1476-4687. doi: 10.1038/nature04488. URL http://www.ncbi.nlm.nih.gov/pubmed/16511495.
- Lohaus et al. [2010] Rolf Lohaus, Christina L Burch, and Ricardo B R Azevedo. Genetic architecture and the evolution of sex. The Journal of heredity, 101 Suppl:S142–57, 2010. ISSN 1465-7333. doi: 10.1093/jhered/esq013. URL http://www.ncbi.nlm.nih.gov/pubmed/20421324.
- Feist et al. [2007] Adam M Feist, Christopher S Henry, Jennifer L Reed, Markus Krummenacker, Andrew R Joyce, Peter D Karp, Linda J Broadbelt, Vassily Hatzimanikatis, and Bernhard ØPalsson. A genome-scale metabolic reconstruction for Escherichia coli K-12 MG1655 that accounts for 1260 ORFs and thermodynamic information. Molecular systems biology, 3(121):121, January 2007. ISSN 1744-4292. doi: 10.1038/msb4100155. URL http://www.ncbi.nlm.nih.gov/pubmed/17593909.
- Thiele et al. [2011] Ines Thiele, Daniel R Hyduke, Benjamin Steeb, Guy Fankam, Douglas K Allen, Susanna Bazzani, Pep Charusanti, Feng-Chi Chen, Ronan M T Fleming, Chao A Hsiung, Sigrid C J De Keersmaecker, Yu-Chieh Liao, Kathleen Marchal, Monica L Mo, Emre Özdemir, Anu Raghunathan, Jennifer L Reed, Sook-il Shin, Sara Sigurbjörnsdóttir, Jonas Steinmann, Suresh Sudarsan, Neil Swainston, Inge M Thijs, Karsten Zengler, Bernhard ØPalsson, Joshua N Adkins, and Dirk Bumann. A community effort towards a knowledge-base and mathematical model of the human pathogen Salmonella Typhimurium LT2. BMC systems biology, 5:8, 2011. ISSN 1752-0509. doi: 10.1186/1752-0509-5-8.
- Thiele et al. [2005] Ines Thiele, Thuy D Vo, Nathan D Price, and Bernhard ØPalsson. Expanded metabolic reconstruction of Helicobacter pylori (iIT341 GSM/GPR): an in silico genome-scale characterization of single- and double-deletion mutants. Journal of bacteriology, 187:5818–5830, 2005. ISSN 0021-9193. doi: 10.1128/JB.187.16.5818-5830.2005.
- Feist et al. [2006] Adam M Feist, Johannes C M Scholten, Bernhard ØPalsson, Fred J Brockman, and Trey Ideker. Modeling methanogenesis with a genome-scale metabolic reconstruction of Methanosarcina barkeri. Molecular systems biology, 2:2006.0004, 2006. ISSN 1744-4292. doi: 10.1038/msb4100046.
- Plata et al. [2010] Germán Plata, Tzu-Lin Hsiao, Kellen L Olszewski, Manuel Llinás, and Dennis Vitkup. Reconstruction and flux-balance analysis of the Plasmodium falciparum metabolic network. Molecular systems biology, 6:408, 2010. ISSN 1744-4292. doi: 10.1038/msb.2010.60.
- Sanjuán and Elena [2006] Rafael Sanjuán and Santiago F Elena. Epistasis correlates to genomic complexity. Proceedings of the National Academy of Sciences of the United States of America, 103(39):14402–5, September 2006. ISSN 0027-8424. doi: 10.1073/pnas.0604543103. URL http://www.pubmedcentral.nih.gov/articlerender.fcgi?artid=1599975\&tool=pmcentrez\&rendertype=abstract.
- Sanjuán and Nebot [2008] Rafael Sanjuán and Miguel R. Nebot. A network model for the correlation between epistasis and genomic complexity. PLoS ONE, 3, 2008. ISSN 19326203. doi: 10.1371/journal.pone.0002663.
- Kondrashov [1988] A S Kondrashov. Deleterious mutations and the evolution of sexual reproduction. Nature, 336:435–440, 1988. ISSN 0028-0836. doi: 10.1038/336435a0.
- Otto [2007] Sarah P Otto. Unravelling the evolutionary advantage of sex: a commentary on ’Mutation-selection balance and the evolutionary advantage of sex and recombination’ by Brian Charlesworth. Genetical research, 89(5-6):447–9, December 2007. ISSN 1469-5073. doi: 10.1017/S001667230800966X. URL http://www.ncbi.nlm.nih.gov/pubmed/18976534.
- de Visser and Elena [2007] J Arjan G M de Visser and Santiago F Elena. The evolution of sex: empirical insights into the roles of epistasis and drift. Nature reviews. Genetics, 8:139–149, 2007. ISSN 1471-0056. doi: 10.1038/nrg1985.
- Kouyos et al. [2007] Roger D Kouyos, Olin K Silander, and Sebastian Bonhoeffer. Epistasis between deleterious mutations and the evolution of recombination. Trends in ecology & evolution, 22(6):308–15, June 2007. ISSN 0169-5347. doi: 10.1016/j.tree.2007.02.014. URL http://www.ncbi.nlm.nih.gov/pubmed/17337087.
- Covert et al. [2001] Markus W Covert, C H Schilling, and Bernhard ØPalsson. Regulation of gene expression in flux balance models of metabolism. Journal of theoretical biology, 213(1):73–88, 2001. ISSN 0022-5193. doi: 10.1006/jtbi.2001.2405. URL http://www.ncbi.nlm.nih.gov/pubmed/11708855.
- Szappanos et al. [2011] Balázs Szappanos, Károly Kovács, Béla Szamecz, Frantisek Honti, Michael Costanzo, Anastasia Baryshnikova, Gabriel Gelius-Dietrich, Martin J Lercher, Márk Jelasity, Chad L Myers, Brenda J Andrews, Charles Boone, Stephen G Oliver, Csaba Pál, and Balázs Papp. An integrated approach to characterize genetic interaction networks in yeast metabolism. Nature genetics, 43(May):656–662, May 2011. ISSN 1546-1718. doi: 10.1038/ng.846. URL http://www.ncbi.nlm.nih.gov/pubmed/21623372.
- Banta et al. [2007] Scott Banta, Murali Vemula, Tadaaki Yokoyama, Arul Jayaraman, François Berthiaume, and Martin L Yarmush. Contribution of gene expression to metabolic fluxes in hypermetabolic livers induced through burn injury and cecal ligation and puncture in rats. Biotechnology and bioengineering, 97:118–137, 2007. ISSN 1559-047X. doi: 10.1097/01253092-200603001-00230.
- Hartl and Clark [2007] Daniel L Hartl and Andrew G Clark. Principles of Population Genetics. Sinauer Associates, Inc., Sinauer, Sunderland, MA, 4th edition, 2007. ISBN 0878933085.