Polarization Predictions for Inflationary CMB Power Spectrum Features
Abstract
We conduct a model-independent analysis of temporal features during inflation in the large-scale CMB temperature power spectrum allowing for the possibility of non-negligible tensor contributions. Of 20 principal components of the inflationary history, the suppression of power at low multipoles beginning with a glitch at multipoles implies deviations in 2-3 of them with 2-3 deviations in each, with larger values reflecting cases where tensors are allowed. If tensors are absent, the corresponding -mode polarization features follow a similar pattern but are predicted to be up to twice as large. They offer the opportunity to soon double the significance of inflationary features or eliminate them as an explanation of temperature features. The tensor degeneracy with features in the temperature power spectrum is broken not only by but also by -polarization. A precision measurement of -mode polarization at multipoles from can potentially provide an independent constraint on tensors that is less subject to dust foreground uncertainties.
I Introduction
Given the soon to be released measurements of the large-angle polarization power spectrum, it is timely to reassess the status of anomalies in the temperature power spectrum and determine how their inflationary origin might be confirmed or refuted with polarization measurements. Ever since the first release of WMAP data Hinshaw et al. (2003), the large-angle temperature power spectrum has shown several anomalous features when compared with the simplest power law or scale-free inflationary CDM model. In particular, there is a glitch in the power spectrum at multipoles Peiris et al. (2003) and a deficit of large-angle correlations Spergel et al. (2003); Copi et al. (2007).
The significance and interpretation of these features change with temperature measurements by the Planck satellite Ade et al. (2013a) and the 150 GHz measurement of degree scale -mode polarization by the BICEP2 experiment Ade et al. (2014). Relative to new Planck data at higher multipole moments, the significance of the power deficit at low multipoles in the CDM model increases. Although the BICEP2 measurement is expected to be at least partially contaminated by galactic dust based on subsequent Planck measurements at dust dominated frequencies Adam et al. (2014), any contribution from inflationary gravitational waves near a tensor-to-scalar ratio of Ade et al. (2013b) exacerbates the power spectrum deficit and increases its significance.
These temperature power spectrum features could indicate features in the initial spectrum of curvature fluctuations. Indeed there is an extensive literature on converting these measurements into model-independent constraints on this spectrum (e.g. Hannestad (2001); Hu and Okamoto (2004); Tegmark and Zaldarriaga (2002); Hannestad (2004); Bridle et al. (2003); Mukherjee and Wang (2003); Leach (2006); Peiris and Verde (2010); Hlozek et al. (2012); Gauthier and Bucher (2012); Vazquez et al. (2012); Hunt and Sarkar (2014); Aslanyan et al. (2014); Hazra et al. (2014a)). Features could even have an origin in inflation if its near time-translation invariance is broken at least transiently when these scales left the horizon during inflation (e.g. Peiris et al. (2003); Contaldi et al. (2003); Martin and Ringeval (2004); Freivogel et al. (2006); Covi et al. (2006); Joy et al. (2008); Hazra et al. (2010); Achucarro et al. (2014); Contaldi et al. (2014); Miranda et al. (2014); Abazajian et al. (2014); Hazra et al. (2014b); Bousso et al. (2014)). Specific models that fit features also make predictions for mode polarization by which they can be verified Mortonson et al. (2009); Miranda et al. (2014); Bousso et al. (2014). Here we seek to generalize these results and polarization predictions for any single-field inflation model that fits the temperature features.
Model independent constraints on curvature power spectrum features cannot be directly applied to inflationary features. In particular, not all possible curvature power spectra are allowed in single field inflation. This restriction is especially important when considering sharp features in the temperature power spectrum. A temporal feature that is localized to less than an efold during inflation does not produce a feature in the curvature spectrum localized to a comparable range in wavenumber as implied by the slow-roll approximation. Instead the features oscillate or ring across an extended range in wavenumbers.
For models with inflationary features, the slow-roll approximation must be replaced by either an exact computation or the generalized slow-roll (GSR) approximation Stewart (2002a); Choe et al. (2004a); Dvorkin and Hu (2010a). The latter has the advantage that the curvature power spectrum depends on integrals which are linear in a single source function. Therefore, it is well suited for model-independent studies of power spectrum reconstruction Dvorkin and Hu (2010b, 2011). In canonical single-field inflation, this source function is related to the shape of the inflationary potential in the same way the tilt is in the slow-roll approximation. In this paper, we adapt this reconstruction technique for the study of large-angle power spectrum anomalies in the presence of potentially non-negligible tensor contributions from inflation.
We start by reviewing and adapting the GSR formalism for inflationary source reconstruction with large-angle temperature data in §II. In §III, we present results for the implied inflationary features and how their existence may be verified or falsified by -mode polarization data. We discuss these results in §IV.
II Inflationary Reconstruction
In this section we describe the GSR parameterization of inflationary sources to the curvature spectrum. We adapt the methodology of Refs. Dvorkin and Hu (2010b, 2011) for a focused study of large-angle anomalies including the possibility of non-negligible tensor contributions. In §II.1 we review the GSR formalism itself and its application to the curvature and tensor power spectra. We describe the sampling parameters for the curvature source used in the likelihood analysis as well as representations in terms of principal components in §II.2.
II.1 Generalized Slow Roll
The GSR approach provides a model-independent description of inflationary power spectra that allows for transient violations of the ordinary slow-roll approximation in single field inflation as might occur from features in the inflaton potential or sound speed evolution. In this approximation, features in the curvature power spectrum arise from changes in the Hubble rate and sound speed through a single function of time or scale
| (1) |
where Stewart (2002b); Hu (2011a)
| (2) |
Here,
| (3) |
where is the number of efolds and at the end of inflation, denotes the sound speed of field fluctuations, and . The sound horizon is given by
| (4) |
Specifically the dimensionless curvature power spectrum as derived from Green function techniques is Choe et al. (2004b); Dvorkin and Hu (2010c)
| (5) | ||||
where is an arbitrary epoch during inflation such that all relevant -modes are well outside the sound horizon, . Changes in the source function are transferred to the power spectrum according to the window function
| (6) |
at leading order in the deviations of the inflaton mode function from its de Sitter form and to
| (7) |
through
| (8) |
for the dominant second order contribution. This form for the power spectrum remains a good approximation if the second order term Dvorkin and Hu (2011)
| (9) |
and hence allows for up to order unity features in the curvature power spectrum.
Given the dependence of this power spectrum on a single source function, we seek to constrain or reconstruct directly from the data. Note that for an inflaton with a canonical kinetic term Dvorkin and Hu (2010c)
| (10) |
so that a reconstruction of can be thought of as a measurement of the shape of the potential. More generally in inflation Hu (2011b), or equivalently the effective field theory of inflation for the mode of the broken time translation invariance Cheung et al. (2008), is the quantity that determines the tilt in the ordinary slow-roll approximation.
In principle, the gravitational wave power spectrum in each polarization state follows the same prescription with the replacement Gong (2004); Hu (2014)
| (11) |
where is the conformal time to the end of inflation. However, since this source only depends on and integrals of , transient changes in and have very small impact on tensors. The spectrum therefore remains a power law to good approximation, and we parameterize it as usual by a tensor-to-scalar ratio and tilt ,
| (12) |
where is some fiducial normalization scale. If is chosen to be far from any features in the curvature power spectrum then the usual consistency relation applies.
II.2 Parameterized Source
The ordinary slow-roll approximation corresponds to a parameterization of the curvature source function by a constant , and results in a power-law curvature power spectrum. We therefore look for parameterized deviations from this constant behavior. In general, given some set of basis functions we can describe the source function with a set of coefficients as
| (13) |
The advantage of the GSR form in Eq. (5) is that the integrals are linear in and hence the impact of the individual components can be precomputed separately
| (14) |
so that the power spectrum becomes a sum over the basis
| (15) |
where
| (16) |
Note that we have absorbed the normalization constant into the amplitude of the power spectrum at the scale
| (17) |
In Ref. Dvorkin and Hu (2010b, 2011), the basis functions were chosen to be the principal components (PCs) of the Fisher matrix for the full WMAP range of scales. Since the Fisher matrix is constructed from the expected errors of a given experiment, this technique is blind to the presence of anomalies in the actual data. The drawback for studying known large-angle anomalies is that the basis does not efficiently encode them. Here we take an alternate approach that is better suited to making polarization predictions for such anomalies rather than searching for them.
These anomalies appear on scales larger than the acoustic scale at recombination but smaller than the current horizon scale, and so we choose to restrict our parameterization to
| (18) |
Next we follow Ref. Dvorkin and Hu (2011) in defining a band limit for the frequency of deviations by sampling at a rate of 10 per decade or about 4 per efold of inflation. This rate was determined to be sufficient to capture large-scale features in the power spectrum.
The parameterized function is then the natural spline of these sampling points . In the language of Eq. (13), its basis is constructed by splining the set of sampling points
| (19) |
with values in the range specified by Eq. (18) and a sampling grid in that extends sufficiently further that the basis functions have negligible support thereafter. We choose the arbitrary epoch to be the large-scale endpoint of the sampling grid and order the points so that Mpc is the smallest scale.
In practice, we then precompute and on a fine grid in -space and use a modified version of CAMB to evaluate CMB observables. The curvature power spectrum is then defined by 22 parameters . We set the normalization point Mpc-1 to be the pivot point for the Planck dataset Miranda and Hu (2014), which has the benefit that it is in the featureless or slow-roll regime by assumption. To these we add the cosmological parameters of the flat CDM model: the cold dark matter density , the baryon density , the effective angular size of the CMB sound horizon , and the Thomson optical depth to recombination . We call this model CDM, defined by 26 parameters, whereas the CDM model sets and has only 6 free parameters.
For the tensor power spectrum we consider cases where or constrained by the temperature and/or polarization data. Since there is little current information on the slope of the tensor spectrum, we set so as to satisfy the inflationary consistency relation for . We call the model that allows for non-negligible tensors CDM.
Constraints on these parameters from the datasets are obtained using the Markov Chain Monte Carlo (MCMC) technique implemented with the CosmoMC code Lewis and Bridle (2002). The cosmological parameters are all given non-informative priors except for a global constraint on set by Eq. (9) beyond which the GSR approach breaks down. We also include the standard Planck foreground parameters in all analyses.
Since our choice of parameters oversamples relative to what the data can constrain, individual measurements of are noisy with any true signal buried in the small covariance between parameters. For visualization purposes, we therefore also construct the principal components derived from an eigenvalue decomposition of the MCMC covariance matrix estimate
| (20) |
where is an orthonormal matrix of eigenvectors. Specifically, we define the PC parameters
| (21) |
such that their covariance matrix satisfies
| (22) |
We then postprocess the MCMC chains to obtain the posterior probability distributions in these derived parameters. Given a rank ordering of the PC modes from smallest to largest variance, we can also construct a PC filtered reconstruction of as Dvorkin and Hu (2011)
| (23) |
where is chosen to reflect the well-measured eigenmodes.
The differences between this construction and that of Ref. Dvorkin and Hu (2011) are that the PCs are defined by the covariance matrix inferred from the data itself and change for different data combinations, their normalization is set by the discrete rather than continuous orthonormality condition, and that their range is restricted by Eq. (18) to be in the region of known anomalies. Finally, we allow for the possibility of non-negligible tensor contributions to the observed spectra through the tensor-to-scalar ratio .
| Model | Dataset | |
|---|---|---|
| - | CDM | |
| - | CDM | |
| - | CDM | +BICEP2 |
| - | - | - | |
III Results
Here we present results for the curvature source function , which controls deviations from power-law initial conditions and their polarization predictions. We begin in §III.1 with the case where tensor contributions are assumed to be negligible. In §III.2 we study the impact of tensors, constrained either by the temperature data alone or by the BICEP2 -mode measurement, in changing the interpretation of temperature anomalies and their polarization predictions. These model and dataset choices are summarized in Tab. 1.
.
III.1 Curvature Only
We begin with a baseline dataset whose inferences on the source function is mainly driven by the Planck temperature power spectrum Ade et al. (2013c). To these we add the WMAP9 polarization Bennett et al. (2012), Union 2.1 supernovae distance 111http://www.supernova.lbl.gov/Union, baryon acoustic oscillation Anderson et al. (2013); Padmanabhan et al. (2012); Blake et al. (2011), and SHOES Riess et al. (2011) datasets in order to constrain other cosmological parameters in the flat CDM model. We call this combination the “” dataset.
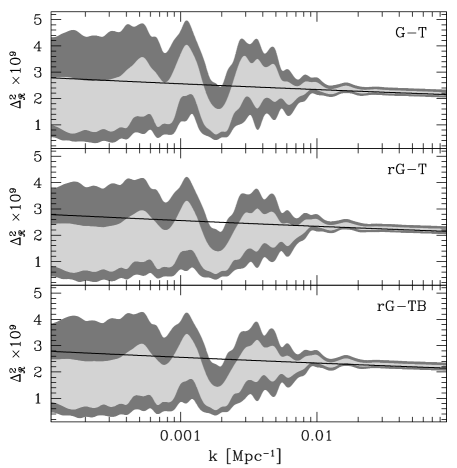
We first study this dataset under the assumption that tensors are negligible () in the CDM context and call this the - analysis. Tab. 2 gives the constraints on parameters. As expected, our oversampling of the function relative to what the data can constrain means that results on individual amplitudes marginalized over the other parameters have very low signal-to-noise. Nonetheless, combined with their covariances, they do favor a suppression of the curvature power spectrum at large scales. To quantify these features we consider the power spectrum itself to be a derived parameter and show the 68% and 95% CL regions in Fig. 1 (top panel). We also show the best fit CDM model Miranda and Hu (2014), with parameters , , , , , , for reference. In the following we quote results relative to the predictions of this model.
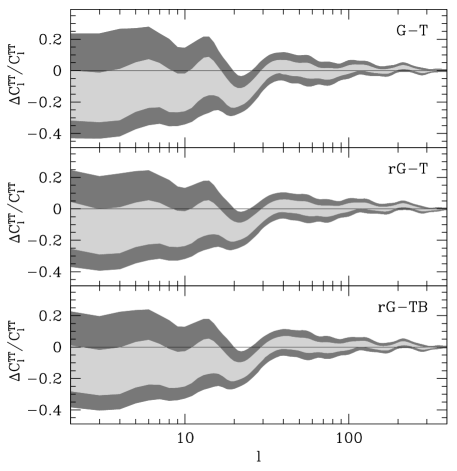
Note the coherent suppression of power relative to this fiducial model for Mpc-1 that begins with a fairly sharp, almost oscillatory, dip with a slight preference for larger power on either side. This position corresponds to the known temperature power spectrum anomaly at as shown in Fig. 2 Peiris et al. (2003). Here we similarly consider the theoretical temperature power spectrum as a derived parameter. In particular there is deficit of power at and a slight excess of power at .
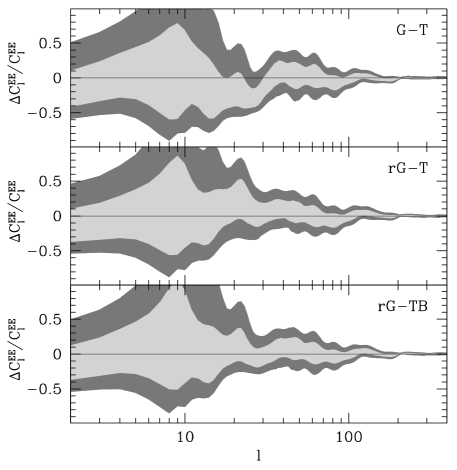
In this region, the cross correlation is small and so the power spectrum provides nearly independent information on this feature. In Fig. 3, we show the theoretical power spectrum as a derived parameter. Note first the much larger allowed range of fractional deviations. Since the cosmic variance limit on measuring deviations in and are the same fractionally, this indicates the large discovery potential for precision measurements with even measurements across the band being of interest for verifying or falsifying the inflationary explanation of temperature features. Because of projection effects, namely the enhanced sharpness of the transfer of power to polarization Hu and White (1997), the fractional suppression of polarization power is predicted to begin at a slightly higher multipole and is allowed to reach lower values at the extrema at around . For the predictions are subject to uncertainties in reionization Mortonson et al. (2009) as well as possible impact of galactic foregrounds on the WMAP9 polarization used here as a constraint. They are thus of less immediate relevance for inflationary features.

.
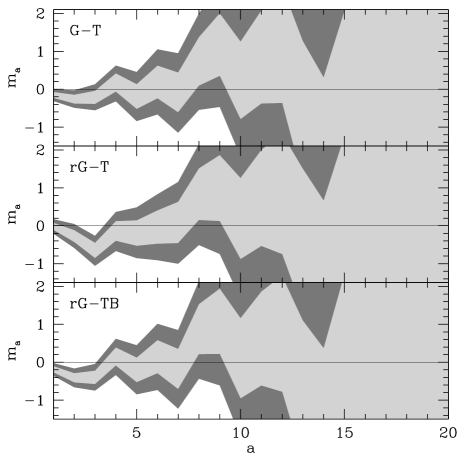
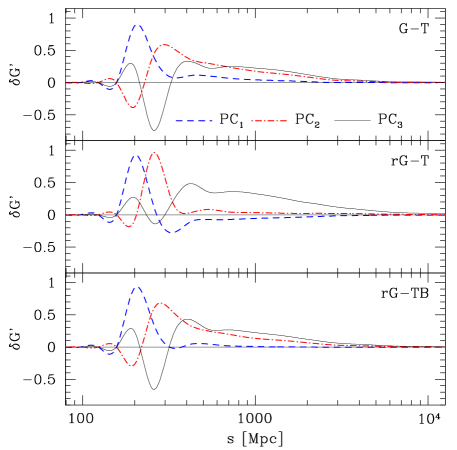
Given the possibility of confirmation by upcoming polarization measurements, it is interesting to explore in more detail what constraints on inflationary models these features imply. Since the constraints on are too noisy to visualize the small but statistically significant constraints directly, we transform them to the PC basis as described in the previous section. In Fig. 4 we show each of the 20 statistically independent measurements. Only the first 3 PCs show measurements that that deviate from at the 95% CL or more. In terms of the standard errors in Tab. 2, is a deviation in both and . Fig. 5 confirms that indeed lies in the tails of the posterior probability distribution in both. Given the 20 parameter model, this indicates a preference for a deviation in that is significant but not overwhelmingly so. Given that the corresponding polarization features can be twice as large, we can infer that if the parameters remain at their central values, polarization measurements can provide a convincing detection of the deviation.
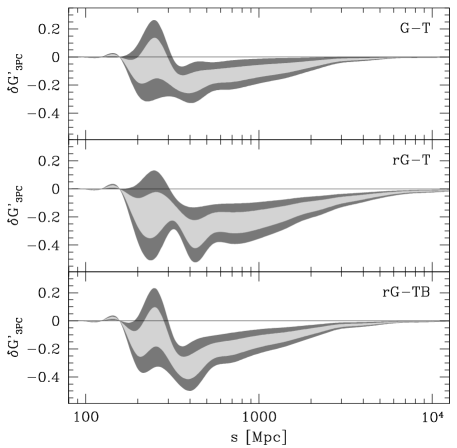
These first 3 PCs represent coherent deviations in the source function on scales Mpc with differences mainly reflecting the location and how sharply the deviations rise around that scale (see Fig. 6). Since the PCs are constructed for each model-dataset independently, a particular does not have a fixed meaning. It is therefore useful to sum the first three components together to form a 3PC filtered reconstruction of from Eq. (23) shown in Fig. 7. Of course, more rapid deviations or deviations at Mpc are allowed by the higher PCs but they are not significantly constrained by the data. In fact these models are mainly limited by the prior on in Eq. (9) and the sampling rate (see e.g. Adshead et al. (2012); Miranda and Hu (2014) for allowed models with finer structure). The data instead favor a relatively sharp suppression of beginning at Mpc that is coherent thereafter. A feature in in canonical models implies a corresponding feature in the inflation potential through Eq. (10).

III.2 Curvature and Tensors
The preference for features in the curvature source only get more significant if the tensor-to-scalar ratio is allowed to vary as in the CDM model. We first consider implications from the temperature-based dataset and call this the - analysis. In this dataset, the tensor amplitude is constrained by the shape of the temperature power spectrum due to its tensor contributions above the horizon at recombination. To achieve the same temperature power spectrum, the curvature contributions must be further suppressed and hence there is a near degeneracy between and .
Thus instead of the upper limit of (95% CL) at Mpc-1 Ade et al. (2013b), the constraints on weaken substantially as shown in Fig. 8, allowing and even mildly preferring values of . These large values are mildly preferred because of the excess of power in the temperature spectrum around (see Fig. 2) which can be explained by a large tensor contribution. Of course, such an explanation would require an even larger suppression of the curvature spectrum on larger scales to produce the same temperature power spectrum.
These qualitative expectations are borne out in the curvature power spectrum constraints in Fig. 1. The suppression in the curvature power spectrum begins at Mpc-1 making the feature there appear less like a glitch and more like part of a coherent, but larger and more significant, suppression of long-wavelength power. Note that the combination of the curvature and tensor sources leads to the very similar temperature power spectra shown in Fig. 2.
Interestingly, the prediction for -mode polarization power spectrum differs qualitatively from the - case (see Fig. 3). Tensors also contribute -modes with a larger to ratio than scalars due to projection effects (see e.g. Hu and White (1997), Eq. 25). Thus instead of a deficit in power there is a preference for an increment in power in the regime that is allowed to reach in excess of in contrast to the without tensors. Thus, polarization power spectrum can provide a sharp test of models with .
In terms of the principal components, and are disfavored at and respectively in Tab. 2 and in Fig. 4, and lie in the tails of the posterior distributions of Fig. 5. The first component no longer shows a significant deviation. Although the detailed shape of the PCs vary depending on the model-dataset combination (see Fig. 6), the first component is still associated with a rapid change in deviations around Mpc. With the addition of tensors, the change in the curvature source is more gradual. This can be seen in the 3 PC filtered reconstruction of Fig. 7, where the main difference is a gradual increase in amplitude to larger and a broadening of the allowed range.
In fact, the dataset allows such large values of that interpreting the BICEP2 -mode detection as an upper limit restricts the range of deviations and -polarization predictions. In the - analysis, we assume that there is no dust contamination to the measurement and hence obtain conservative maximal values for . Even under this assumption, the addition of the BICEP2 measurement eliminates models with at high confidence (see Fig. 8). In the curvature power spectrum, this makes the predictions intermediate between the - and - analyses, in particular for slightly larger than the Mpc-1 glitch. Likewise, the -polarization predictions are intermediate as well. Instead of a deficit or increment in predicted power, there is little net preference for either. Note however that in the regime there still is a shallower relative dip of which can still be used to confirm an inflationary feature with precision measurements (see also Miranda et al. (2014) for model examples). For the PCs of the - analysis the first three components disfavor at the , , levels (see Tab. 2 and Figs. 4-5).
Of course, this larger formal significance of should not be interpreted as enhanced evidence for features given the uncertain level of contamination by dust. Accounting for some fractional contamination by dust would further interpolate between the - and - results. In fact, if a polarization dip at is detected, its depth relative to the temperature one can be used to constrain further independently of the -modes.
IV Discussion
We have provided a model-independent analysis of large-scale inflationary features in the CMB temperature power spectrum allowing for the possibility of non-negligible tensor contributions. Unlike similar treatments for the curvature power spectrum, we directly parameterize the inflationary source of curvature fluctuations or, correspondingly, features in the potential for canonical single field inflationary models. This prevents the problem of fitting the data to unphysical forms for the curvature power spectrum. Our parameterization is instead limited by the chosen 1/4 of an efold sampling of temporal features during inflation and the restriction to observable scales larger than 200 Mpc.
When analyzed in terms of the 20 principal components of the curvature source function, the temperature anomalies imply deviations from scale-free power law conditions in 2-3 parameters with 2-3 deviations in each, with larger values reflecting cases where tensors are allowed. These deviations correspond to a suppression of power at low multipoles beginning with a glitch at multipoles .
If tensors are absent, the corresponding -mode polarization features follow a similar pattern but are predicted to be up to twice as large. They offer the opportunity to double the significance of inflationary features or render the temperature anomalies as statistical flukes or inconsistent with single field inflationary models. If tensors are allowed, then there is a degeneracy in the temperature power spectrum between a reduction in curvature fluctuations at large scales and an increase in the tensor-to-scalar ratio that allows . Tensors also change the interpretation of the glitch by making it more consistent with a monotonic suppression of large-scale curvature power.
This degeneracy is broken not only by the -mode polarization of tensors but also by their -mode polarization. We have shown that the general signature of such a large tensor-to-scalar ratio is to predict an increase in the -mode polarization power spectrum where the deficit in the power spectrum exists. While the BICEP2 data can already be inferred to place an upper bound on of this order, a precision measurement of -mode polarization at multipoles from can potentially provide an independent constraint that is less subject to dust foreground uncertainties. These predictions will soon be tested with the release of the -mode polarization spectrum from the Planck collaboration.
Acknowledgements.
WH and VM were supported by U.S. Dept. of Energy contract DE-FG02-13ER41958 and the Kavli Institute for Cosmological Physics at the University of Chicago through grants NSF PHY-0114422 and NSF PHY-0551142. CD was supported by NASA through Hubble Fellowship grant HST-HF2-51340.001 awarded by the Space Telescope Science Institute, which is operated by the Association of Universities for Research in Astronomy, Inc., for NASA, under contract NAS 5-26555. This work made use of computing resources and support provided by the Research Computing Center at the University of Chicago.References
- Hinshaw et al. (2003) G. Hinshaw et al. (WMAP Collaboration), Astrophys.J.Suppl. 148, 135 (2003), arXiv:astro-ph/0302217 [astro-ph] .
- Peiris et al. (2003) H. Peiris et al. (WMAP Collaboration), Astrophys.J.Suppl. 148, 213 (2003), arXiv:astro-ph/0302225 [astro-ph] .
- Spergel et al. (2003) D. Spergel et al. (WMAP Collaboration), Astrophys.J.Suppl. 148, 175 (2003), arXiv:astro-ph/0302209 [astro-ph] .
- Copi et al. (2007) C. Copi, D. Huterer, D. Schwarz, and G. Starkman, Phys.Rev. D75, 023507 (2007), arXiv:astro-ph/0605135 [astro-ph] .
- Ade et al. (2013a) P. Ade et al. (Planck Collaboration), (2013a), arXiv:1303.5083 [astro-ph.CO] .
- Ade et al. (2014) P. Ade et al. (BICEP2 Collaboration), Phys.Rev.Lett. 112, 241101 (2014), arXiv:1403.3985 [astro-ph.CO] .
- Adam et al. (2014) R. Adam et al. (Planck Collaboration), (2014), arXiv:1409.5738 [astro-ph.CO] .
- Ade et al. (2013b) P. Ade et al. (Planck Collaboration), (2013b), arXiv:1303.5082 [astro-ph.CO] .
- Hannestad (2001) S. Hannestad, Phys.Rev. D63, 043009 (2001), arXiv:astro-ph/0009296 [astro-ph] .
- Hu and Okamoto (2004) W. Hu and T. Okamoto, Phys. Rev. D69, 043004 (2004), arXiv:astro-ph/0308049 .
- Tegmark and Zaldarriaga (2002) M. Tegmark and M. Zaldarriaga, Phys.Rev. D66, 103508 (2002), arXiv:astro-ph/0207047 [astro-ph] .
- Hannestad (2004) S. Hannestad, JCAP 0404, 002 (2004), arXiv:astro-ph/0311491 [astro-ph] .
- Bridle et al. (2003) S. L. Bridle, A. M. Lewis, J. Weller, and G. Efstathiou, Mon. Not. Roy. Astron. Soc. 342, L72 (2003), arXiv:astro-ph/0302306 .
- Mukherjee and Wang (2003) P. Mukherjee and Y. Wang, Astrophys.J. 599, 1 (2003), arXiv:astro-ph/0303211 [astro-ph] .
- Leach (2006) S. M. Leach, Mon. Not. Roy. Astron. Soc. 372, 646 (2006), arXiv:astro-ph/0506390 .
- Peiris and Verde (2010) H. V. Peiris and L. Verde, Phys. Rev. D 81, 021302 (2010).
- Hlozek et al. (2012) R. Hlozek, J. Dunkley, G. Addison, J. W. Appel, J. R. Bond, et al., Astrophys.J. 749, 90 (2012), arXiv:1105.4887 [astro-ph.CO] .
- Gauthier and Bucher (2012) C. Gauthier and M. Bucher, JCAP 1210, 050 (2012), arXiv:1209.2147 [astro-ph.CO] .
- Vazquez et al. (2012) J. A. Vazquez, M. Bridges, M. Hobson, and A. Lasenby, JCAP 1206, 006 (2012), arXiv:1203.1252 [astro-ph.CO] .
- Hunt and Sarkar (2014) P. Hunt and S. Sarkar, JCAP 1401, 025 (2014), arXiv:1308.2317 [astro-ph.CO] .
- Aslanyan et al. (2014) G. Aslanyan, L. C. Price, K. N. Abazajian, and R. Easther, JCAP 1408, 052 (2014), arXiv:1403.5849 [astro-ph.CO] .
- Hazra et al. (2014a) D. K. Hazra, A. Shafieloo, and T. Souradeep, (2014a), arXiv:1406.4827 [astro-ph.CO] .
- Contaldi et al. (2003) C. R. Contaldi, M. Peloso, L. Kofman, and A. D. Linde, JCAP 0307, 002 (2003), arXiv:astro-ph/0303636 [astro-ph] .
- Martin and Ringeval (2004) J. Martin and C. Ringeval, Phys.Rev. D69, 083515 (2004), arXiv:astro-ph/0310382 [astro-ph] .
- Freivogel et al. (2006) B. Freivogel, M. Kleban, M. Rodriguez Martinez, and L. Susskind, JHEP 0603, 039 (2006), arXiv:hep-th/0505232 [hep-th] .
- Covi et al. (2006) L. Covi, J. Hamann, A. Melchiorri, A. Slosar, and I. Sorbera, Phys. Rev. D74, 083509 (2006), arXiv:astro-ph/0606452 .
- Joy et al. (2008) M. Joy, V. Sahni, and A. A. Starobinsky, Phys.Rev. D77, 023514 (2008), arXiv:0711.1585 [astro-ph] .
- Hazra et al. (2010) D. K. Hazra, M. Aich, R. K. Jain, L. Sriramkumar, and T. Souradeep, JCAP 1010, 008 (2010), arXiv:1005.2175 [astro-ph.CO] .
- Achucarro et al. (2014) A. Achucarro, V. Atal, P. Ortiz, and J. Torrado, Phys.Rev. D89, 103006 (2014), arXiv:1311.2552 [astro-ph.CO] .
- Contaldi et al. (2014) C. R. Contaldi, M. Peloso, and L. Sorbo, (2014), arXiv:1403.4596 [astro-ph.CO] .
- Miranda et al. (2014) V. Miranda, W. Hu, and P. Adshead, Phys.Rev. D89, 101302 (2014), arXiv:1403.5231 [astro-ph.CO] .
- Abazajian et al. (2014) K. N. Abazajian, G. Aslanyan, R. Easther, and L. C. Price, JCAP 1408, 053 (2014), arXiv:1403.5922 [astro-ph.CO] .
- Hazra et al. (2014b) D. K. Hazra, A. Shafieloo, G. F. Smoot, and A. A. Starobinsky, (2014b), arXiv:1404.0360 [astro-ph.CO] .
- Bousso et al. (2014) R. Bousso, D. Harlow, and L. Senatore, (2014), arXiv:1404.2278 [astro-ph.CO] .
- Mortonson et al. (2009) M. J. Mortonson, C. Dvorkin, H. V. Peiris, and W. Hu, Phys. Rev. D79, 103519 (2009), arXiv:0903.4920 [astro-ph.CO] .
- Stewart (2002a) E. D. Stewart, Phys. Rev. D65, 103508 (2002a), arXiv:astro-ph/0110322 .
- Choe et al. (2004a) J. Choe, J.-O. Gong, and E. D. Stewart, JCAP 0407, 012 (2004a), arXiv:hep-ph/0405155 .
- Dvorkin and Hu (2010a) C. Dvorkin and W. Hu, Phys. Rev. D81, 023518 (2010a), arXiv:0910.2237 [astro-ph.CO] .
- Dvorkin and Hu (2010b) C. Dvorkin and W. Hu, Phys. Rev. D82, 043513 (2010b), arXiv:1007.0215 [astro-ph.CO] .
- Dvorkin and Hu (2011) C. Dvorkin and W. Hu, Phys.Rev. D84, 063515 (2011), arXiv:1106.4016 [astro-ph.CO] .
- Stewart (2002b) E. D. Stewart, Phys.Rev. D65, 103508 (2002b), arXiv:astro-ph/0110322 [astro-ph] .
- Hu (2011a) W. Hu, Phys.Rev. D84, 027303 (2011a), arXiv:1104.4500 [astro-ph.CO] .
- Choe et al. (2004b) J. Choe, J.-O. Gong, and E. D. Stewart, JCAP 0407, 012 (2004b), arXiv:hep-ph/0405155 [hep-ph] .
- Dvorkin and Hu (2010c) C. Dvorkin and W. Hu, Phys.Rev. D81, 023518 (2010c), arXiv:0910.2237 [astro-ph.CO] .
- Hu (2011b) W. Hu, Phys.Rev. D84, 027303 (2011b), arXiv:1104.4500 [astro-ph.CO] .
- Cheung et al. (2008) C. Cheung, P. Creminelli, A. L. Fitzpatrick, J. Kaplan, and L. Senatore, JHEP 0803, 014 (2008), arXiv:0709.0293 [hep-th] .
- Gong (2004) J.-O. Gong, Class.Quant.Grav. 21, 5555 (2004), arXiv:gr-qc/0408039 [gr-qc] .
- Hu (2014) W. Hu, Phys.Rev. D89, 123503 (2014), arXiv:1405.2020 [astro-ph.CO] .
- Miranda and Hu (2014) V. Miranda and W. Hu, Phys.Rev. D89, 083529 (2014), arXiv:1312.0946 [astro-ph.CO] .
- Lewis and Bridle (2002) A. Lewis and S. Bridle, Phys. Rev. D66, 103511 (2002), astro-ph/0205436 .
- Ade et al. (2013c) P. Ade et al. (Planck Collaboration), (2013c), arXiv:1303.5076 [astro-ph.CO] .
- Bennett et al. (2012) C. Bennett, D. Larson, J. Weiland, N. Jarosik, G. Hinshaw, et al., (2012), arXiv:1212.5225 [astro-ph.CO] .
- Note (1) http://www.supernova.lbl.gov/Union.
- Anderson et al. (2013) L. Anderson, E. Aubourg, S. Bailey, D. Bizyaev, M. Blanton, et al., Mon.Not.Roy.Astron.Soc. 428, 1036 (2013), arXiv:1203.6594 [astro-ph.CO] .
- Padmanabhan et al. (2012) N. Padmanabhan, X. Xu, D. J. Eisenstein, R. Scalzo, A. J. Cuesta, et al., Mon.Not.Roy.Astron.Soc. 427, 2132 (2012), arXiv:1202.0090 [astro-ph.CO] .
- Blake et al. (2011) C. Blake, E. Kazin, F. Beutler, T. Davis, D. Parkinson, et al., Mon.Not.Roy.Astron.Soc. 418, 1707 (2011), arXiv:1108.2635 [astro-ph.CO] .
- Riess et al. (2011) A. G. Riess, L. Macri, S. Casertano, H. Lampeitl, H. C. Ferguson, et al., Astrophys.J. 730, 119 (2011), arXiv:1103.2976 [astro-ph.CO] .
- Hu and White (1997) W. Hu and M. J. White, Phys.Rev. D56, 596 (1997), arXiv:astro-ph/9702170 [astro-ph] .
- Adshead et al. (2012) P. Adshead, C. Dvorkin, W. Hu, and E. A. Lim, Phys.Rev. D85, 023531 (2012), arXiv:1110.3050 [astro-ph.CO] .