Search for long-lived particles at CMS
Abstract
The most recent searches for long-lived particles at CMS are presented. Searches for displaced jets, displaced leptons, displaced stops, and heavy stable charged particles are among those discussed. A variety of models are constrained by these searches, ranging from hidden valleys to split supersymmetry.
keywords:
1 Introduction
Many models of new physics predict the existence of new, long-lived particles, which would appear with a very distinctive experimental signature. Scenarios in which these new particles could arise include supersymmetric (SUSY) scenarios such as “split SUSY” [1] or SUSY with very weak R-parity violation [2], “hidden valley” models [3], and Z’ models that include long-lived neutralinos [4].
The Compact Muon Solenoid (CMS) collaboration [5] has conducted a number of searches for a variety of different experimental signatures and theoretical models using data collected from proton-proton collisions at the Large Hadron Collider (LHC). This paper presents an overview of the results of these searches using 2012 data taken at TeV.
There are four analyses discussed here: the first, the “displaced lepton” analysis [6], searches for long-lived neutral particles with a lifetime such that they decay within the CMS detector, but at a significant displacement from the primary event vertex. The decay products of these particles include a pair of either electrons or muons. The second, the “displaced jets” analysis [7], considers a similar model, but for the case where the long-lived particles decay into jets. The third, the “displaced SUSY” analysis [8], considers a model where stops are pair-produced and decay via . Finally, the “heavy stable charged particle” (HSCP) analysis [9] searches for particles with a large enough lifetime that they do not decay inside the CMS detector. These particles may have a velocity significantly less than or a charge not equal to .
2 Displaced leptons
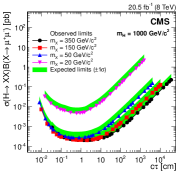
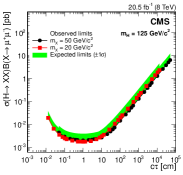
The displaced lepton search is sensitive to a wide class of models that contain long-lived particles decaying to leptons, but for the context of computing limits, two specific signal models are considered. In the first, a non-Standard Model (SM) Higgs decays to a long-lived spinless boson X ( XX), which then decays into a pair of leptons (either X ee or X ). In the second model, a pair of squarks is produced in the initial pp collision; each squark then decays into a long-lived neutralino (). The neutralino then has a R-parity violating decay into a neutrino and two leptons (). Although in these models the long-lived particles are pair-produced and so we would expect to observe up to two displaced vertices per event, for maximum generality this search only requires one displaced vertex to be found.
The data is collected using a pair of triggers, one for each channel, requiring either two high-energy deposits in the electromagnetic calorimeter or two high-momentum tracks in the muon detector. In both cases, the tracker information is not used in the trigger, as the track reconstruction at the CMS high-level trigger (HLT) is not necessarily efficient for displaced tracks. In the muon case, the muons are reconstructed without any primary vertex constraint, and muons from cosmic rays are vetoed by requiring that the three-dimensional angle between the two muons be less than 2.5 radians.
Simulated signal samples are generated using pythia to simulate XX, X decay for a variety of , X masses, and X particle lifetimes corresponding to a transverse decay length of 2 cm, 20 cm, and 200 cm in the laboratory frame. The model is also simulated using pythia for a variety of and masses, with the R-parity violating parameters chosen to give a transverse decay length of approximately 20 cm. The signal samples are then reweighted to simulate a variety of different lifetimes. The background is also simulated using pythia; the primary background originates from Drell-Yan production of pairs of leptons, with other contributions from pair production of W or Z bosons, production, and QCD multijet events.
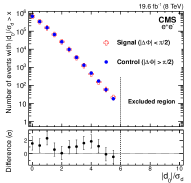
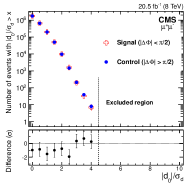
Long-lived particle candidates are then identified by looking for two isolated, energetic electrons (with 40 GeV) or muons (with 26 ) that form a good vertex, and are required to be significantly displaced from the primary vertex (the significance of the transverse impact parameter ). The background is estimated using a data-driven method, exploiting the fact that the angle between the flight direction to the secondary vertex and the dilepton momentum should be close to 0 for a true long-lived particle event, but randomly distributed for background. Thus, by dividing into a signal region with and a control region with , one can use the number of events in the latter to estimate the background contribution in the former. Figure 1 shows the validity of this method, by comparing the number of events in the signal and control region as a function of the transverse impact parameter significance and observing good agreement.
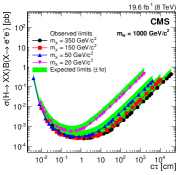
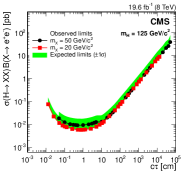
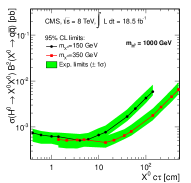
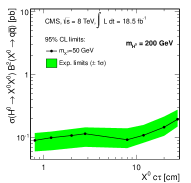
The principal systematic uncertainty is from the measurement of the tracking efficiency for displaced tracks. This is measured by using cosmic ray data to obtain a sample of displaced muons, searching for events where a muon is reconstructed in the muon chambers in both the upper and lower halves of CMS, and measuring the resulting efficiency to reconstruct a track in the central tracker. This is repeated with simulated cosmic ray events and the resulting difference is taken as the systematic. Other notable sources of uncertainty include the trigger efficiency measurement and the luminosity, with a total uncertainty of approximately 11%. The estimated background is zero events, and zero events are observed, so limits are set. Figure 2 shows some sample limits obtained in the XX model for two different values for a variety of different values and lifetimes.
3 Displaced jets
The displaced jets search looks for a similar class of models as the displaced leptons analysis, but instead considers the case where the long-lived neutral particle decays hadronically, rather than into leptons. Specifically, in the XX model, the X bosons then decay via X , and in the long-lived neutralino model, the neutralinos then decay via . As in the displaced lepton analysis, while these particular models predict two displaced vertices per event, the analysis only requires one reconstructed displaced vertex, for maximum sensitivity to a variety of models.
The data is collected online using a trigger which requires GeV, where is the scalar sum of all jet energies in event, and in addition at least two high-momentum displaced jets ( ). A jet is identified as displaced in the trigger if no more than two of the tracks associated to the jet have three-dimensional impact parameters less than 300 m, and no more than 15% of the total jet energy is carried by tracks with transverse impact parameters less than 500 m.
Simulated signal samples are generated using pythia to simulate XX, X decay for a variety of , X masses, and X particle lifetimes corresponding to a transverse decay length of 3 cm, 30 cm, and 300 cm in the laboratory frame. The model is also simulated using pythia for a variety of and masses, with the R-parity violating parameters chosen to give a transverse decay length of approximately 20 cm. The signal samples are then reweighted to simulate a variety of different lifetimes. The only significant background is from QCD multijet events, which are also simulated with pythia.
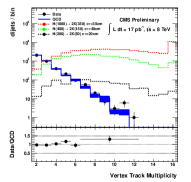
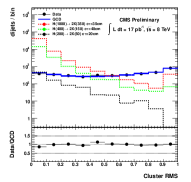
Candidate events are then selected by searching for two displaced jets with momentum . In addition, requirements are placed on the number of prompt tracks and fraction of energy carried by prompt tracks, where a prompt track here is defined as a track with a transverse impact parameter less than 500 m. The jets are then required to form a good-quality vertex. Finally, the tracks in the jet are hierarchically clustered and a likelihood discriminant is built for the jets based on the secondary vertex track multiplicity, the cluster root-mean-square (RMS), and the fraction of the secondary vertex tracks having a positive value of the impact parameter. Figure 3 shows the distribution of some of the variables going into the discriminant.
The background estimation is performed using an ABCDEFGH technique, with the eight regions defined by three selection criteria: the number of prompt tracks and energy fraction of the first jet, the number of prompt tracks and energy fraction of the second jet, and the likelihood discriminant. Using these, the amount of the background in the signal region H can be estimated as BCD/A2. The actual values of the selection criteria are optimized separately for models with lower decay lengths ( 20 cm) and higher ( 20 cm). Table 1 shows the final selection criteria and number of expected events.
| Number of prompt tracks for each jet | ||
|---|---|---|
| Prompt track energy fraction for each jet | ||
| Vertex/Cluster discriminant | ||
| Expected background |
The main source of systematic uncertainty on the signal efficiency is from the trigger efficiency, with a smaller contribution from the track finding efficiency, which is measured using a sample of mesons. The total systematic uncertainty is approximately %.
In the final results, two events are observed passing the low selection and one passing the high selection, both consistent with the expected background. Limits are thus set on the signal models; Figure 4 shows a sample of the limits for two different cases.
4 Displaced supersymmetry
The displaced SUSY search uses a different search technique to explore a region of parameter space not covered by previous searches at CMS. Specifically, it considers a SUSY model where long-lived stop quarks are pair-produced and then undergo an R-violating decay to a quark and a lepton (). The analysis searches for events in the specific channel where one of the leptons is an electron and the other a muon, thus substantially reducing the background from SM processes. The leptons are required to be displaced, but they are not required to form a vertex, allowing the search to remain sensitive to a variety of new physics scenarios.
The data is collected using a trigger requiring a muon with and a cluster in the electromagnetic calorimeter with transverse energy GeV. pythia 8 is used to generate simulated signal samples with . The principal background is from QCD interactions with heavy flavor (HF), which is modeled using data, with other contributions from and W/Z production, which are simulated.
Signal candidate events are identified by looking for an event with a muon and an electron of opposite charge, both of which are required to be isolated and have 25 GeV. The leptons are required to have a transverse impact parameter less than 2 cm, so that the tracking efficiency for the leptons remains high. Three exclusive signal regions are defined: signal region 3 (SR3) requires both leptons to have cm, signal region 2 (SR2) contains events not in SR3 where both leptons have cm, and signal region 1 (SR1) contains events not in either of the other two regions where both leptons have cm.
The estimate of background from QCD HF events in the signal region is obtained using an ABCD method with four regions, containing isolated/non-isolated leptons and same-sign/opposite-sign pairs. The estimated background from the other sources is estimated from simulation; in order to improve the statistical uncertainty of this estimation, as the number of simulated events passing all selection criteria may be very small, the efficiencies for the electron and muon to pass are calculated separately, and then multiplied to find the final estimate.
The most significant source of systematic uncertainty in the signal efficiency is due to the efficiency for reconstructing displaced tracks, which is taken as the same as that used in the displaced lepton analysis. The largest uncertainty in the background estimation is due to the limited sample size for measuring the QCD HF contribution and amounts to approximately 30%.
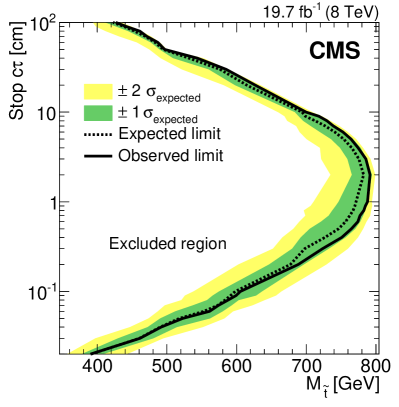
Table 2 shows the expected background and observed number of events in each search region. In all cases, the observations agree with the expected background, so limits are set on the stop quark mass as a function of lifetime. Figure 5 shows the resulting limits.
| Event source | SR1 | SR2 | SR3 |
|---|---|---|---|
| Other EW | |||
| Top quark | |||
| Z | |||
| HF | |||
| Total expected bkgd. | |||
| Observed |
5 Heavy stable charged particles (HSCP)
In contrast to the other searches discussed here, the HSCP analysis searches for long-lived particles which have a sufficiently long lifetime to leave the CMS detector before decaying. These particles can have a speed significantly less than , or a charge not equal to , or both. The analysis relies on using the time-of-flight (TOF) of the particles to the muon system and/or the rate of energy loss in the tracker for identification of HSCPs.
The search is performed in five separate channels, to account for the wide variety of types of HSCP possible.
-
1.
The “tracker+TOF” analysis searches for singly-charged HSCPs requiring both a track in the inner tracker and in the muon system.
-
2.
The “tracker-only” analysis searches for singly-charged HSCPs requiring only a track in the inner tracker, to account for the possibility of material interactions causing the HSCPs to become neutral in their passage through the detector.
-
3.
The “muon-only” analysis searches for singly-charged HSCPs requiring only a track in the muon system.
-
4.
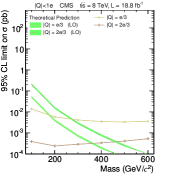
The “fractionally-charged” analysis searches for HSCPs with , requiring a track in the inner tracker with a smaller than that for a SM particle.
-
5.
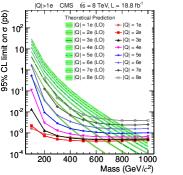
The “multiply-charged” analysis searches for HSCPs with , requiring tracks in the inner tracker and muon system with a much higher than for the singly-charged analysis.
The data is collected using three triggers: a muon trigger requiring a muon with , a missing trigger requiring MET GeV, and (for the muon analysis) a trigger requiring a muon in the muon system with and MET GeV. A preselection requiring some general measurements of track quality is then applied (or quality of the measurement in the muon system in the muon-only case). Signal samples are simulated using pythia for models where the HSCP is a long-lived gluino, stop, or stau for a range of masses. Background is estimated using a purely data-driven approach.
In the tracker+TOF analysis, three variables are used for the principal selection of candidate events: the track , , as determined from the time-of-flight to the muon system, and , a -based discriminant for separating SM particle tracks from those with higher . The other analyses use a subset of these criteria: the tracker-only analysis uses and , the muon-only analysis uses the in the muon system and , the fractionally-charged analysis uses and , where the prime indicates that the discriminant is now used to identify particles with lower , and the multiply-charged analysis uses and (as the measurement is not accurate for multiply-charged particles).
These selection criteria are also used to define regions used for an ABCD estimation of the background (or ABCDEFGH in the case of the tracker+TOF analysis, which has three criteria). The muon-only analysis also includes an additional estimate of the contribution due to cosmic rays which escape the cosmic ray veto included in the selection. The principal systematic uncertainties on the signal efficiency measurement are those on the trigger efficiency, the measurement of (for all except the muon-only measurement), and the track momentum reconstruction.
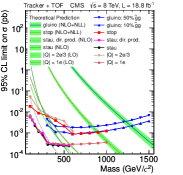
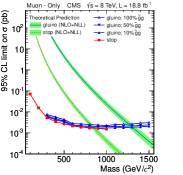
Table 3 shows the final selection, expected background and observed number of events in each analysis channel. In all cases, the observations agree with the expected background, so limits are set for the three signal models considered. Figure 6 shows some example results.
| Selection criteria | Number of events, GeV | |||||
| Mass | Pred. | Obs. | ||||
| () | () | |||||
| Tracker-only | ||||||
| Tracker+TOF | ||||||
| Muon-only | ||||||
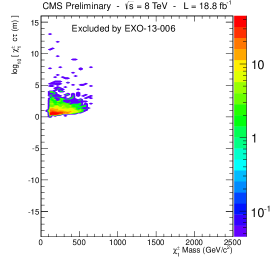
These results can also be reinterpreted in the context of other signal models. [10] This is performed by constructing efficiency maps for reconstructing these particles as a function of and in bins of . Then, one can calculate the efficiency for any given signal model simply by calculating the predicted kinematics for that model and applying the efficiency maps. Figure 7 shows this technique used to show points in the phase space of the phenomenological minimal supersymmetric model (pMSSM) that can be excluded by this analysis.
References
- [1] J. L. Hewett, B. Lillie, M. Masip, T. G. Rizzo, Signatures of long-lived gluinos in split supersymmetry, JHEP 09 (2004) 070. arXiv:hep-ph/0408248, doi:10.1088/1126-6708/2004/09/070.
- [2] R. Barbier, C. Berat, M. Besancon, M. Chemtob, A. Deandrea, et al., R-parity violating supersymmetry, Phys. Rept. 420 (2005) 1. arXiv:hep-ph/0406039, doi:10.1016/j.physrep.2005.08.006.
- [3] T. Han, Z. Si, K. M. Zurek, M. J. Strassler, Phenomenology of hidden valleys at hadron colliders, JHEP 07 (2008) 008. arXiv:0712.2041, doi:10.1088/1126-6708/2008/07/008.
- [4] L. Basso, A. Belyaev, S. Moretti, C. H. Shepherd-Themistocleous, Phenomenology of the minimal B-L extension of the standard model: Z’ and neutrinos, Phys. Rev. D 80 (2009) 055030. arXiv:0812.4313, doi:10.1103/PhysRevD.80.055030.
- [5] S. Chatrchyan, et al., The CMS experiment at the CERN LHC, JINST 3 (2008) S08004. doi:10.1088/1748-0221/3/08/S08004.
-
[6]
CMS Collaboration, Search for
long-lived particles decaying to final states that include dileptons, CMS
Physics Analysis Summary CMS-PAS-EXO-12-037 (in preparation for publication)
(2012).
URL https://cds.cern.ch/record/1669814 -
[7]
CMS Collaboration, Search for
long-lived neutral particles decaying to dijets, CMS Physics Analysis
Summary CMS-PAS-EXO-12-038 (in preparation for publication) (2012).
URL https://cds.cern.ch/record/1563591 - [8] V. Khachatryan, et al., Search for ”Displaced Supersymmetry” in events with an electron and a muon with large impact parameters, Submitted to PRL, arXiv:1409.4789.
- [9] S. Chatrchyan, et al., Searches for long-lived charged particles in pp collisions at =7 and 8 TeV, JHEP 1307 (2013) 122. arXiv:1305.0491, doi:10.1007/JHEP07(2013)122.
-
[10]
CMS Collaboration, Reinterpreting
the results of the search for long-lived charged particles in the pMSSM and
other BSM scenarios, CMS Physics Analysis Summary CMS-PAS-EXO-13-006
(2013).
URL https://cds.cern.ch/record/1648902