Update on HI data collection from GBT, Parkes and Arecibo telescopes for the Cosmic Flows project
Abstract
Cosmic Flows is an international multi-element project with the goal to map motions of galaxies in the Local Universe. Kinematic information from observations in the radio HI line and photometry at optical or near-infrared bands are acquired to derive the large majority of distances that are obtained through the luminosity-linewidth or Tully-Fisher relation. This paper gathers additional observational radio data, frequently unpublished, retrieved from the archives of Green Bank, Parkes and Arecibo telescopes. Extracted HI profiles are consistently processed to produce linewidth measurements. Our current ”All-Digital HI Catalog” contains a total of 20,343 HI spectra for 17,738 galaxies with 14,802 galaxies with accurate linewidth measurement useful for Tully-Fisher galaxy distances. This addition of 4,117 new measurements represents an augmentation of 34% compared to our last release.
keywords:
galaxies: distances and redshifts1 Introduction
In the cosmology community there is an increasing interest in measuring peculiar velocities of galaxies to map cosmic flows in the local volume (Courtois et al., 2013; Tully et al., 2014). Large coherent flows can provide a direct definition of the major structures formed by the total dark and luminous matter without the assumptions associated with interpretation of redshift surveys which are probing only the bright galaxy distribution. Currently data compilations for flow studies are numerically dominated by galaxy distances derived using HI radio detections and application of the Tully-Fisher relation (Tully et al., 2013). It is of interest that the recent 6dFGSv survey completed at the Schmidt telescope in Australia (Campbell et al., 2014) is now adding a similar number of Fundamental Plane galaxy distance estimates.
An associated use of peculiar velocities is for measurements of the local bulk flow and its physical interpretation toward understanding the global motion inferred by the CMB dipole (Watkins et al., 2009; Hoffman et al., 2014).
A third use for such surveys is to provide better constraints on parameters of cosmological interest than available from a survey of redshifts alone (Burkey & Taylor, 2004; Zaroubi & Branchini, 2005). Comparisons of the galaxy-galaxy, galaxy-velocity and velocity-velocity power spectra (Johnson et al., 2014) can define cosmological parameters such as the redshift space distortion and the correlation between galaxies and dark matter that would be degenerate when only the information provided by redshift surveys is used.
New peculiar velocity surveys will be quite competitive as cosmological probes (Koda et al., 2013). For example, peculiar velocity can improve the growth rate constraints by a factor two (and up to five) compared to density alone for surveys with galaxy number density of about .
Future peculiar velocity surveys such as TAIPAN (Colless et al., 2013), and the all-sky HI surveys, WALLABY and WNSHS (Koribalski, 2012), can measure the growth rate, to 3 per cent at z 0.025. Although the velocity subsample is about an order of magnitude smaller than the redshift sample from the same surveys, the added information improves constraints by 40 per cent compared to the same survey without velocity measurements.
Such measurements on large scales at z=0 can detect signatures of modified gravity or non-Gaussianity through a scale-dependent growth rate or galaxy bias.
The international project Cosmic Flows has accumulated data to derive accurate distances from both Tully-Fisher and Fundamental Plane techniques. Two catalogs of distances have already been produced (Tully et al., 2008, 2013) . For Tully-Fisher purposes, our group has been acquiring linewidths derived from HI 21 cm line profiles resulting from observations with the Green Bank Telescope at the US National Radio Astronomy Observatory and with the 13 channel Multibeam Receiver on the Australian 64m Parkes Telescope (Courtois et al., 2009, 2011b). Our observations are complemented by archival material from seven telescopes (GBT, NRAO 140-foot and 300-foot, Arecibo, Parkes, Nancay, Effelsberg). With the addition of the material to be discussed, now profiles and their interpretation are publicly available at the Extragalactic Distance Database111http://edd.ifa.hawaii.edu (EDD) (Tully et al., 2009) website in the ’All Digital HI’ catalog.
A high priority of the project is to increase the size of the sample by both going to larger redshifts and closer to the zone of avoidance while also homogenizing the distribution of distance measurements across the sky. This paper gathers original datasets retrieved directly at the archives of Green Bank, Parkes and Arecibo telescopes to complement observational programs dedicated to the Cosmic Flows projects. Extracted HI profiles are all consistently processed by our linewidth pipeline, which is now also used by the ASKAP-WALLABY collaboration and with the Effelsberg SDSS-Northern Sky Survey.
The first section of this paper presents the different samples of selected galaxies extracted from the archives. Subsequent sections discuss the data reductions and compilation of linewidths.
2 Data retrieval
2.1 Parkes 64m
A search for archival material since 2000 obtained with the Parkes-64m telescope led us to review observational programs listed in Table 1.
| P248 HIPASS/ZOA Staveley-Smith/Webster (2000) |
| P290 Redshift behind Milky Way - Saunders-Staveley-Smith (2000) |
| P307 Southern Galactic Plane Survey: Full Survey (Dickey) |
| P312 Narrow-band HI MB Survey of the Magellanic System (Haynes) |
| P335 High Velocity Resolution HI study of Nearby Galaxies (de Blok) |
| P347 HI around dwarf spheroidal galaxies (Carignan) |
| P352 Formation & Evolution in Groups - role of HI (Forbes) |
| P357 Northern extension to ZOA (Staveley-Smith) |
| P364 Seibel-Danziger TF of spirals containing SNIa (2005) |
| P370 The baryonic Tully-Fisher HIPASS sample (Gurovich) |
| P387 Completeness & reliability of HIPASS (Zwaan) |
| P389 Narrow band observations of HIPASS edge-on spirals (Meyer) |
| P432 HI content of early type galaxies (Garduno) |
| P467 GASS : Galactic all sky survey McClure-griffiths |
| P475 HI content of early-type dwarfs in nearby groups (Bouchard) |
| P561 Mapping Mass Local Universe (Hong, Masters) (2006-2007) |
Programs P364 (PI: Seibel & Danziger; 69 spectra retrieved) and P561 (Hong et al. (2013)) (139 spectra retrieved) produced a total of 142 measurements of linewidths that are now reduced as in Courtois et al. (2011b) and included in our catalog. The new material from Parkes can be identified in table 2 by ”archi12” (archive search 2012) in the Source of Information column.
2.2 GBT 110m
At GBT four observational programs were studied: GBT06A027, GBT06B021, GBT06C049, and GBT08B003 (see Masters et al. (2014)). These programs provide observations of 530 2MASS galaxy targets, from which 486 galaxies were cross-identified with a galaxy with a PGC number de Vaucouleurs et al. (1991), and 417 had sufficient signal to give an acceptable linewidth measurement. For 44 targets the signal to noise is insufficient for a galaxy distance measurement. The new material from the GBT archive can be identified in table 2 by ”archi12” (archive search 2012) in the Source of Information column.
2.3 Arecibo 300m
We are following-up on each data release from the extended extragalactic HI blind survey at Arecibo conducted by Martha Haynes and collaborators.
From 15,855 AGC numbers in Haynes et al. (2011), 11,941 were cross-identified with a galaxy with a PGC number.
Of these, 1,296 spectra were already analyzed by us following previous ALFALFA releases (1-2-3), leaving us with 9,274 new spectra to
inspect, which we carried out ordered by decreasing signal to noise ratio. The lower 5,000 spectra were left without analysis since the signal to noise was too low
for proper linewidth measurements. This study results in HI linewidth measurements of which 3,440 are associated with new galaxies to our catalog of HI measurements.
The new material from the Arecibo can be identified in table 2 by ”hgm2011” (Haynes, Giovanelli, Martin 2011) in the Source of Information column.
3 Data reduction
The new HI profiles were measured in the same consistent way using ”Wmean50”. An algorithm written by us in IDL, as described in Courtois et al. (2009, 2011b).
A parameter corresponds to the HI profile width at of the mean flux within the velocity range encompassing of the total HI flux. This window captures the rotation motions and measures only signal above the noise. In addition, was demonstrated to
provide robust linewidth measurements insensitive to profile shape such as single peak profiles or asymmetric double peak profiles.
Appropriate adjustments of to remove a slight relativistic broadening and a broadening because of finite spectral resolution are applied before publication of the results:
| (1) |
with galaxy heliocentric velocity , spectral resolution after smoothing and determined empirically. Broadening is statistically described with .
Linewidths are adjusted to twice maximum rotation velocities by a model based upon samples of global profiles and detailed rotation curves
(Tully & Fouque (1985), Verheijen (2001)):
| (2) |
with the subscript standing for the specifics of the linewidth estimate, with corresponding turbulent broadening , and a transition from boxcar to Gaussian intrinsic profiles characterized by . With the current linewidth convention, km s-1 and km s-1 give the best fit. The result, , is corrected for inclination with a division by sin where is the inclination from face-on. It is defined by the expression where is the ratio of minor to major axis and is taken as the reference for a galaxy viewed edge-on Holmberg (1958).
Arguments can be made for a more complex dependence of . Fortunately, the choice of has a negligible effect on distance measurements if one is consistent between measurements. For example, = 0.13 yields an inclination of instead of for resulting in a difference on the corrected linewidth of only 1.2%. As one progresses toward larger , the difference in assigned inclination is reduced but the correction is growing. The product is a roughly constant shift of 1.2% in the corrected linewidth at all inclinations . Handling every galaxy profile in the same manner will remove any significant effect on the measured distances (Tully & Pierce, 2000).
 |
 |
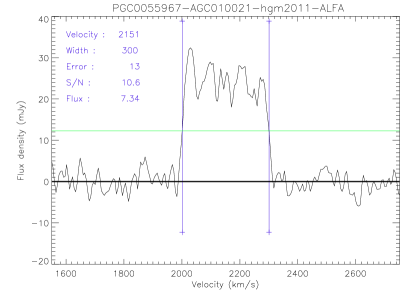 |
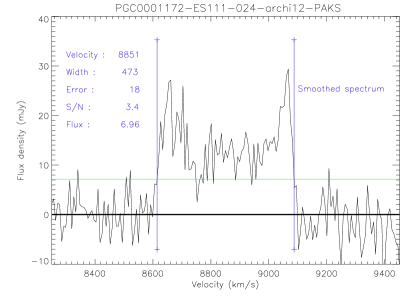
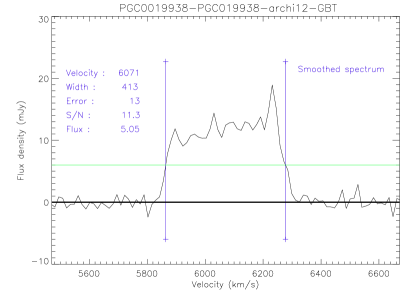
Width error estimates are based on the level of the signal, S, at 50% of mean flux over the noise, N, measured beyond the extremities of the signal. Only profiles with error estimates smaller than 20 km s-1 are retained for galaxy distance measurements. The corresponding flux per channel is . Examples of new profiles from Parkes, GBT and Arecibo can be seen in Fig. 1. All these 4,117 new HI material measurements are given in an online table with this article, with examples given in Table 2. In Table 2 the telescope acronym PAKS, GBT and ALFA stands respectively for Parkes, Green Bank and Arecibo telescopes.
4 Discussion and Conclusion
The Cosmic Flows project started in 2006 by compiling available digital HI spectra for Tully-Fisher measurements of galaxy distances. In Courtois et al. (2011b), the HI online catalog, built using ”Wmean50” code, contained 16,004 galaxies from which 11,074 had a linewidth of acceptable quality. Some of these profiles were re-reduced, for example, when a new HI profile coming from a different telescope gave a discordant value or, by contrast, was confirming a dubious old measurement. Also some profiles were scrutinized by eye at the time of matching those radio measurements to -Band, Spitzer or WISE photometry for the purpose of deriving a galaxy distance (Courtois et al. (2011a), Sorce et al. (2014), Neill et al. (2014)).
We thus provide with this article a fully updated catalog of 17,738 galaxies from which 14,802 have a high enough signal/noise for a distance measurement, an increase of a third over our previous data-release. Table 3 provides the first few lines of this updated catalog.
| PGC | Name | Source | Tel | Flux | Res | |||||||
|---|---|---|---|---|---|---|---|---|---|---|---|---|
| km/s | km/s | km/s | km/s | km/s | Jy.km/s | km/s | mJy | |||||
| 1172 | ESO111-024 | archi12 | PAKS | 8851 | 473 | 456 | 447 | 18 | 3.4 | 6.96 | 1.7 | 7.1 |
| 19938 | PGC019938 | archi12 | GBT | 6071 | 413 | 398 | 389 | 13 | 11.3 | 5.05 | 3.3 | 6.0 |
| 55967 | AGC010021 | hgm2011 | ALFA | 2151 | 300 | 295 | 286 | 13 | 10.6 | 7.34 | 5.2 | 12.3 |
| ……… |
| PGC | Other name | Flux | |||||
|---|---|---|---|---|---|---|---|
| km/s | km/s | km/s | Jy km/s | ||||
| 4 | AGC331060 | 4458 | 154 | 16 | 1 | 8.5 | 1.85 |
| 6 | AGC331061 | 6002 | 217 | 20 | 1 | 2.0 | 0.82 |
| 12 | PG0000012 | 6548 | 400 | 19 | 1 | 2.4 | 3.40 |
| 16 | PG0000016 | 5668 | 296 | 20 | 1 | 2.2 | 1.04 |
| 38 | UGC12893 | 1108 | 78 | 19 | 1 | 3.8 | 2.41 |
| 40 | PG0000040 | 7282 | 289 | 20 | 1 | 5.0 | 5.20 |
| ……… |
The importance of building large coherent datasets is also manifested in improvements in our comprehension of galaxy physics, for example with the new calibration of the baryonic Tully-Fisher relation (Zaritsky et al., 2014). In the near future, teams will be able to measure consistently with sufficient signal, linewidths of tens of thousands of galaxies by combining output from the multi-dish telescopes: southern ASKAP-Wallaby and northern HI Westerbork surveys WNSHS (Duffy et al. (2012)) .
These Tully-Fisher measurements are complemented by Fundamental Plane distances for elliptical galaxies (Springob et al. (2014)). In the future, the TAIPAN survey (Kuehn et al. (2014)), starting 2015 at the UK Schmidt telescope in Australia, will measure 500,000 redshifts to z 0.2 with r 17, K 14 and about 10,000 galaxy distances with typical errors of the order of 20.
Acknowledgements
We thank Bryson Lee for his work during a summer internship 2013 at the Institute for Astronomy. HC acknowledges support from the Lyon Institute of Origins under grant ANR-10-LABX-66 and from CNRS under PICS-06233. RBT acknowledges support from the US National Science Foundation award AST09-08846 and NASA award NNX12AE70G. We acknowledge the usage of the HyperLeda database (http://leda.univ-lyon1.fr). This research has made use of the NASA/IPAC Extragalactic Database (NED) which is operated by the Jet Propulsion Laboratory, California Institute of Technology, under contract with the National Aeronautics and Space Administration.
References
- Burkey & Taylor (2004) Burkey D., Taylor A. N., 2004, MNRAS, 347, 255
- Campbell et al. (2014) Campbell L. A. et al., 2014, ArXiv e-prints1406.4867
- Colless et al. (2013) Colless M., Beutler F., Blake C., 2013, in IAU Symposium, Vol. 289, IAU Symposium, de Grijs R., ed., pp. 319–322
- Courtois et al. (2013) Courtois H. M., Pomarède D., Tully R. B., Hoffman Y., Courtois D., 2013, AJ, 146, 69
- Courtois et al. (2009) Courtois H. M., Tully R. B., Fisher J. R., Bonhomme N., Zavodny M., Barnes A., 2009, AJ, 138, 1938
- Courtois et al. (2011a) Courtois H. M., Tully R. B., Héraudeau P., 2011a, MNRAS, 415, 1935
- Courtois et al. (2011b) Courtois H. M., Tully R. B., Makarov D. I., Mitronova S., Koribalski B., Karachentsev I. D., Fisher J. R., 2011b, MNRAS, 414, 2005
- de Vaucouleurs et al. (1991) de Vaucouleurs G., de Vaucouleurs A., Corwin, Jr. H. G., Buta R. J., Paturel G., Fouqué P., 1991, Third Reference Catalogue of Bright Galaxies. Volume I: Explanations and references. Volume II: Data for galaxies between 0h and 12h. Volume III: Data for galaxies between 12h and 24h.
- Duffy et al. (2012) Duffy A. R., Meyer M. J., Staveley-Smith L., Bernyk M., Croton D. J., Koribalski B. S., Gerstmann D., Westerlund S., 2012, MNRAS, 426, 3385
- Haynes et al. (2011) Haynes M. P. et al., 2011, AJ, 142, 170
- Hoffman et al. (2014) Hoffman Y., Courtois H. M., Tully R. B., 2014, MNRAS submitted
- Holmberg (1958) Holmberg E., 1958, Meddelanden fran Lunds Astronomiska Observatorium Serie II, 136, 1
- Hong et al. (2013) Hong T. et al., 2013, MNRAS, 432, 1178
- Johnson et al. (2014) Johnson A. et al., 2014, ArXiv e-prints 1404.3799
- Koda et al. (2013) Koda J. et al., 2013, ArXiv e-prints 1312.1022
- Koribalski (2012) Koribalski B. S., 2012, PASA, 29, 359
- Kuehn et al. (2014) Kuehn K. et al., 2014, in Society of Photo-Optical Instrumentation Engineers (SPIE) Conference Series, Vol. 9147, Society of Photo-Optical Instrumentation Engineers (SPIE) Conference Series, p. 10
- Masters et al. (2014) Masters K. L., Crook A., Hong T., Jarrett T. H., Koribalski B. S., Macri L., Springob C. M., Staveley-Smith L., 2014, MNRAS, 443, 1044
- Neill et al. (2014) Neill J. D., Seibert M., Tully R. B., Courtois H., Sorce J. G., Jarrett T. H., Scowcroft V., Masci F. J., 2014, ApJ, 792, 129
- Sorce et al. (2014) Sorce J. G., Tully R. B., Courtois H. M., Jarrett T. H., Neill J. D., Shaya E. J., 2014, MNRAS, 444, 527
- Springob et al. (2014) Springob C. M. et al., 2014, MNRAS, 445, 2677
- Tully et al. (2014) Tully R. B., Courtois H., Hoffman Y., Pomarède D., 2014, Nature in press
- Tully et al. (2013) Tully R. B. et al., 2013, AJ, 146, 86
- Tully & Fouque (1985) Tully R. B., Fouque P., 1985, ApJS, 58, 67
- Tully & Pierce (2000) Tully R. B., Pierce M. J., 2000, ApJ, 533, 744
- Tully et al. (2009) Tully R. B., Rizzi L., Shaya E. J., Courtois H. M., Makarov D. I., Jacobs B. A., 2009, AJ, 138, 323
- Tully et al. (2008) Tully R. B., Shaya E. J., Karachentsev I. D., Courtois H. M., Kocevski D. D., Rizzi L., Peel A., 2008, ApJ, 676, 184
- Verheijen (2001) Verheijen M. A. W., 2001, ApJ, 563, 694
- Watkins et al. (2009) Watkins R., Feldman H. A., Hudson M. J., 2009, MNRAS, 392, 743
- Zaritsky et al. (2014) Zaritsky D. et al., 2014, AJ, 147, 134
- Zaroubi & Branchini (2005) Zaroubi S., Branchini E., 2005, MNRAS, 357, 527