Electronic structure and polaronic charge distributions of Fe vacancy clusters in Fe1-xO
Abstract
We perform a detailed study of the electronic structure of Fe1-xO at moderate values of . Our results evidence that the Fe vacancies introduce significant local modifications of the structural, electronic and magnetic features, that serve to explain the origin of the measured dependencies of the physical properties on . The final properties are determined by a complex interplay of the charge demand from O, the magnetic interactions, and the charge order at the Fe sublattice. Furthermore, polaronic distributions of charge resembling those at magnetite, Fe3O4, emerge for the most stable defect structures. This defines a unique scenario to understand the nature of the short-range correlations in Fe3O4, and unveils their intimate connection to the long-range charge order developed below the Verwey transition temperature.
pacs:
75.25.Dk,61.72.-y,71.20.-b,91.60.EdI Introduction
FeO belongs to the magnetic transition metal monoxides (TMO) series, together with MnO, CoO and NiO. They share similar properties, such as a cubic NaCl crystal lattice, large insulating gaps, or antiferromagnetism of AF-II type, where adjacent ferromagnetic (111) cation planes couple antiferromagnetically. In spite of their apparent simplicity, the TMO exhibit intricate electronic interactions, and have been considered as prototypes to explore electronic correlations in the verge between Mott-Hubbard and charge transfer insulators Zaanen-1985 . This has motivated a large number of calculations of their properties within ab initio frameworks Anisimov-1991 ; Dane-2009 ; Thunstrom-2012 ; Rodl-2009 . Furthermore, all of them show a distortion of the cubic symmetry below the Néel temperature (TN) Willis-1953 ; Roth-1958 , which has been unequivocally related to the magnetic exchange coupling constants Kant-2012 . In the particular case of FeO, the distortion is rhombohedral, and consists in a slight elongation along the direction Tombs-1950 . The local magnetic moments align parallel to this direction Shull-1951 , though a weak perpendicular component compatible with a departure from collinear spin order has been solved Fjellvag-1996 ; Saines-2013 .
Within the TMO series, FeO is singular in that it shows a large deficiency in Fe ranging from 5 to (Fe1-xO, with ) at ambient conditions. The stoichiometric form is stable at the extreme pressures and temperatures of the Earth’s lower mantle, one of whose major constituents are solid solutions of the mineral form of FeO, wüstite. In fact, FeO is under scrutiny in the fields of geophysics and paleomagnetism, where large efforts are devoted to understand its complex transitions at high pressures and to determine the distribution of Fe vacancies (VFe) in the lattice Fei-1994 ; Ohta-2012 ; Hazen-1984 . Though unstable FeO decomposes in Fe3O4 and Fe below 570∘C, at room temperature the reaction is slow Willis-1953 , allowing to prepare Fe1-xO by rapid quenching. The exact composition and local order of the defects is determined in a complex way both by the preparation conditions and the history of the sample, and furthermore, may evolve with time Hazen-1984 . However, it has been possible to identify trends revealing the influence of VFe on the physical properties of Fe1-xO. For example, an empirical linear relation between the unit cell parameter and has been determined McCammon-1984 ; Dimitrov-2000 . The magnetically induced rhombohedral distortion is also known to decrease as the Fe content decreases Willis-1953 ; Fjellvag-1996 , and similarly the value of TN and the specific heat anomaly at the transition depend on Schrettle-2012 . The modification of the heat capacity across TN evidences changes in the nature of the magnetic transition, with a much stronger cooperative character in FeO than in non-stoichiometric samples Fjellvag-1996 . Also the conductivity and cation self-diffusion have been observed to depend on , and the carrier type changes from to for Johnson-1969 .
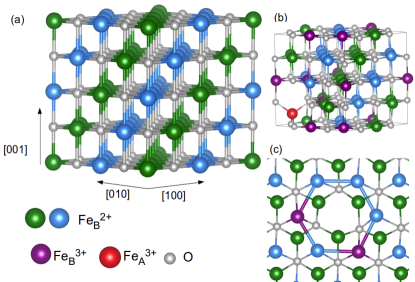
These dependencies and the high values of admitted by wüstite suggest that Fe vacancies arrange forming specific defect structures. Their identification has been a very active field of research since the pioneering neutron diffraction study of Roth Roth-1960 , and though it must be ultimately admitted that different local structures and long-range orders may exist depending on the history of a sample Hazen-1984 , it seems clear that there is a relation between the VFe and the emergence of interstitial Fe3+ cations Cheetham-1971 ; Press-1987 . Simple charge compensating arguments propose that creating an iron vacancy generates two octahedral Fe3+, as has been proved from first-principles calculations of isolated VFe Wdowik-2013 . However, both diffraction experiments and atomistic calculations agree that the minimal defect cluster is formed by 4 VFe surrounding a tetrahedral Fe3+, the so-called 4:1 cluster Koch-1969 ; Catlow-1975 (see figure 1). The aggregation of these minimal units as increases may proceed in several ways, by face-, edge- or corner-sharing of neighbouring 4:1 clusters. Though it is believed that the ratio between VFe and interstitials increases with temperature and at lower defect concentrations Press-1987 , different types of aggregates may coexist Lebreton-1983 , and it is not even clear if spinel-type local structures are favored over more compact aggregations Minervini-1999 .
Understanding the fundamental properties of defective Fe1-xO at the atomic scale seems essential to determine the origin of the observed dependencies of the physical properties on . Surprisingly, however, detailed studies of the influence of VFe on the electronic structure are scarce, and to the best of our knowledge, only isolated vacancies have been considered with ab initio methods Wdowik-2013 . Here, we perform first-principles calculations of Fe1-xO to determine the stability and electronic properties of 4:1 clusters, comparing them to those of isolated VFe and stoichiometric FeO. Furthermore, as the 4:1 cluster is a basic unit for the development of spinel structures at the FeO lattice, our study provides a bridge to explore the evolution from Fe1-xO to Fe3O4, and the influence of the lattice symmetry on the local order. As we will show, this allows to extract interesting conclusions about the nature of short-range charge correlations in Fe3O4.
The paper is organized as follows. After describing the methodology, we provide our results for the electronic properties of FeO and isolated Fe vacancies in Fe0.97O. Then, we describe unit cells with 3 VFe, corresponding to a composition Fe0.906O, comparing two different situations: disperse VFe and 4:1 clusters. In the last section we explore the similitudes between the charge distributions of Fe1-xO and Fe3O4 based on our previous calculations of magnetite Bernal-2014 .
II Computational method
We have performed ab initio calculations within density functional theory (DFT) as implemented in the VASP code vasp1 ; vasp2 , using the projector-augmented wave (PAW) method for the treatment of the core electrons paw1 ; paw2 and the Perdew-Burke-Ernzerhof parametrization of the generalized gradient approximation modified for solids (PBEsol) for the exchange-correlation functional pbesol . A kinetic energy cutoff of 400 eV has been used, and all symmetrizations have been removed. To take into account the important electronic correlations in Fe oxides, we have included an on-site Coulomb repulsion term U following the Dudarev approach Dudarev-1998 . Our choice of an effective eV is based on the recovery of the experimental values of both the equilibrium NaCl lattice parameter ( ) and the insulating gap ( eV) for stoichiometric FeO, while preserving the overlap and orbital order of the oxygen band and the cation states Fujimori-1987 ; Rodl-2009 . A similar procedure applied to Fe3O4 led us to the same choice of U in a previous study Bernal-topreview , which eases comparison of the results corresponding to both materials.
Stoichiometric FeO can be modelled with a minimal unit cell of 4 atoms under AF-II order. Here we have used a larger cubic unit cell of 64 atoms that allows to consider isolated 4:1 clusters as well as up to 3 separated VFe. A sketch of the cubic unit cell is represented in the left panel of figure 1, where blue and green layers denote Fe atoms with opposite spin orientation. Full relaxation of the lattice vectors and atomic positions has been performed until the forces on all atoms were lower than 0.01 eV/Å. The Brillouin Zone (BZ) has been sampled using the Monhorst-Pack method, with partitions of during relaxations and for static calculations. This scheme guarantees a convergence in the total energy of 1 meV/atom. When modelling FeO with the reduced cell of 4 atoms, a sampling of the BZ of has been used.
The energy cost of creating a defect has been estimated as VandeWalle-2004 :
| (1) |
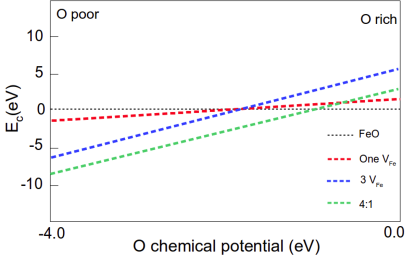
where refers to the total energy of the supercell with (Fe1-xO) or without (FeO) defects, to the number of VFe introduced in the supercell, and to the chemical potential of Fe. The limits of have been obtained from calculations of the total energy of bcc Fe and the O2 molecule, taking into account the relation between the Gibbs free energies of formation of the oxide and the stable forms of its elemental constituents, and the influence of U Kresse-2014 . This allows to express as a function of the O chemical potential , where we have set the zero reference state to .
III Stoichiometric FeO
As mentioned in the Introduction, the electronic structure of FeO has been widely studied previously under diverse approaches, and the system has been often used as a test-bed for models aiming to capture correlation effects Rodl-2009 ; Mazin-1997 . Our description of stoichiometric FeO using the reduced unit cell of 4 atoms is in excellent agreement with previous calculations. When the large cube of 64 atoms is employed, the global features of the ground state do not vary, leading to an identical value of the cubic lattice parameter , similar electronic properties, and an AF-II order of the local Fe magnetic moments (3.7 ) that induces a comparable rhombohedral distortion. However, under the reduced symmetry of this large unit cell a significant deformation of the O fcc sublattice manifests, enhancing the dispersion of the atomically resolved properties, such as local charges and interatomic distances. The structural deformation already exists in the minimum unit cell of 4 atoms, though there it does not alter the symmetrical distribution of the Bader charges. The situation is reminiscent to that occuring in magnetite, as a hint of the close relation between the properties of both Fe oxides. The distortion of the O sublattice lowers the total energy by 21 meV/f.u., and is related to the onset of magnetism: it does not emerge in a non-magnetic calculation, where also the elongation along is lost.
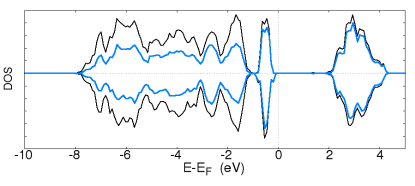
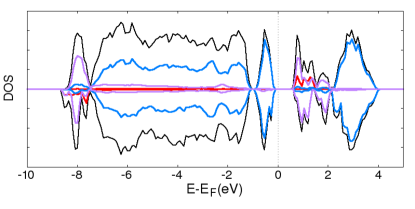
The total density of states (DOS) of the supercell and its projection on the Fe atoms are in figure 2. Although our description of FeO corresponds to a Mott insulator, there is a strong hybridization between O and Fe states throughout the valence band (VB), with a non-negligible contribution of O at the VB edge. The orbital projection on the Fe sites shows the expected separation between and states linked to the local octahedral coordination. Minor variations in the DOS are found at different sites, as a consequence of the asymmetry in the O sublattice, but the dispersion of the local charges is moderate, as evidenced in table 1. The first column of the table provides the mean values and the corresponding dispersions of the Bader charge (QB) and magnetic moment of O and Fe. Fe atoms are labelled as Fe by analogy to Fe3O4, as justified in the next section. The ionic nature of the Fe-O bonds manifests in the large charge transfer from Fe to O. On the other hand, the perfect compensation of the Fe magnetic moments with opposite orientations, already reflected in the DOS, leads to the negligible magnetization at the O sites.
| QB | FeO | Fe0.97O | 3 VFe | 4:1 |
| Fe | ||||
| Fe | ||||
| Fe | ||||
| O | ||||
| FeO | Fe0.97O | 3 VFe | 4:1 | |
| Fe | ||||
| Fe | ||||
| Fe | ||||
| O |
| d(Fe-Fe), | FeO | Fe0.97O | 3 VFe | 4:1 |
|---|---|---|---|---|
| d∥ | ||||
| d⟂ |
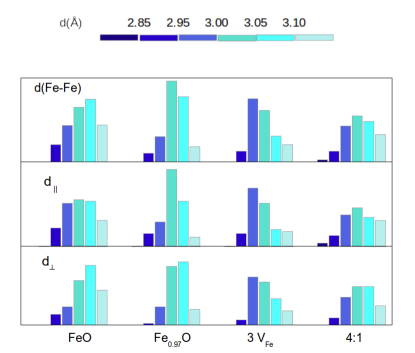
The structural properties are summarized in tables 2 and 3, and figure 3. The rhombohedral distortion induced by the AF order stretches the cubic cell along the axis perpendicular to the ferromagnetic (FM) Fe sheets, that we define as the direction. A measure of this distortion is provided by the ratio of the mean interatomic distances between Fe neighbors at the same FM layer (d∥) and at adjacent layers (d⟂), shown in the first column of table 2. It is also evidenced from the more detailed distribution of values of d∥ and d⟂ in figure 3, peaked to lower values for d∥ than for d⟂. A similar situation arises at the O sublattice, with identical mean values of d∥ and d⟂, but larger dispersions reflecting the additional deformation of the sublattice. In turn, this causes significant variations of the Fe-O bond lengths, d(Fe-O), as reflected in the first column of table 3. However, the d(Fe-O) do not seem to follow any pattern with respect to the lattice or the magnetic order. The noticeable distortion of the FeO lattice is closely linked to the competition between the different superexchange paths. The magnetic order of the system is known to be dominated by the exchange interactions between second nearest neighbors (), due to frustration of the first nearest neighbors interactions () Roth-1958 . Oppositely, the rhombohedral distortion of the unit cell is caused by spin-phonon couplings governed by the Kant-2012 . The additional deformation of the O sublattice seems to be a mechanism to preserve maximization of the under the presence of the magnetically induced phonon splitting.
| d(Fe-O), | FeO | Fe0.97O | 3 VFe | 4:1 |
|---|---|---|---|---|
| Fe | ||||
| Fe | ||||
| Fe |
IV Isolated iron vacancy: Fe0.97O
We have first considered the effect of creating one Fe vacancy in the cube of 64 atoms, which corresponds to . This situation is outside the experimental range of concentrations found for wüstite, as we reproduce from our estimations of shown in figure 4. Its interest rather relies on the ability to isolate the features introduced by non-interacting vacancies.
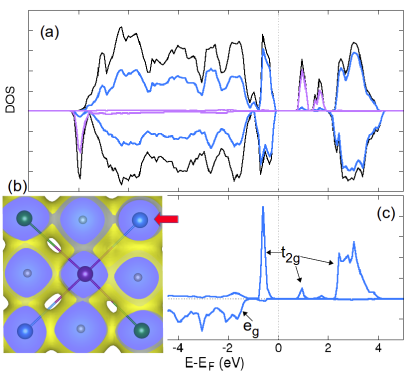
In figure 5 we show the total DOS of the supercell, together with the projections on the two different types of Fe that can be distinguished. The corresponding mean values and dispersions of the Bader charges and magnetic moments are in the second column of table 1. The emergence of Fe atoms that share more charge with O is evident. As mentioned in the introduction, creation of an Fe vacancy is expected to induce a change of valence on two Fe cations, that should act as Fe3+. We label them Fe by analogy to magnetite: in Fe3O4, Fe cations order in octahedral (B) and tetrahedral (A) sublattices, and at low temperatures a charge disproportionation at sublattice B leads to Fe atoms acting either with valence (QB=6.37) or (QB=6.64) Bernal-2014 ; Verwey . Here, the Fe sites are among the first neighbors of the Fe vacancy, and belong to the same FM layer (see figure 1c). They introduce an incomplete charge compensation, leading to the slight reduction of the mean QB of O with respect to FeO. In general, the 6 O atoms which are nearest neighbours (n.n.) to the vacancy show a lower charge than those farther from it, but the charge distribution is complex, and some O atoms far from the vacancy site hold similar low values of QB.
As evidenced in the table, accompanying the difference in QB there is an important enhancement of the magnetic moment at the Fe sites, that also causes a slight increase of the induced O magnetization. This leads to the partial compensation of the AF coupling at the supercell, unbalanced by the VFe. However, a net magnetic moment of 2 yet remains, that together with the important reduction of the insulating gap to around 0.8 eV represent the main differences with respect to stoichiometric FeO. The new states at the gap are precisely those coming from the Fe states, that provide also the additional features at the bottom of the conduction band (CB). But the global electronic structure of the FeO lattice does not vary significantly, and most modifications are localized around the vacancy site.
The presence of the VFe introduces also changes in the structure. The second column of table 2 summarizes the mean values of the interatomic distances between Fe neighbors, d(Fe-Fe), that together with the distribution of their values in figure 3 provide a measure of the rhombohedral distortion. As compared to stoichiometric FeO, there is a slight reduction of the cell volume and a tendency to shorten both d∥ and d⟂, better evidenced in figure 3. But the elongation along is preserved for the low concentration of defects considered here. The relevant structural changes occur in the neighborhood of the vacancy. On one hand, they manifest in the d(Fe-O), compiled in the second column of table 3, which vary depending on the valence of Fe. The O atoms tend to approach the Fe sites, while the average distance to Fe remains similar to the stoichiometric case. The noticeable dispersion of the values reflects that a significant distortion of the fcc O sublattice as obtained for FeO still exists. On the other hand, there is an important rearrangement of the Fe positions in the vicinity of the VFe. Due to the fcc symmetry of the Fe sublattice, each vacancy has 6 Fe n.n. at the (111) plane, 3 n.n. above and 3 n.n. below. There is a tendency to fill the void created by the vacancy, which causes a slight shrinkage of the hexagon defined by its in-plane Fe neighbors (see figure 1c) and also of the triangles defined by its upper and lower n.n., which furthermore reduce their interlayer distances to the plane of the vacancy. We find that the d(Fe-Fe) of stoichiometric FeO are gradually restored from the second n.n. to VFe. This was not observed in previous calculations Wdowik-2013 , probably linked to an incomplete relaxation of the cubic symmetry.
Though the d(Fe-Fe) do not show the clear dependency with the Fe valence observed for d(Fe-O), some of the Fe exhibit a singular relation to the neighboring Fe, as indicated in the lower panels of figure 5. Panel (b) represents the three dimensional real space distribution of the charge density in the (010) plane defined by an Fe (central atom) and some of its Fe neighbors (corner atoms). It is evident from the figure that there is a charge accumulation at one of the Fe-Fe connecting lines (CLs). The d(Fe-Fe) defined by this CL is considerably shortened to 2.88 , to be compared with values over 3 for the rest of Fe-Fe pairs in the figure. The charge accumulation at this short CL is also reflected in the DOS at figure 5 (c), that shows the states of the corresponding Fe overlapping those of Fe at the FeO gap. Analysis of the orbital character of these states indicates that they are formed by t2g orbitals lying along the CL. The combined presence of all these features is a signature of the short-range charge correlation units in magnetite Bernal-2014 , the trimerons, formed by groups of three neighboring Fe-Fe-Fe sites with shortened interatomic distances and polaronic charge sharing Attfield-nature ; Piekarz-2014 . We will discuss these aspects in more detail in the last section.
V Fe0.906O: Isolated vacancies
When 3 VFe are placed in the cube of 64 atoms, the maximum separation between them (around 6 ) can be achieved under two magnetically inequivalent configurations. The situation is better visualized grouping all inequivalent Fe positions of the cube in two adjacent (111) planes of opposite spin orientation, as shown in figure 6. On the left side (case C1), two VFe lie on the same plane (blue) and the other on the adjacent one (green), resulting in one uncompensated Fe magnetic moment. On the right (case C2), all the vacancies lie on the same (111) plane, thus corresponding to removal of 3 Fe atoms with parallel spins.
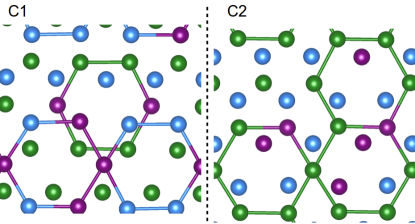
Surprisingly, in spite of the large difference in their net magnetizations (2 for C1, 14 for C2), the total energies of both configurations are very close, the case C1 being favored by only 47 meV (less than 1 meV/atom). This tendency manifests also in the similarity of their global structural and electronic properties, and eventhough we will show that there are local differences between both cases, their resemblance is a hint of the non-interacting nature of the 3 VFe. This serves to put limits on the distance for Fe vacancies to interact. On the other hand, regarding figure 4, this composition is more stable than FeO at low O2 pressures, and also more stable than Fe0.97O at the conditions where FeO is unstable, evidencing a tendency to cluster the defects.
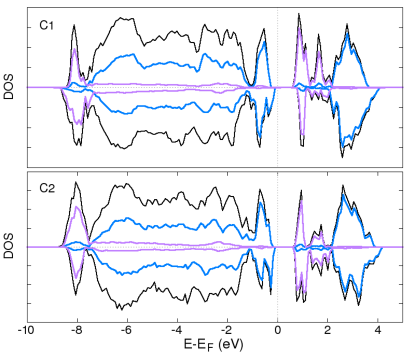
The DOS of the supercells corresponding to C1 and C2 is shown in figure 7, together with the projections on the different types of cations. As occured for one isolated vacancy, in both configurations two Fe per vacancy emerge with enhanced valence. Again they introduce new states at the bottom CB and at the insulating gap, reducing it to eV. Comparing to the DOS of Fe0.97O in figure 5, the larger number of Fe sites introduces additional states, that moreover appear at both spin orientations. In general all features of the DOS are broader, associated to the more defective structures.
The mean values of the charges and magnetic moments are summarized in the third column of table 1. They correspond to C1, but similar values are obtained for C2. As compared to Fe0.97O, the increased number of VFe enhances the demand of charge from O, resulting in reduced Bader charges of both the Fe and O atoms. Also the Fe are not only first neighbors to one VFe, but sometimes to two of them, which reflects in their reduced QB. As the Fe atoms emerge to compensate the loss of charge donors introduced by the vacancies, not all of them lie on the same (111) plane of the closest VFe. Their enhanced magnetic moments thus reinforce the spin imbalance, an effect more pronounced in C2: while in C1 there is an equal number of Fe sites with each spin orientation, in C2 two Fe are in the plane of the VFe, and four in the adjacent one. This combined to the small relative energy difference between C1 and C2 supports the interpretation of magnetic measurements, that assign to the defects local ferrimagnetic areas which are disordered with respect to each other and also with respect to the overall AF order Fjellvag-1996 ; Battle-1979 .
In the third column of tables 2 and 3 we show the mean values of the d(Fe-Fe) and d(Fe-O) for configuration C1. Again these global values, together with the unit cell vectors and cell volume, are very similar in C1 and C2. The volume contraction with respect to FeO is 3 times that found for Fe0.97O, corresponding to a cubic lattice parameter of 4.26 . The average values of d(Fe-O) are also slightly shorter than for Fe0.97O, reflecting the large demand of charge from O due to the increased number of VFe. Furthermore, there is a weakening of the rhombohedral distortion, in agreement with the experimental evidence Willis-1953 ; Fjellvag-1996 . This is better seen in the distribution of values of d(Fe-Fe) in figure 3, very similar for d∥ and d⟂. The large number of vacancies and the tendency of the Fe atoms to fill their voids shifts all distances to shorter values. Another important effect is that some pairs of Fe are now first neighbors, inducing an accumulation of the valence charge in the interstitial region between them. This tends to inhibit the polaronic charge sharing between Fe-Fe pairs of shortened d(Fe-Fe) observed in the dilute limit . Regarding figure 7, here there are still Fe states that overlap those of Fe at the FeO gap. They are always linked to values of d(Fe-Fe) below 2.97 and to the existence of orbital order along the corresponding CL. However, no charge accumulation occurs at the interstitital region between Fe and Fe. The additional requirement for polaronic charge sharing is the shortening of the Fe-Fe interatomic distance below 2.89 , that is strongly suppressed by the accumulation of close Fe sites.
In summary, the high concentration of VFe in Fe0.906O starts to break the homogeneity of the FeO matrix. Though each vacancy only modifies the local area surrounding it, and the interaction between vacancies is weak, the structure of FeO cannot accommodate such a large number of defects without altering its properties. This has important consequences for the charge distribution.
VI Fe0.906O: 4:1 clusters
The composition Fe0.906O can also be achieved by grouping the VFe in defect clusters. The most compact one is the 4:1 cluster, where we introduce an interstitial Fe at a tetrahedral coordination site, FeA, and surround it by 4 VFe. As one of the vacancy sites at the octahedral Fe sublattice is balanced by the creation of FeA, the stoichiometry corresponds to the effective introduction of 3 VFe, similarly to the case studied above. The 4:1 cluster is expected to be the most stable configuration for moderate values of Minervini-1999 , and actually we obtain that it lowers the energy by 22 meV/atom as compared to the supercell with 3 isolated VFe. In turn, this extends the range of stability of defective Fe1-xO over FeO to higher O pressures, as shown in figure 4.
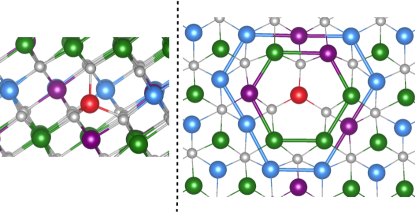
Figure 8 represents the 4:1 cluster embedded in our supercell, together with a top view of the (111) Fe layers around FeA, identifying the vacancy sites. It is evident from the figure that three out of the four VFe are first n.n. lying on the same (111) plane.
Since the spin of FeA can be parallel or antiparallel to the layer with more vacancies, two magnetic configurations can be envisaged, with a very different uncompensated magnetization. As occured for 3 isolated VFe, the corresponding ground states show similar global properties except for a very different net magnetic moment, of either 4 or 14 . The relative energy difference between both configurations is considerably higher than between C1 and C2, but still it is only moderate, of 5 meV/atom, and favors the situation with the lower magnetization. In fact most differences are similar to those discussed for C1 and C2, so in the following we will just describe the features of the most stable case.
The resulting DOS of the supercell and the projections on the different Fe sites are shown in figure 9, while the mean values of the QB and magnetic moments are summarized in the last column of Table 1. The charge defect introduced by the 3 effective VFe would require 6 octahedral Fe atoms. However, as FeA also acts with valence, only 5 Fe atoms emerge. All of them are first n.n. to two VFe simultaneously, and they are also among the closest octahedral Fe neighbors of FeA, as shown in figure 8. The tetrahedral atom introduces additional states at the bottom conduction and valence bands, that overlap the contribution from Fe, and the resulting gap is eV. Compared to cases C1 or C2, the distinct features corresponding to each type of Fe site in the DOS are better resolved, which evidences a higher degree of order in the structure. For example, the peaks associated to the and states of Fe at the top VB do not overlap, similarly to stoichiometric FeO, and opposite to all previous defect structures considered above. The higher localization of the defects has also consequences in the distribution of the O charges, which are lower (around 7.18) for the atoms bonded to FeA, and higher far from the defect, where they reach values similar to stoichiometric FeO. The result is that the mean QB at the O sublattice is enhanced over the configuration corresponding to 3 isolated VFe. This effectiveness of the 4:1 cluster to globally compensate the loss of charge introduced by the VFe seems to be at the origin of its higher stability.
The magnetic moments of Fe and Fe show less differences than their QB, and the induced magnetization at the O sublattice is similar for all distributions of VFe in Fe0.906O. On the other hand, the formation of the clusters leads to the inhomogeneous distribution of the magnetic moments, with a higher magnetization in the region around the defects. This is in excellent agreement with previous experiments Dimitrov-1999 , where high magnetization and low temperature coercivity have been linked to the presence of large clusters based on stacking spinel-like defects.
The mean values and dispersions of d(Fe-Fe) and d(Fe-O) are summarized in the last columns of tables 2 and 3. The d(Fe-O) for the octahedral Fe sites do not differ substantially from the case corresponding to 3 isolated VFe, but there is an important shortening of the bond lengths corresponding to FeA. The values are close to those found at the tetrahedral sublattice in magnetite Bernal-2014 . Oppositely, important differences can be found in the d(Fe-Fe) depending on the arrangement of the VFe. As evidenced in figure 3, the range of interatomic distances is wider in the presence of the 4:1 cluster, and their distribution closer to stoichiometric FeO than for any other defect structure in the figure. The largest differences to the stoichiometric case come from the increased similitude between d∥ and d⟂, and from the global shortening of the d(Fe-Fe), including the emergence of particularly low values below 2.85 . On one hand, this reflects the volume contraction to fill the voids left by the vacancies. On the other, the decrease of the magnetically induced rhombohedral distortion upon decrease of the Fe content, in good agreement with the experimental evidence. But in general, the FeO matrix tends to recover its structure far from the VFe, while the defect cluster introduces larger local modifications than the isolated vacancies. Furthermore, the shortest d(Fe-Fe) are signatures of the emergence of local polaronic charge distributions, as will be demonstrated in the next section.
VII Charge density distribution. Comparison to Fe3O4.
Magnetite, Fe3O4, is one of the stable forms of binary Fe oxides. It is a material of interest for magnetic applications, due to its unique properties of large magnetization, high magnetic ordering temperature and half-metallicity. Furthermore, at TV=120 K it undergoes a largely studied metal-insulator transition, the Verwey transition Verwey , where the interplay between structure and charge-order (CO) is still under debate Walz-2002 ; Garcia-2004 . At ambient conditions the crystal structure is the cubic inverse spinel, that below TV transforms into a large monoclinic unit cell accompanied by a drop of the conductivity and the emergence of CO at the octahedral Fe sublattice. Understanding the features of the CO in Fe3O4 has proved to be a complex task Leonov-2004 ; Piekarz-2007 ; Garcia-2009 ; Weng-2012 , and the survivance of short-range correlations above TV linked to the long-range CO has been recently demonstrated Piekarz-2014 . The local order generated by the 4:1 clusters in Fe1-xO is a basic building block for the development of a spinel-like structure similar to that of magnetite. Moreover, the local properties around the defect are very similar to those of Fe3O4. Here we will explore how these similarities manifest also in the charge distribution, converting Fe1-xO in a unique material to understand the features of the CO of magnetite.
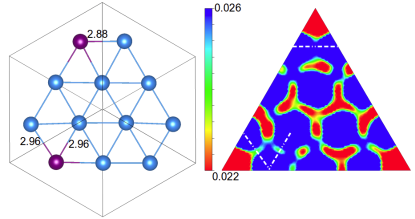
In section 4 we showed that a polaronic charge distribution reminiscent of Fe3O4 already emerges in the dilute limit represented by Fe0.97O. Figure 5b identifies the existence of charge accumulation along certain shortened CLs between Fe-Fe neighbors. An alternative view of this effect is provided in figure 10, where a two-dimensional cut of the charge density (CD) at the (111) plane containing the vacancy is presented. In order to have a reference of the atomic centres, a sketch of the corresponding atomic positions is also shown, with vacancies lying at the corners of the triangle. The full CD spans a range between 1.285 and 0.001 , while the range of interest for interatomic charge modulations at the (111) Fe planes is much reduced, as indicated by the color scale of the figure supplement . The maximum CD corresponds to the tails of the core charge, that decay very fast away from the atomic centres toward the interstitial regions. Usually there is a depression of the CD at the middle of the CL between Fe neighbors. As shown by the dashed lines in the figure, it tends to be less pronounced around the Fe sites, and disappears only at the shortened Fe-Fe CLs corresponding to a d(Fe-Fe)=2.88 , formed by overlapping t2g Fe and Fe states directed along the CL.
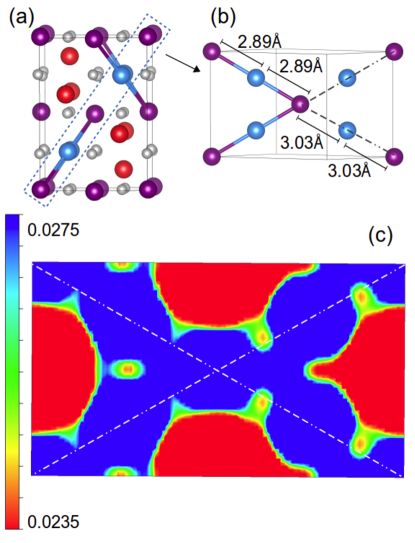
The similitude to magnetite can be appreciated in figure 11, that shows the distribution of trimerons in a unit cell of Fe3O4 together with the CD at a plane containing them. Notice that in magnetite the FeB sublattice is ferromagnetic, and antiferromagnetically coupled to the FeA sublattice. As explained in section 4, trimerons are linear chains of Fe-Fe-Fe n.n. with shortened interatomic distances (2.89 vs. 3.03 ) Bernal-2014 . It is evident from the figure that the trimerons inhibit the depression of the CD at the middle of the CL between adjacent Fe-Fe sites. The existence of two different FeA and FeB sublattices modifies the charge transfer with respect to wüstite, shifting the CD scale to slightly higher values.
In the case of 3 isolated VFe considered in section 5, the higher number of VFe makes the Fe sites to be sometimes n.n. Charge accumulation is always observed in the interstitial region between adjacent Fe, as evidenced in figure 12. But these regions of large CD lack of any directionality in the orbital order and are not coupled to short d(Fe-Fe). Their existence, on the other hand, tends to inhibit the polaronic charge sharing between Fe-Fe neighbors. In the supercell there is only one Fe-Fe distance shortened to 2.89 where polarons are formed, indicated in figure 12. This proves the crucial role of the long-range distribution of Fe in the lattice for the emergence of polaronic charge sharing.
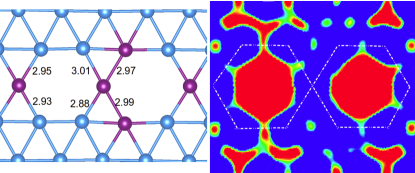
The similitude to magnetite is recovered at 4:1 clusters, as shown in figure 13. The FeA atom promotes a distribution where no Fe are first n.n. On the other hand, it is almost coplanar along to the plane with more VFe, filling the void created by them, and inhibiting the shrinkage of the irregular blue hexagon formed by the n.n. to the vacancies (see figure 8). Oppositely, at the plane with one vacancy the entire hexagon formed by the FeB around it shrinks, the shortest sides corresponding to Fe-Fe CLs. These reduced d(Fe-Fe) are again accompanied by a polaronic charge distribution, as evidenced by the large CD (thick dashed lines in figure 13) and the orbital character of the corresponding Fe states. The fact that there are not any d(Fe-Fe) below the threshold 2.89 between adjacent layers of opposite spin polarization supports the close relation between these reduced interatomic distances and the formation of polarons.
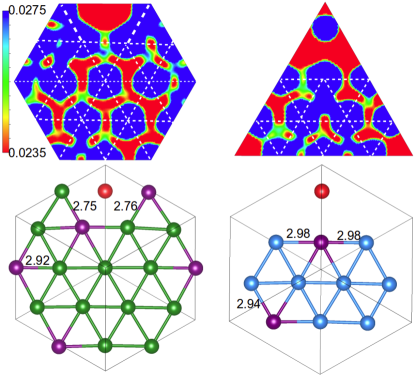
As the distribution of the Fe sites is ultimately dictated by the O positions, there is a clear correlation between the emergence of polaronic charge sharing and the structure of the O fcc sublattice. Also, the influence of the FeA sites in the distribution of the VFe has an important role to optimize the conditions for enhanced charge sharing. A distorted O sublattice with Fe atoms at tetrahedral sites also exist in magnetite Bernal-2014 , where furthermore there is more freedom to form polarons along any direction of the three-dimensional space due to the parallel alignment of the spins of the octahedral Fe atoms. In essence, this links unequivocally the long-range CO of magnetite to the short-range correlations, explaining the origin of diffuse scattering measurements that identified this connection and related the Fermi surface topology to the local CO Piekarz-2014 .
VIII Conclusions
Fe1-xO shows singular electronic properties that distinguish it from the rest of TMO and approach to the scenario defined by Fe3O4. The related physical phenomena emerge in reduced regions localized around the defects, converting Fe1-xO in a unique material to explore the complex interplay of lattice, charge and spin degrees of freedom involved in the Verwey transition.
The creation of a Fe vacancy in FeO introduces charge disproportionation in the octahedral Fe sublattice, leading to two Fe at n.n. positions of the vacancy site. These Fe are characterized by enhanced magnetic moments and shorter bond lengths to O, as compared to the Fe of stoichiometric FeO. They are also responsible for the closing of the insulating gap from 2 eV to below 1 eV. Their ordering in the lattice is governed by the charge balance, causing uncompensated magnetic moments that create a net magnetization in Fe1-xO.
In general, the Fe atoms tend to fill the voids created by the VFe, resulting in the contraction of the cell volume and the reduction of the rhombohedral distortion of FeO. Regardless of the distribution of the VFe, all alterations of the structural, electronic and magnetic properties are localized around the defects, and far from them the features of the stoichiometric oxide tend to be recovered. Formation of compact defect clusters is clearly favored, probably linked to a more effective compensation of the global charge. However, the fast quenching process applied to obtain Fe1-xO at ambient conditions may produce samples where different configurations coexist. The most relevant features introduced by the 4:1 clusters are a high degree of overall order, due to the enhanced localization of the defects, a larger local magnetization and the existence of more favorable conditions to form polarons.
In analogy to magnetite, the emergence of polaronic charge sharing is linked to the anomalous shortening of certain interatomic Fe-Fe distances below a threshold value of 2.89 . The formation of polarons is conditioned by the distribution of the VFe and the Fe sites, which in turn depends on the internal structure of the O sublattice. This connects the local charge order to the long-range one, a phenomenon also observed in magnetite Piekarz-2014 , thus allowing to understand the origin of the relation between short-range correlations and charge order across the Verwey transition.
The influence of the magnetic interactions is at the same time complex and subtle. Together with the reduction of the magnetically induced rhombohedral distortion, the limited effect in the energy balance of local alterations of the magnetization around the defects supports a secondary role of the magnetism in the stability of the system. However, the existence of a distortion at the O fcc sublattice that requires the presence of magnetism is preserved when VFe are introduced. Furthermore, this distortion plays a crucial role in the emergence of polaronic charge distributions, which are favored under the most stable defect configurations. The importance of the magnetic interactions is higher when tetrahedral FeA sites are occupied, making plausible that the magnetic energy balance becomes crucial to determine the stability of large defect structures based on spinel-like clusters.
IX Acknowledgments
This work has been financed by the Spanish Ministry of Science under contract MAT2012-38045-C04-04. I.B. acknowledges financial support from the JAE program of the CSIC.
References
- (1) J. Zaanen, G.A. Sawatzky, and J.W. Allen. Phys. Rev. Lett. 55, 418 (1985).
- (2) V.I. Anisimov, J. Zaanen, and O.K. Andersen. Phys. Rev. B 44, 943 (1991).
- (3) M. Däne, M. Lüders, A. Ernst, D. Ködderitzsch, W.M. Temmerman, Z. Szotek, and W. Hergert. J. Phys.: Condens. Matter 21, 045604 (2009).
- (4) P. Thunstrom, I. Di Marco, and O. Eriksson. Phys. Rev. Lett. 109, 186401 (2012).
- (5) C. Rödl, F. Fuchs, J. Furthmüller, and F. Bechstedt. Phys. Rev. B 79, 235114 (2009).
- (6) B.T. Willis and H.P. Rooksby. Acta Crystallogr. 6, 827 (1953).
- (7) W.L. Roth. Phys. Rev. 110, 1333 (1958).
- (8) Ch. Kant, M. Schmidt, Z. Wang, F. Mayr, V. Tsurkan, J. Deisenhofer, and A. Loidl. Phys. Rev. Lett. 108, 177203 (2012); W. Luo, P. Zhang, and M.L. Cohen. Solid State Commun. 142, 504 (2007).
- (9) N.C. Tombs and H.P. Rooksby. Nature 165, 442 (1950).
- (10) C.G. Shull, W.A. Strauser, and E.O. Wollan. Phys. Rev. 83, 333 (1951).
- (11) H. Fjellvag, F. Gronvold, and S. Stolen. J. Solid State Chem. 124, 52 (1996).
- (12) P.J. Saines, M.G. Tucker, D.A. Keen, A.K. Cheetham, and A.L. Goodwin. Phys. Rev. B 88, 134418 (2013).
- (13) Y. Fei and H.K. Mao. Science 266, 1678 (1994).
- (14) K. Ohta, R.E. Cohen, K. Hirose, K. Haule, K. Shimizu, and Y. Ohishi. Phys. Rev. Lett. 108, 026403 (2012).
- (15) R.M. Hazen and R. Jeanloz. Rev. Geophys. Space GE 22, 37 (1984).
- (16) C.A. McCammon and L.-G. Liu. Phys. Chem. Miner. 10, 106 (1984).
- (17) D.V. Dimitrov, K. Unruh, G.C. Hadjipanayis, V. Papaefthymiou, and A. Simopoulos. J. Appl. Phys. 87, 7022 (2000).
- (18) F. Schrettle, Ch. Kant, P. Lunkenheimer, F. Mayr, J. Deisenhofer, and A. Loidl. Eur. Phys. J. B 85, 164 (2012).
- (19) D.P. Johnson. Solid State Commun. 7, 1785 (1969).
- (20) W.L. Roth. Acta Crystallogr. 13, 140 (1960).
- (21) A.K. Cheetham, Fender B.E.F., and R.I. Taylor. J. Phys. C 4, 2160 (1971).
- (22) M.R. Press and D.E. Ellis. Phys. Rev. B 35, 4438 (1987).
- (23) U.D. Wdowik, P. Piekarz, K. Parlinski, A.M. Oleś, and J. Korecki. Phys. Rev. B 87, 121106(R) (2013).
- (24) F. Koch and J.B. Cohen. Acta Crystallogr. Sect. B 25, 275 (1969).
- (25) C.R.A. Catlow and B.E.F. Fender. J. Phys. C 8, 3267 (1975).
- (26) C. Lebreton and Hobbs L.W. Radiation Eff. 74, 227 (1983).
- (27) L. Minervini and Grimes R.W. J. Phys. Chem. Solids 60, 235 (1999).
- (28) I. Bernal-Villamil and S. Gallego. arXiv:1409.3012 cond-mat.str-el.
- (29) G. Kresse and J. Hafner. Phys. Rev. B 47, 558 (1993).
- (30) G. Kresse and J. Furthmüller. Phys. Rev. B 54, 11169 (1996).
- (31) P.E. Blochl. Phys. Rev. B 50, 17953 (1994).
- (32) G. Kresse and J. Joubert. Phys. Rev. B 59, 1758 (1999).
- (33) J.P. Perdew, A. Ruzsinszky, G.I. Csonka, O.A. Vydrov, G.E. Scuseria, L.A. Constantin, K. Zhou, and X. Burke. Phys. Rev. Lett. 100, 136406 (2008).
- (34) S.L. Dudarev, G.A. Botton, S.Y. Savrasov, C.J. Humphreys, and A.P. Sutton. Phys. Rev. B 57, 1505 (1998).
- (35) A. Fujimori, N. Kimizuka, M. Taniguchi, and S. Suga. Phys. Rev. B 36, 6691 (1987).
- (36) I. Bernal-Villamil and S. Gallego. (submitted).
- (37) C.G. Van de Walle and J. Neugebauer. Appl. Phys. Rev. 95, 3851 (2004).
- (38) C. Freysoldt, B. Grabowski, T. Hickel, J. Neugebauer, and G. Kresse. Rev. Mod. Phys. 86, 253 (2014).
- (39) K. Reuter and M. Scheffler. Phys. Rev. B 65, 035406 (2001).
- (40) I.I. Mazin and V.I. Anisimov. Phys. Rev. B 55, 12822 (1997).
- (41) E.J.W. Verwey. Nature 144, 327 (1939).
- (42) M.S. Senn, J.P. Wright, and J.P. Attfield. Nature 481, 173 (2012).
- (43) A. Bosak, D. Chernyshov, M. Hoesch, P. Piekarz, M. Le Tacon, M. Krisch, A. Kozlowski, A.M. Oleś, and K. Parlinski. Phys. Rev. X 4, 011040 (2014).
- (44) P.D. Battle and A.K. Cheetham. J. Phys. C 12, 337 (1979).
- (45) D.V. Dimitrov, K. Unruh, G.C. Hadjipanayis, V. Papaefthymiou, and A. Simopoulos. Phys. Rev. B 59, 14499 (1999).
- (46) F. Walz. J. Phys.C 14, R285 (2002).
- (47) J. García and G. Subías. J. Phys. C 16, R145 (2004).
- (48) I. Leonov, A.N. Yaresko, V.N. Antonov, M.A. Korotin, and V.I. Anisimov. Phys. Rev. Lett. 93, 146404 (2004).
- (49) P. Piekarz, K. Parlinski, and A.M. Oleś. Phys. Rev. B 76, 165124 (2007).
- (50) J. García, G. Subías, J. Herrero-Martín, J. Blasco, V. Cuartero, M.C. Sánchez, C. Mazzoli, and F. Yakhou. Phys. Rev. Lett. 102, 176405 (2009).
- (51) S.-C. Weng, Y.-R. Lee, C.-G. Chen, C.-H. Chu, Y.-L. Soo, and S.-L. Chang. Phys. Rev. Lett. 108, 146404 (2012).
- (52) See the Supplemental Material for a description of the full range charge density.