Searching for Be Stars in the Open Cluster NGC 663
Abstract
We present Be star candidates in the open cluster NGC 663, identified by H imaging photometry with the Palomar Transient Factory Survey, as a pilot program to investigate how the Be star phenomena, the emission spectra, extended circumstellar envelopes, and fast rotation, correlate with massive stellar evolution. Stellar membership of the candidates was verified by 2MASS magnitudes and colors, and by proper motions. We discover 4 new Be stars and exclude one known Be star from being a member due to its inconsistent proper motions. The fraction of Be stars to member stars [N(Be)/N(members)] in NGC 663 is 3.5%. The spectral type of the 34 Be stars in NGC 663 shows bimodal peaks at B0–B2 and B5–B7, which is consistent with the statistics in most star clusters. Additionally, we also discover 23 emission-line stars of different types, including non-member Be stars, dwarfs, and giants.
1 Introduction
Emission-line stars are symbolized by Balmer lines, particularly the H lines in emission spectra. In general, the mechanisms responsible for the emission lines include mass accretion and chromospheric activity. Emission stars can be in almost any stage during stellar evolution, from pre-main sequence T Tauri and Herbig Ae/Be stars, main-sequence Be/Ae and dMe stars, Wolf-Rayet stars, to giants and supergiants. Among these, the classical Be stars are particularly interesting because, other than the emission spectra, they also show near-infrared-excess emission above the stellar photospheric radiation, and fast rotation with an equatorial speed up to of breakup velocity (Townsend, Owocki, & Howarth, 2004).
The infrared excess of Be stars is usually attributed to plasma free-free emission in the extended envelopes. Even though it is thought that the fast rotation must play a decisive role, the interplay of the Be phenomena, namely the emission lines, infrared excess, and rapid rotation, is still unclear. One school of thought proposes that classical Be stars become fast rotators only at the second half of the main sequence (Fabregat & Torrejón, 2000), or near the turn-off (Keller et al., 2001). These Be stars are found in young ( Myr) star clusters in the Milky Way galaxy (Mathew, Subramaniam, & Bhatt, 2008), LMC, and SMC (Wisniewski & Bjorkman, 2006). Alternatively, the stars might have been spun up by mass transfer in binaries (McSwain & Gies, 2005).
Care should be exercised when collecting the sample of classical Be stars in a young cluster because a distinctly different group, the Herbig Ae/Be stars, intermediate-mass pre-main sequence objects, exhibit very similar observational properties, such as the emission spectra and infrared excess. Lee & Chen (2011) analyzed a group of Be stars away from any signposts of recent star formation, thereby being excluded of the pre-main sequence status, yet have unusually large infrared excess, with the observed 2MASS colors and both greater than 0.6 mag, that must be accounted for by thermal dust emission.
The primary uncertainty in the age determination of a single Be star is rectified if Be stars in a sample of star clusters at different ages can be studied. However, the sample of classical Be stars in open clusters is not complete due to several reasons. First, a nearby open cluster occupies a wide sky area, so a comprehensive survey for emission-line stars is time consuming, and often limited to bright stars. Secondly, Be stars show photometric and spectroscopic variability. With the wide field coverage of the Palomar Transient Factory (PTF) project, we have initiated a program to search for emission stars in clusters of different ages. This paper reports our methodology to identify emission-line stars with the PTF H images.
Here we present the results for the first target, the young open cluster NGC 663 (; galactic coordinates = 129.470, 0.953). With an age of 31 Mys and at a distance 2.1 kpc (Kharchenko et al., 2013), this cluster is known to host a large number of Be stars (Sanduleak, 1979; Pigulski, Kopacki, & Kołaczkowski, 2001; Mathew & Subramaniam, 2011). NGC 663 was also considered as a part of stellar association Cas OB8. Cas OB8 has been reported to be located at a distance of 2.9 kpc (Dambis, Mel’nik, & Rastorguev, 2001), and thus NGC 663 appears to be in the foreground. However, the distance of Cas OB8 seems to be overestimated. Using old and new reduction of the Hipparcos data, the mean distance of Cas OB8 is suggested to be 2.3 kpc (Mel’nik & Dambis, 2009). Taking possible uncertainty of distance estimation into consideration, NGC 663 could be a part of Cas OB8.
In Section 2, we describe the acquisition of the observations and the analysis to recognize emission stars. In Section 3, we present our list of H stars and compare our results, which reach fainter magnitudes, with those in the literature. Section 4 gives a summary of this study.
2 Observations and Data Analysis
Data used in this study include the PTF H images to identify, and the 2MASS near-infrared photometry and proper motions (PMs) to characterize, the emission star candidates. The PTF is an automated, wide-field survey with a 7.3 square-deg field of view (Law et al., 2009). All observations were carried out with the 48-inch Samuel Oschin Telescope at Palomar Observatory. The H and the continuum images are taken through HA656 and HA663 narrow-band filters (hereafter H and r-band, respectively), which have a central wavelength of 6563 Å and 6630 Å, with a bandwidth of 75 Å. The exposure time for the H and r-band images is 60 seconds. The image data were processed for bias corrections, flat fielding, and astrometric calibration with pipelines developed by the Infrared Processing and Analysis Center (IPAC; Laher et al., 2014).
The Two Micron All Sky Survey point source catalog (2MASS; Cutri et al., 2003) provides a uniformly calibrated database of the entire sky in the near-infrared , , and bands with a 10 detection limit of 15.8, 15.1, and 14.3 mag, respectively. Kinematic information can be obtained to secure the membership in a star cluster by the PPMXL data set, which is derived from an all-sky merged catalog based on the USNO-B1 and 2MASS positions of 900 million stars and galaxies, reaching a limiting V mag (Röser, Demleitner, & Schilbach, 2010). The typical error of PMs is less than 2 milliarcseconds (mas) per year for the brightest stars with Tycho-2 (Høg et al., 2000) observations, and is more than 10 mas yr-1 at the faint limit. However, Röser, Demleitner, & Schilbach (2010) noted that about 90 million (10%) objects of PPMXL include spurious entries; they found double or several matches of USNO-B1 stars with a 2MASS star. Kharchenko et al. (2012) have averaged such PMs and computed their errors in sky areas with star clusters including NGC 663. Therefore, we use these PMs instead of PPMXL data.
In our study, we made use of the 2MASS photometry and the PMs to select and characterize stellar member candidates. While matching counterparts in different star catalogs, a coincidence radius of 2″ was used among PTF, 2MASS, and PMs sources.
2.1 Data Analysis
2.1.1 The Search Region
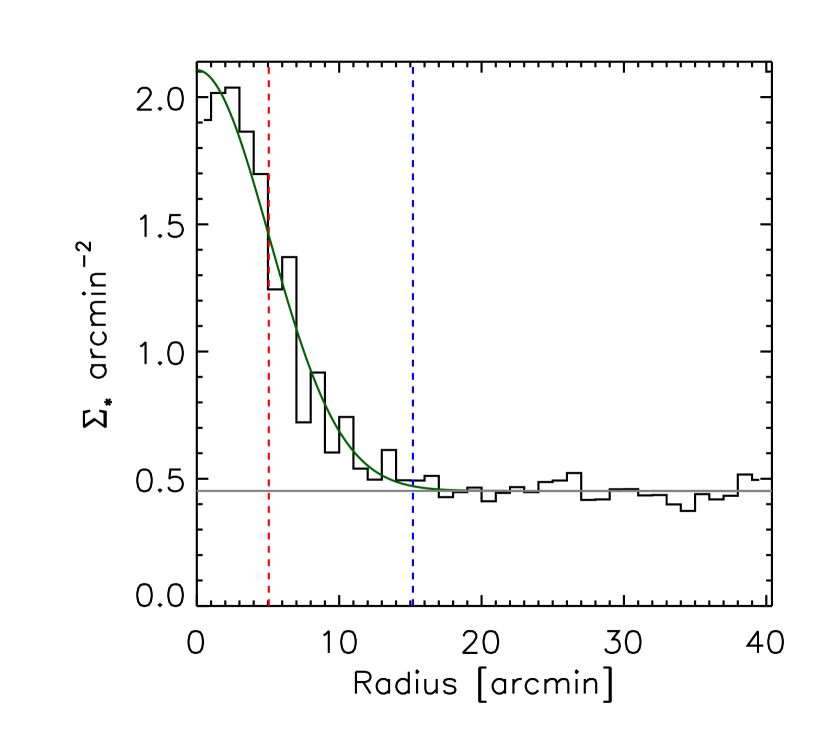
Open clusters generally have irregular shapes during their evolution either the internal relaxation process or the Galactic external perturbation (Chen, Chen, & Shu, 2004). We therefore need to adopt a suitable region to include all possible member stars for NGC 663. To determine the survey region, we selected the 2MASS point sources with in all bands and with PMs uncertainties mas yr-1. Based on the radial density profile (Figure 1), the best half-Gaussian fitting gives a 3 diameter of , which corresponds to a diameter of 18 pc at 2.1 kpc. Hence we adopted a box with the side of 40′ (4) as the field of NGC 663 in the subsequent analysis to cover the region of previous studies and possible candidates.
2.1.2 H Photometry and Emission-Line Candidates
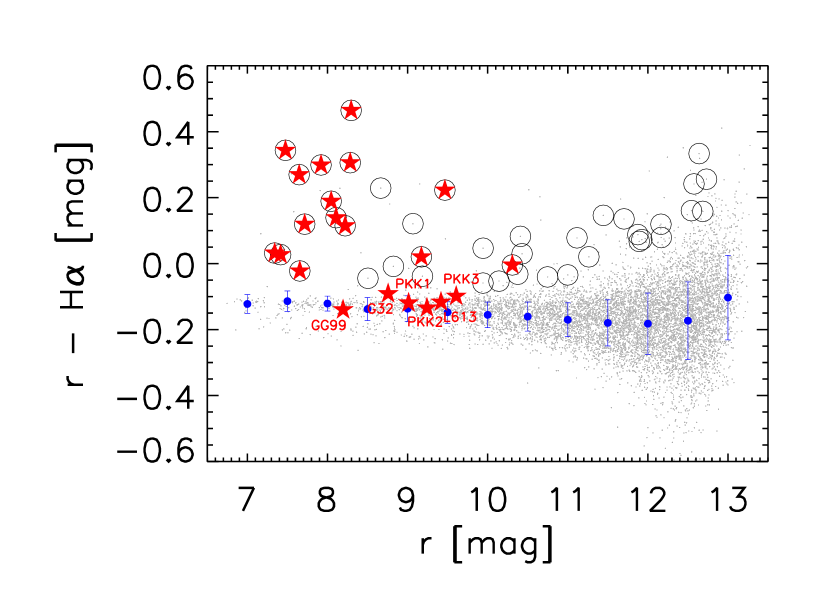
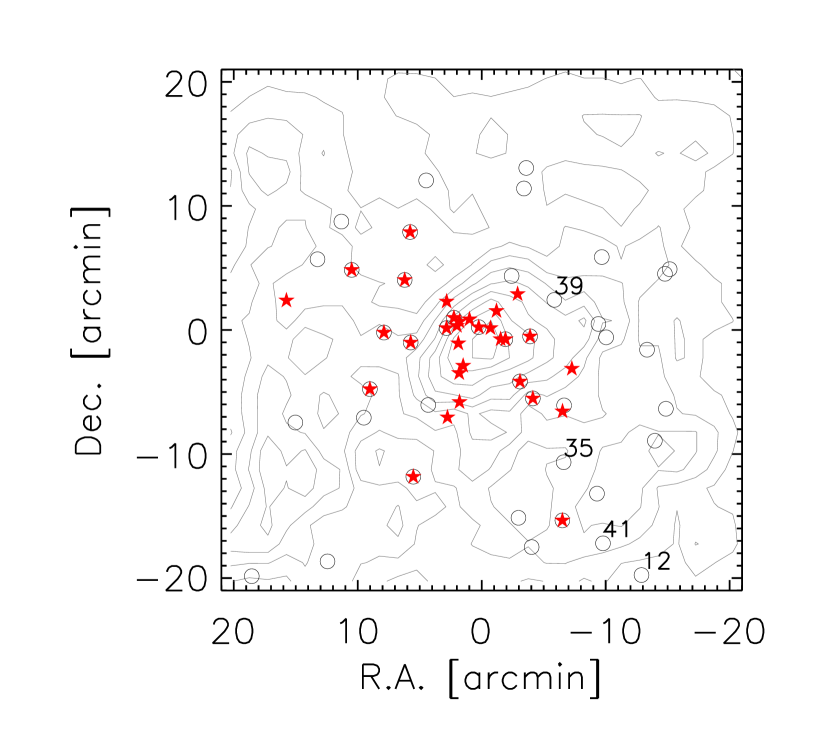
To identify possible H emission stars, we compute the difference of the instrumental magnitude between the H and the r-band images (e.g., rH). Under the assumption that the majority of stars in the field exhibit neither H in emission nor in absorption, those stand out in rH are probable H stars. Figure 2 shows the rH values for all stars (grey dots) within a field of , which guarantees to cover the spatial extent of NGC 663. Because of increasing scattering of the rH values toward faint magnitudes due to photometric errors, we exercised different selection criteria according to the brightness of the stars. We first calculated the photometric scattering () for each 0.5 mag r-band bin with the error propagated from photometric and systematic errors. The photometric error is the weighted photometric error of rH values for stars within the 0.5 mag bin while the systematic errors are the standard deviation of rH values for stars within the same bin. Then we selected emission-line candidates for those with rH 2 in each 0.5 mag bin, i.e., with significant flux excess in the H image than in the -band image, as illustrated in Figure 2. A total of 42 emission-line candidates were thus identified within a field. Table 1 lists the properties of the 42 emission-line candidates. The first column provides identification numbers. Columns 2 and 3 provide coordinates in degree. Columns 4 and 5 show the PM measurements in right ascension and declination. Column 6 gives PM uncertainties. Subsequent columns, 7 to 9, list the 2MASS , , and values. Column 10 lists names of known Be stars. Columns 11 and 12 give the PTF instrumental r-band and rH magnitudes. Column 13 provides the object classifications adopted from SIMBAD. Figure 3 shows the spatial distribution of our candidates.
2.1.3 Identification of Membership
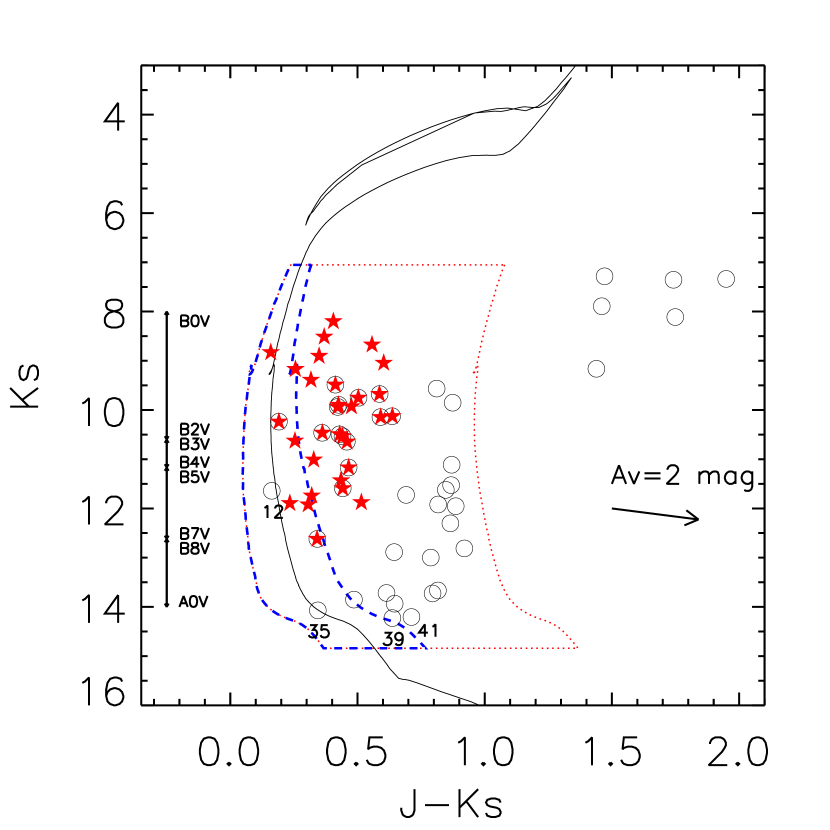
We verify member stars of NGC 663 with photometric and kinematic memberships. First, we determine the photometric membership by selecting stars within the region that are near the isochrone (Girardi et al., 2002) in the versus color-magnitude diagram (CMD). Pandey et al. (2005) suggest a range of age from 10 to 50 Myr for NGC 663. Here we adopt the mean age of 31 Myr, the distance of 2.1 kpc, and E(BV) of 0.7 mag from Kharchenko et al. (2013) for the isochrone. The region for the photometric membership is defined by estimating errors propagated from photometric errors of and values along with the isochrone from = 7 mag toward faint magnitudes (Figure 4). On the other hand, verification of the photometric membership for the H emission-line candidates is not intuitive. Lee & Chen (2011) showed that Be stars can have unusually large infrared excess with and both greater than 0.6 mag. As shown in Figure 4, we thus extend the selection region of the photometric membership with 1.2 mag for the emission-line candidates.
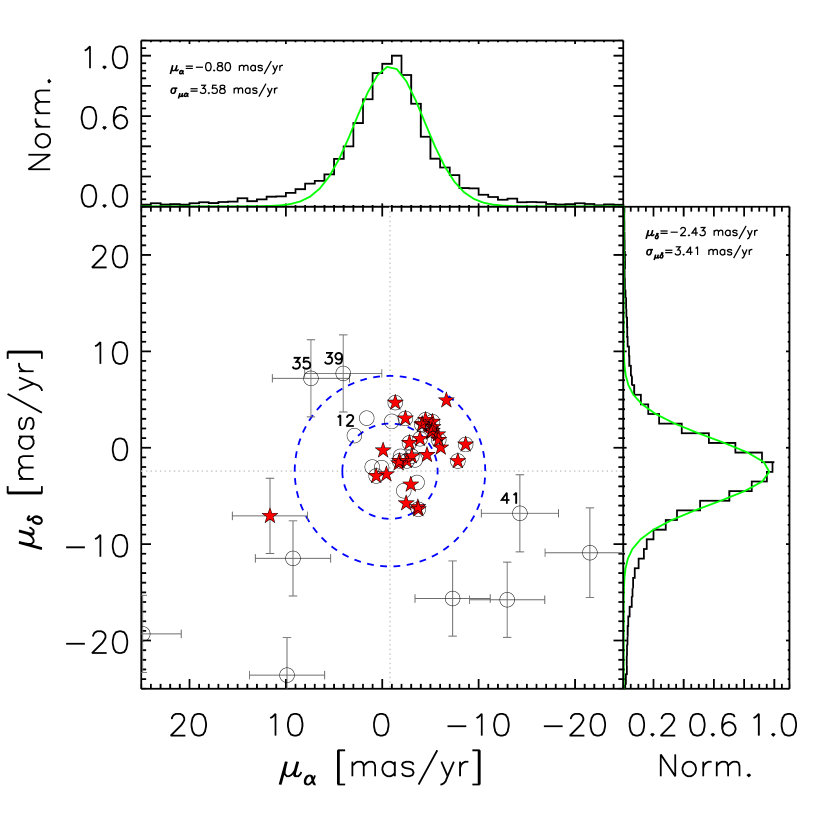
Secondly, we define a region that could include the possible kinematic membership. We have calculated the averaged PM, and standard deviations of stars within the field by fitting a Gaussian distribution to PMs. The mean PM is (0.80, 2.43) mas/yr, and standard deviations and are 3.58 mas yr-1 and 3.41 mas yr-1, respectively. We then adopt 2-sigma approach to determine the kinematic membership. The sigma = 4.94 mas/yr is the error propagated from and . Stars are considered as the kinematic membership if they are located inside the 2 region (e.g., 2 = 9.88 mas yr-1) (Figure 5).
Finally, objects are considered as member stars according to the photometric membership as well as kinematic one. Based on the CMD and PMs analysis, we identify 959 member stars in total within the field. Among the 42 emission-line candidates, 23 objects are eligible for our criteria and suggested to be member stars.
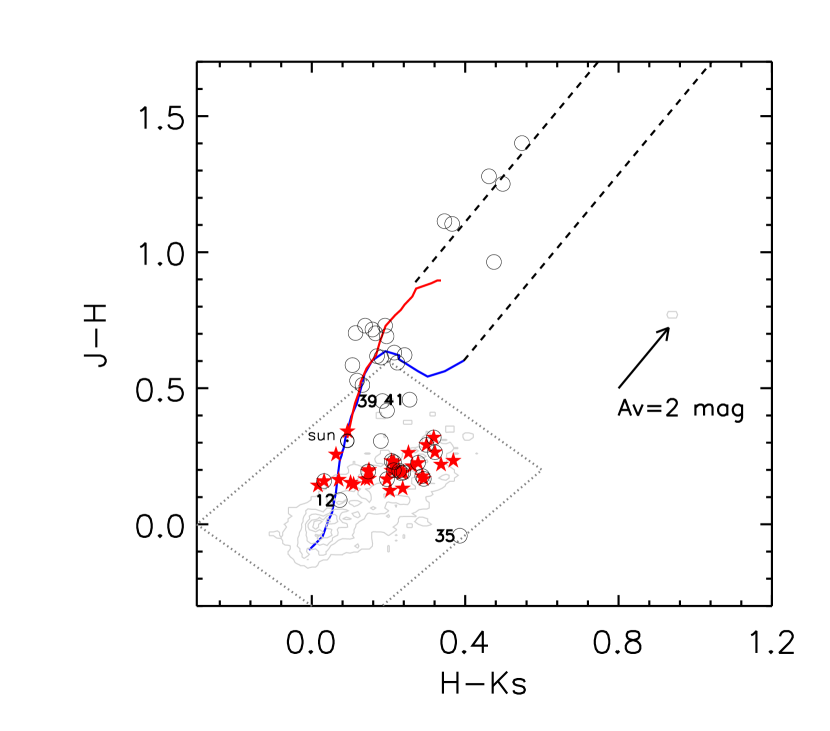
To further select possible Be stars from these 23 emission-line candidates, we defined a region in the vs. color-color diagram, which could cover 99% of Be stars collected from literatures (Zhang et al., 2005). As shown in Figure 6, grey contours represent over one thousand Be stars. Assuming that most Be stars have similar infrared colors, we thus selected possible Be stars inside grey-dashed region in the color-color diagram. Finally, 19 candidates are selected as Be stars in NGC 663. Among the 19 candidates, we have confirmed that 15 objects are previously reported Be stars. Therefore, we discover 4 Be stars (ID number: 12, 35, 39, and 41) in NGC 663.
3 Results and Discussion
3.1 Known Be Stars
Pigulski, Kopacki, & Kołaczkowski (2001) listed the compilation of 25 known Be stars in NGC 663 from previous studies. They further discovered 4 new Be stars using H photometry with a 60-cm telescope, and presented a list of 29 Be stars in the 30′ 30′ field. Mathew & Subramaniam (2011) found 2 more new Be stars with a spectroscopic observation and increased the number to 31. We list the properties of these 31 known Be stars in Table 2. The first column provides the names of known Be stars. Columns 2 and 3 provide coordinates in degree. Columns 4 and 5 list the PM measurements in right ascension and declination adopted from Kharchenko et al. (2012). Column 6 show errors of the PM measurements. Subsequent columns, 7, 8, and 9 list the 2MASS , and values. Column 10 show the H equivalent widths (EW(H)) adopted from Mathew & Subramaniam (2011). We use the averaged EW(H) if the Be stars have multiple observations. Column 11 indicates the spectral type adopted from Mathew & Subramaniam (2011). The final column shows the notes of the stars.
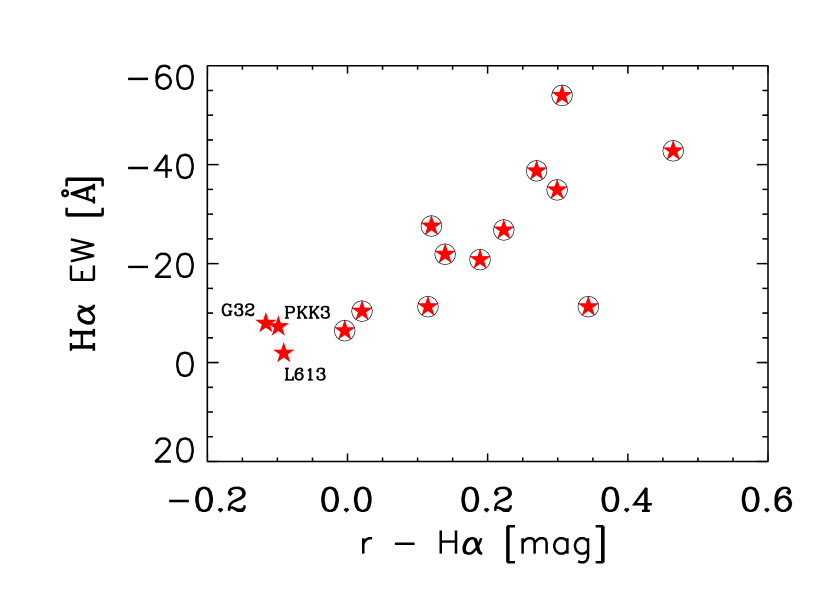
Among 31 known Be stars, we re-identify 15 objects and misidentify 6 objects. The rest 10 objects are discounted because of photometric problems, including saturation, blending of nearby stars, and contamination of the CCD gap. The misidentification of 6 objects might be caused by the variability; we find that two of the misidentified objects GG99 and L613 are suggested to show H variability (Sanduleak, 1990; Mathew & Subramaniam, 2011). Another reason of the misidentification might be due to weak emissions. As shown in Figure 2, the 4 misidentified objects (G32, PKK1, PKK2, and PKK3) show low rH values, which are similar to the mean values. This result indicates that their H strength could be too weak for firm identification. Figure 7 shows the correlation between the EW(H) and rH values, suggesting the EW(H) of the 4 misidentified objects are weaker than 10Å. Therefore, the misidentification of the 4 objects could be due to the weak emissions. If we select emission-line candidates with a lower threshold rH 1 to include objects with weak H, we then have additional 124 emission-line candidates with lower confidence levels while only two more known Be stars (G32 and PKK3) can be identified as emission-line stars. Thus, our detection limit for emission-line candidate is about EW(H) 10Å (rH 2).
3.2 New Be Candidates
We discover four possible new Be stars (ID number: 12, 35, 39, and 41) with rH 0.12. The EW(H) versus rH correlation (Figure 7) shows these newly discovered Be stars to have EW(H) stronger than 30 Å, thus the undetection of the 4 new Be stars in previous studies should not be caused by weak emissions. In addition to the emission-line variability, the undetection of the 4 new Be stars in previous studies might be due to their positions. Previous survey of NGC 663 covered only less the central 30′ 30′ field, whereas two of the four new Be stars are located outside region. Besides, by the same diagnosis, we find that one previously claimed Be star SAN 28 should not be the member star due to its inconsistent PM ( mas yr-1). We thus conclude that the number of Be stars in NGC 663 is 34.
3.3 Be Star Fraction
Mathew, Subramaniam, & Bhatt (2008) discovered 22 Be candidates among a total of 486 B-type stars in NGC 663. They further compare the ratio of Be stars to B-type stars [N(Be)/N(Be+B)] of NGC 663 with that of two rich clusters NGC 7419 and NGC 2345. Since NGC 663, NGC 7419 and NGC 2345 are all rich, moderately young open clusters with ages between 31 Myrs and 79 Myrs (Kharchenko et al., 2013), NGC 663 could have similar Be star fraction with that of NGC 7419 and NGC 2345. Interestingly, they showed the [N(Be)/N(Be+B)] fraction of NGC 663 is 4.5%, which is lower than that of NGC 7419 (11%) and NGC 2345 (26%). In spite of that our result increases the [N(Be)/N(Be+B)] fraction in NGC 663 from 4.5% to 6.8%, the fraction is still the lowest among these three clusters.
It is notable that our procedure of membership identification is quite different from that of Mathew, Subramaniam, & Bhatt (2008). Since they did not consider kinematic information to identify memberships, we perform the same method (see Sec. 2.1.3) for NGC 7419 and NGC 2345 to identify membership, and make a consistent comparison among these 3 clusters. Consequently, the ratio of Be stars to member stars [N(Be)/N(members)] of NGC 663, NGC 2345 and NGC 7419 are 3.5% (34/959), 6.8% (11/160), and 10.1% (22/217). Once again NGC 663 shows the lowest ratio among these 3 clusters. One possibility explains the low Be star fraction in NGC 663 is that the circumstellar material might be swept away by stellar winds from massive stars or supernova explosions. Since NGC 663 could be a part of stellar association Cas OB8, stellar winds from nearby massive stars or supernova events might remove the circumstellar material. Moreover, Pandey et al. (2005) reported that massive stars tend to lie in the centre of NGC 663, and suggested that the mass segregation is primordial, e.g. due to star formation process. When higher-mass stars preferentially locate towards in the centre of NGC 663, the circumstellar material might be swept in the early stage of star-forming process, and thus cause the low Be star fraction.
3.4 Spectral Type
The spectral types of some Be stars in NGC 663 are present by Mathew & Subramaniam (2011). It might be able to classify the stars based on the relative brightness of the stars with and without spectra. According to known spectra, the stars with r-band instrumental magnitudes brighter than 8.5 mag are classified as B0–B2V, and the ones with magnitudes between 9 and 11 magnitudes are belong to B5–B7 stars. Thus, we could classify the Be stars with magnitudes between 8.5 and 9 magnitudes as B3–B4 stars. Those candidates with r-band magnitudes fainter than 11 mag might be late-type B or early-type A stars, e.g., B8–A0 stars. Consequently, we have 21 Be stars in B0–B2 type including saturated stars, which should be brighter than 8.5 mag. We also have 2 Be stars in B3–B4 type, 7 ones in B5–B7 type, and 3 ones in B8–A0 type. Our result shows similar distribution of spectral type to that of previous studies; Mermilliod (1982) investigated the distribution of Be stars as a function of spectral types and found that a maxima at type of B1–B2 and B7–B8 while Mathew, Subramaniam, & Bhatt (2008) showed bimodal peaks in B1–B2 and B5–B7 for open clusters. Among four newly discovered Be stars, one is classified as a B3–B4 star and three should be B8–A0 stars. Before we discover 3 Be candidates belong to B8–A0 type, the fraction of Be stars with spectral type later than B5 is 21% (7/33) in NGC 663. Our results increase the fraction to 30% (10/33), and make it to be consistent with other open clusters (Mathew, Subramaniam, & Bhatt, 2008).
3.5 New Emission-Line Candidates
We have identified 42 emission-line stars within a field of NGC 663; 15 stars are known Be stars and 4 stars are newly discovered. Among the remaining 23 candidates, 2 candidates could be emission-line dwarf stars and 6 candidates could be giants in NGC 663. For the rest 15 candidates, we have also identified 2 stars as Be stars and 13 objects as emission-line dwarfs in the field that are not associated with the cluster. After cross-matching with the SIMBAD database, these 23 emission-line stars are presented for the first time.
4 SUMMARY
We apply the H imaging photometry to identify 42 emission-line candidates in NGC 663. Four newly discovered Be stars have been identified as members with the CMD and PMs. We also discover that one known Be star SAN28 should not be a cluster member due to its inconsistent PMs. Our results show that the number of Be stars in NGC 663 is 34, and the ratio of Be stars to member stars [N(Be)/N(members)] is 3.5%. The low fraction of Be stars in NGC 663 might be the consequence of the effects of mass segregation and stellar winds, or supernova explosions. Our results also reveal bimodal peaks of spectral type B0–B2 and B5–B7 for the Be population, which is consistent with the statistics in most star clusters. Finally, we discover 23 emission-line stars of non-member Be stars, dwarfs, and giants. Our results suggest that the H photometry of the PTF data is very useful to search for emission-line stars. More Be stars in nearby clusters will be further searched and investigated to study the evolutionary scenario of the Be phenomena.
| ID | R.A. | Dec. | epm | Name | r | SIMBAD | ||||||
|---|---|---|---|---|---|---|---|---|---|---|---|---|
| deg | deg | mas/yr | mas/yr | mas/yr | mag | mag | mag | mag | mag | |||
| 1 | 26.483740 | 61.212574 | 1.35 | 4.68 | 1.50 | 9.675 | 0.266 | 0.321 | GC97 | 7.715 | 0.120 | Be |
| 2 | 26.443295 | 61.155804 | 1.79 | 1.36 | 2.00 | 9.895 | 0.198 | 0.228 | GG95 | 7.647 | 0.270 | Be |
| 3 | 26.326494 | 60.969196 | 4.48 | 2.90 | 2.00 | 9.751 | 0.226 | 0.278 | GG90 | 7.415 | 0.027 | Be |
| 4 | 26.750830 | 61.356567 | 2.56 | 1.37 | 2.00 | 9.486 | 0.200 | 0.213 | GG104 | 7.341 | 0.032 | HXB |
| 5 | 26.861519 | 61.145599 | 3.74 | 6.38 | 2.00 | 10.237 | 0.158 | 0.033 | GG108 | 7.476 | 0.344 | Be |
| 6 | 26.739870 | 61.027885 | 5.86 | 0.82 | 2.00 | 9.937 | 0.189 | 0.233 | GG103 | 7.655 | 0.022 | Be |
| 7 | 26.415096 | 61.216434 | 2.40 | 3.04 | 2.00 | 10.494 | 0.191 | 0.238 | GG94 | 8.107 | 0.139 | Be |
| 8 | 26.407560 | 61.133095 | 0.63 | 2.93 | 2.00 | 10.644 | 0.167 | 0.291 | GG93 | 7.920 | 0.299 | Be |
| 9 | 26.765589 | 61.292236 | 3.92 | 0.93 | 2.00 | 10.534 | 0.234 | 0.207 | D01034 | 8.221 | 0.115 | Be |
| 10 | 26.627619 | 61.241455 | 7.84 | 1.38 | 2.00 | 10.463 | 0.165 | 0.196 | VES620 | 8.046 | 0.189 | Be |
| 11 | 26.202705 | 61.215088 | 1.04 | 2.00 | 5.00 | 7.284 | 1.104 | 0.367 | — | 8.505 | 0.044 | — |
| 12 | 26.108356 | 60.895775 | 2.89 | 1.26 | 2.00 | 11.642 | 0.090 | 0.073 | — | 8.665 | 0.229 | — |
| 13 | 26.914015 | 61.305721 | 3.06 | 0.88 | 2.79 | 10.144 | 0.292 | 0.298 | GG109 | 8.295 | 0.465 | Be |
| 14 | 26.648338 | 61.227543 | 4.11 | 2.39 | 2.00 | 10.126 | 0.318 | 0.318 | GG101 | 8.284 | 0.306 | Be |
| 15∗ | 26.320665 | 61.123646 | 98.90 | 8.50 | 12.90 | 9.852 | 0.716 | 0.158 | — | 8.823 | 0.008 | iC |
| 16 | 26.068714 | 61.076244 | 0.98 | 2.74 | 5.00 | 7.892 | 1.115 | 0.345 | — | 9.185 | 0.038 | — |
| 17∗ | 26.444133 | 60.972193 | 357.10 | 53.10 | 5.00 | 9.565 | 0.571 | 0.240 | — | 9.068 | 0.121 | PM |
| 18 | 26.558376 | 61.228851 | 8.65 | 0.34 | 2.00 | 11.168 | 0.177 | 0.288 | BG114 | 9.172 | 0.021 | Be |
| 19 | 26.748318 | 61.208199 | 5.21 | 2.70 | 2.59 | 11.590 | 0.227 | 0.215 | VES624 | 9.466 | 0.223 | Be |
| 20 | 26.431408 | 61.415092 | 3.61 | 3.60 | 5.00 | 9.163 | 0.965 | 0.474 | — | 9.943 | 0.047 | — |
| 21 | 26.230267 | 61.005119 | 9.26 | 11.48 | 3.90 | 11.725 | 0.585 | 0.106 | — | 9.941 | 0.059 | — |
| 22 | 26.943848 | 61.370613 | 29.70 | 52.68 | 3.90 | 11.112 | 0.731 | 0.139 | — | 10.141 | 0.053 | — |
| 23 | 26.036928 | 61.300438 | 1.89 | 0.89 | 5.00 | 7.337 | 1.400 | 0.549 | — | 10.409 | 0.083 | — |
| 24 | 26.223892 | 61.233059 | 7.30 | 15.64 | 3.90 | 11.527 | 0.701 | 0.167 | — | 10.376 | 0.032 | iC |
| 25 | 27.009970 | 61.320004 | 28.46 | 15.60 | 3.90 | 11.623 | 0.632 | 0.215 | — | 10.747 | 0.040 | — |
| 26 | 26.823006 | 61.221569 | 2.82 | 0.51 | 3.90 | 12.619 | 0.194 | 0.148 | PKK4 | 10.308 | 0.004 | Be |
| 27 | 27.185598 | 60.894218 | 0.07 | 2.06 | 5.00 | 7.355 | 1.280 | 0.462 | — | 10.430 | 0.030 | — |
| 28 | 26.424812 | 61.442692 | 3.41 | 1.26 | 3.90 | 12.887 | 0.511 | 0.133 | — | 11.000 | 0.034 | — |
| 29 | 27.068419 | 61.100658 | 2.23 | 4.46 | 5.00 | 8.112 | 1.252 | 0.497 | — | 11.115 | 0.078 | — |
| 30 | 26.023653 | 61.306664 | 24.85 | 19.31 | 4.00 | 11.954 | 0.691 | 0.195 | — | 11.444 | 0.146 | — |
| 31 | 26.088741 | 61.198486 | 1.61 | 3.07 | 4.00 | 12.998 | 0.618 | 0.170 | — | 11.702 | 0.136 | — |
| 32∗ | 26.698837 | 61.124264 | 233.60 | 5.40 | 15.30 | 11.920 | 0.594 | 0.223 | — | 11.263 | 0.021 | iC |
| 33 | 26.466228 | 61.297523 | 12.96 | 15.77 | 3.90 | 13.717 | 0.418 | 0.196 | — | 12.167 | 0.079 | iC |
| 34 | 26.037413 | 61.119137 | 52.73 | 19.68 | 12.07 | 13.852 | 0.306 | 0.180 | — | 11.892 | 0.067 | — |
| 35∗ | 26.322468 | 61.047340 | 7.40 | 7.20 | 4.00 | 14.071 | 0.042 | 0.386 | — | 12.163 | 0.119 | — |
| 36 | 26.706167 | 61.425907 | 9.88 | 23.59 | 3.90 | 12.303 | 0.623 | 0.242 | — | 11.875 | 0.088 | — |
| 37 | 26.877998 | 61.107220 | 21.54 | 10.89 | 4.65 | 12.812 | 0.729 | 0.191 | — | 11.924 | 0.073 | — |
| 38 | 26.213600 | 61.322948 | 26.75 | 37.80 | 15.86 | 13.727 | 0.613 | 0.182 | — | 12.575 | 0.242 | — |
| 39 | 26.347054 | 61.265411 | 4.05 | 7.71 | 4.00 | 14.227 | 0.453 | 0.184 | — | 12.732 | 0.256 | — |
| 40 | 26.411844 | 60.933365 | 45.93 | 61.68 | 3.90 | 13.666 | 0.703 | 0.113 | — | 12.640 | 0.334 | — |
| 41 | 26.214262 | 60.938358 | 14.28 | 6.80 | 4.00 | 14.206 | 0.457 | 0.255 | — | 12.544 | 0.161 | — |
| 42 | 26.976549 | 60.914070 | 62.77 | 33.19 | 5.79 | 13.935 | 0.528 | 0.118 | — | 12.686 | 0.158 | — |
Note. — Column 1: ID numbers of candidates. Numbers with asterisks: No matched star in Kharchenko et al. (2012), and we adopt PMs from PPMXL. Column 2: RA in degree (J2000). Column 3: Dec in degree (J2000). Column 4: Proper motion of RA. Column 5: Proper motion of Dec. Column 6: PM uncertainties. Column 7: -band magnitudes adopted from 2MASS. Column 8: . Column 9: . Column 10: Known name. Column 11: rband instrumental magnitude. Column 12: rH magnitudes. Column 13: Object classification adopted from SIMBAD; Be: Be stars; HXB: high mass X-ray binary; iC: star in cluster; PM: high proper-motion star.
| Name | R.A. | Dec. | epm | Ks | EW (H) | Spectral type | Note | ||||
|---|---|---|---|---|---|---|---|---|---|---|---|
| deg | deg | mas/yr | mas/yr | mas/yr | mag | mag | mag | Å | |||
| MWC 428 | 26.325104 | 61.115692 | 5.05 | 1.57 | 2.00 | 8.602 | 0.196 | 0.209 | — | — | Saturated |
| GG 102 | 26.648041 | 61.263290 | 4.64 | 0.74 | 2.02 | 8.880 | 0.132 | 0.236 | — | — | Saturated |
| MWC 700 | 26.612782 | 61.167202 | 5.76 | 1.39 | 2.00 | 8.987 | 0.144 | 0.015 | — | — | Saturated |
| VES 619 | 26.611837 | 61.128258 | 5.26 | 2.14 | 2.00 | 9.229 | 0.221 | 0.337 | — | — | Saturated |
| BG 15 | 26.615303 | 61.207062 | 6.65 | 4.92 | 2.00 | 9.251 | 0.201 | 0.148 | — | — | Saturated |
| MWC 698 | 26.497110 | 61.212685 | 3.69 | 6.16 | 2.89 | 9.425 | 0.148 | 0.109 | — | — | Saturated |
| VES 616 | 26.525537 | 61.227573 | 2.48 | 5.76 | 2.00 | 9.645 | 0.234 | 0.368 | — | — | Saturated |
| GG 110 | 27.096041 | 61.264717 | 2.96 | 3.82 | 2.00 | 9.704 | 0.168 | 0.149 | — | — | Saturated |
| GG 104 | 26.750830 | 61.356567 | 2.56 | 1.37 | 2.00 | 9.899 | 0.200 | 0.213 | — | — | — |
| GG 90 | 26.326494 | 60.969196 | 4.48 | 2.90 | 2.00 | 10.255 | 0.226 | 0.278 | — | — | — |
| GC 97 | 26.483740 | 61.212574 | 1.35 | 4.68 | 1.50 | 10.262 | 0.266 | 0.321 | 27.6 | B2V | — |
| GG 95 | 26.443295 | 61.155804 | 1.79 | 1.36 | 2.00 | 10.321 | 0.198 | 0.228 | 38.8 | B1V | — |
| GG 103 | 26.739870 | 61.027885 | 5.86 | 0.82 | 2.00 | 10.359 | 0.189 | 0.233 | — | — | — |
| GG 98 | 26.584209 | 61.239319 | 6.07 | 0.02 | 2.00 | 10.402 | 0.213 | 0.262 | — | — | Blended |
| GG 108 | 26.861519 | 61.145599 | 3.74 | 6.38 | 2.00 | 10.428 | 0.158 | 0.033 | 11.3 | B0–B1V | — |
| GG 109 | 26.914015 | 61.305721 | 3.06 | 0.88 | 2.79 | 10.734 | 0.292 | 0.298 | 42.8 | B1V | — |
| GG 101 | 26.648338 | 61.227543 | 4.11 | 2.39 | 2.00 | 10.762 | 0.318 | 0.318 | 54.0 | B1V | — |
| VES 620 | 26.627619 | 61.241455 | 7.84 | 1.38 | 2.00 | 10.824 | 0.165 | 0.196 | 20.8 | B1V | — |
| GG 99 | 26.612082 | 61.236439 | 5.19 | 1.75 | 2.00 | 10.880 | 0.153 | 0.101 | — | — | — |
| GG 94 | 26.415096 | 61.216434 | 2.40 | 3.04 | 2.00 | 10.923 | 0.191 | 0.238 | 21.9 | B2V | — |
| D01034 | 26.765589 | 61.292236 | 3.92 | 0.93 | 2.00 | 10.975 | 0.234 | 0.207 | 11.3 | — | — |
| GG 93 | 26.407560 | 61.133095 | 0.63 | 2.93 | 2.00 | 11.102 | 0.167 | 0.291 | 34.9 | B2V | — |
| G 32 | 26.619238 | 61.230675 | 4.15 | 2.47 | 2.00 | 11.338 | 0.125 | 0.203 | 7.9 | B3V | — |
| BG 114 | 26.558376 | 61.228851 | 8.65 | 0.34 | 2.00 | 11.633 | 0.177 | 0.288 | 10.4 | B5V | — |
| VES 624 | 26.748318 | 61.208199 | 5.21 | 2.70 | 2.59 | 12.032 | 0.227 | 0.215 | 26.8 | B5V | — |
| L 613 | 26.645269 | 61.107712 | 0.09 | 0.27 | 2.59 | 12.126 | 0.163 | 0.071 | 1.9 | B5V | — |
| SAN 28 | 26.508623 | 61.250595 | 16.07 | 34.09 | 3.95 | 12.388 | 0.262 | 0.253 | 42.1 | B5V | CCD gap |
| PKK 1 | 26.298687 | 61.173038 | 11.65 | 7.07 | 3.90 | 11.864 | 0.342 | 0.092 | — | — | — |
| PKK 2 | 26.449562 | 61.273327 | 0.43 | 2.75 | 3.90 | 12.060 | 0.257 | 0.064 | — | — | — |
| PKK 3 | 26.601690 | 61.177017 | 1.70 | 1.61 | 2.59 | 12.225 | 0.166 | 0.141 | 7.3 | B5–B7V | — |
| PKK 4 | 26.823006 | 61.221569 | 2.82 | 0.51 | 3.90 | 12.961 | 0.194 | 0.148 | 6.5 | B5–B7V | — |
Note. — Column 1: Name of known Be stars. Column 2: R.A. in degree (J2000). Column 3: Dec. in Degree (J2000). Column 4: Proper motions of R.A. Column 5: Proper motions of Dec. Column 6: Uncertainties of proper motions. Column 7: -band magnitudes adopted from 2MASS. Column 8: magnitudes. Column 9: magnitudes. Column 10: H equivalent widths adopted from Mathew & Subramaniam (2011). If the objects have more than one observation at different epoches, we take the averaged equivalent widths. Column 11: Spectral type adopted from Mathew & Subramaniam (2011). Column 12: Notes of objects.
References
- Bessell & Brett (1988) Bessell, M. S., & Brett, J. M. 1988, PASP, 100, 1134
- Chen, Chen, & Shu (2004) Chen, W. P., Chen, C. W., & Shu, C. G. 2004, AJ, 128, 2306
- Cutri et al. (2003) Cutri, R. M., Skrutskie, M. F., van Dyk, S., et al. 2003, yCat, 2246, 0
- Dambis, Mel’nik, & Rastorguev (2001) Dambis, A. K., Mel’nik, A. M., & Rastorguev, A. S. 2001, Astron. Lett., 27, 68
- Fabregat & Torrejón (2000) Fabregat, J., & Torrejón, J. M. 2000, A&A, 357, 451
- Girardi et al. (2002) Girardi, L., Bertelli, G., Bressan, A., et al. 2002, A&A, 391, 195
- Høg et al. (2000) Høg, E., Fabricius, C., Makarov, V. V., et al. 2000, A&A, 355, L27
- Keller et al. (2001) Keller, S. C., Grebel, E. K., Miller, G. J., & Yoss, K. M. 2001, AJ, 122, 248
- Kharchenko et al. (2012) Kharchenko, N. V., Piskunov, A. E., Schilbach, E., Röser, S., & Scholz, R.-D. 2012, A&A,543 156
- Kharchenko et al. (2013) Kharchenko, N. V., Piskunov, A. E., Schilbach, E., Röser, S., & Scholz, R.-D. 2013, A&A, 558, A53
- Law et al. (2009) Law, N. M., Kulkarni, S. R., Dekany, R. G., et al. 2009, PASP, 121, L1395
- Laher et al. (2014) Laher et al. 2014, PASP, 126, 674
- Lee & Chen (2011) Lee, C.-D., & Chen, W.-P. 2011, IAU Symposium, 272, 366
- Mathew, Subramaniam, & Bhatt (2008) Mathew, B., Subramaniam, A., & Bhatt, B. C. 2008, MNRAS, 388, 1879
- Mathew & Subramaniam (2011) Mathew, B., & Subramaniam, A. 2011, BASI, 39, 517
- McSwain & Gies (2005) McSwain, M. V., & Gies, D. R. 2005, ApJS, 161, 118
- Mel’nik & Dambis (2009) Mel’nik, A. M., & Dambis, A. K. 2009, MNRAS, 400, 518
- Mermilliod (1982) Mermilliod, J. C. 1982, A&A, 109, 48
- Pandey et al. (2005) Pandey, A. K., Upadhyay, K., Ogura, K., et al. 2005, MNRAS, 358, 1290
- Pigulski, Kopacki, & Kołaczkowski (2001) Pigulski, A., Kopacki, G., & Kołaczkowski, Z. 2001, A&A, 376, 144
- Rieke & Lebofsky (1985) Rieke, G. H., & Lebofsky, M. J. 1985, ApJ, 288, 618
- Röser, Demleitner, & Schilbach (2010) Röser, S., Demleitner, M., & Schilbach, E. 2010, AJ, 139, 2440
- Sanduleak (1979) Sanduleak, N. 1979, AJ, 84, 1319
- Sanduleak (1990) Sanduleak, N. 1990, AJ, 100, 1239
- Townsend, Owocki, & Howarth (2004) Townsend, R. H. D., Owocki, S. P., & Howarth, I. D. 2004, MNRAS, 350, 189
- Wisniewski & Bjorkman (2006) Wisniewski, J. P., & Bjorkman, K. S. 2006, ApJ, 652, 458
- Zhang et al. (2005) Zhang, P., Chen P. S., & Yang, H. T. 2005, New Astronomy, 10, 325