Direct Observations of Tether-cutting Reconnection During a Major Solar Event From 2014 February 24 to 25
Abstract
Using the multi-wavelength data from Atmospheric Imaging Assembly on board the Solar Dynamic Observatory, we investigated two successive solar flares, a C5.1 confined flare and an X4.9 ejective flare with a halo coronal mass ejection, in NOAA AR 11990 from 2014 Feb 24 to 25. Before the confined flare onset, EUV brightening beneath the filament was detected. As the flare began, a twisted helical flux rope (FR) wrapping around the filament moved upward and then stopped, and in the meantime an obvious X-ray source below it was observed. Prior to the ejective X4.9 flare, some pre-existing loop structures in the active region interacted with each other, which produced a brightening region beneath the filament. Meanwhile, a small flaring loop appeared below the interaction region and some new helical lines connecting the far ends of the loop structures was gradually formed and continually added into the former twisted FR. Then, due to the resulting imbalance between the magnetic pressure and tension, the new FR together with the filament erupted outward. Our observations coincide well with tether-cutting model, suggesting that the two flares probably have the same triggering mechanism, i.e., tether-cutting reconnection. To our knowledge, this is the first direct observation of tether-cutting reconnection occurring between the pre-existing loops in active region. In the ejective flare case, the erupting filament exhibited an -like kinked structure and underwent an exponential rise after a slow-rise phase, indicating the kink instability might be also responsible for the eruption initiation.
1 Introduction
Unraveling the triggering mechanism of solar eruptions has long been a challenge. A variety of models have been devoted to interpreting the eruption initiations (as reviewed by, e.g., Lin et al., 2003; Vršnak, 2008; Chen, 2011). Considering removing the strong stabilizing force from the overlying magnetic arcade by means of a slow magnetic reconnection in the low corona, Moore & Labonte (1980) and Moore et al. (2001) proposed the tether-cutting mechanism based on a single bipolar field geometry. In this model, the strongly-sheared core fields are overlaid by less-sheared envelope magnetic arcades. At first, the strongly-sheared core fields with opposite polarities reconnect slowly above the polarity inversion line (PIL), but beneath the filament, which leads to the formations of large-scale twisted flux rope connecting the far ends of the core fields and small flaring loop shrinking downward. Then, due to the out-of-balance situation between the outward magnetic pressure and the downward magnetic tension, the whole field expands outward. As the overlying envelope magnetic arcades are stretched up by the erupting filament, fast reconnection occurs with an elongated current sheet forming below the filament, which produces the flare ribbons and further speeds up the filament eruption to form the coronal mass ejection (CME). A similar mechanism was also discussed by van Ballegooijen & Martens (1989) in their “flux cancellation” model.
The tether-cutting or flux cancellation model was supported by some observational and numerical studies (e.g., Wang & Shi, 1993; Amari et al., 1999, 2000; Zhang et al., 2001; Sterling & Moore, 2005; Yurchyshyn et al., 2006; Sterling et al., 2007b; Kim et al., 2008; Liu et al., 2008; Green & Kliem, 2009; Liu et al., 2010, 2012) and has been mentioned in a large number of literatures. However, most of the evidences supportive of tether-cutting reconnection are indirect, only derived from some associated observational phenomena, such as H, EUV, or X-ray brightenings (e.g., Moore & Labonte, 1980; Sterling & Moore, 2005; Yurchyshyn et al., 2006), slow-rise motion of filament (e.g., Sterling et al., 2007b, 2011), morphological changes of flaring structures (e.g., Kim et al., 2008; Liu et al., 2010), and photospheric sheared magnetic fluxes (e.g., Moore & Roumeliotis, 1992; Moore et al., 2001; Savcheva et al., 2012). So far, direct observations of the tether-cutting reconnection have been very rare. The ideal kink instability of twisted magnetic flux ropes is considered as another possible initial driver of solar eruptions (e.g., Török & Kliem, 2003; Kliem et al., 2004), which is supported by the frequently observed deformation of the flux rope axis during eruption (e.g., Ji et al., 2003; Williams et al., 2005; Yang et al., 2012; Shen et al., 2012).
In this study, using the high-resolution multi-wavelength data from Atmospheric Imaging Assembly/Solar Dynamic Observatory (AIA/; Lemen et al., 2012), we present an unambiguous observation of tether-cutting reconnection during a major solar eruption, which occurred between the pre-existing loop structures in active region (AR) 11990 and most likely triggered the ensuing X4.9 flare and associated halo CME with a combination of kink instability of the filament.
2 Data and Observations
AIA/ provides full-disk images up to 0.5 R☉ above the solar limb with 1.2 spatial resolution and 12 s cadence in 10 wavelengths. We mainly used the data (Level 1.5 images) at 7 EUV channels centered at 304 Å (He II, 0.05 MK), 171 Å (Fe IX, 0.6 MK), 193 Å (Fe XII, 1.3 MK and Fe XXIV, 20 MK), 211 Å (Fe XIV, 2 MK), 335Å (Fe XVI, 2.5 MK), 94 Å (Fe XVIII, 7 MK), and 131 Å (Fe VIII, 0.4 MK and Fe XXI, 11 MK). We de-rotated the AIA data for each of the two flares to two respective times (Feb 24 21:30 UT and Feb 25 00:30 UT). The longitudinal magnetograms and continuum intensity images with 1.0 spatial resolution and 45 s cadence from Helioseismic and Magnetic Imager (HMI; Schou et al., 2012) on help us to analyze the connectivities of the loop structures in AR 11990. We also used the Ramaty High Energy Solar Spectroscopic Imager (; Lin et al., 2002) X-ray observations to see the evolution of X-ray sources during the flare. The accuracy in the alignment between AIA and images is estimated to be about 3 (Zehnder et al., 2003).
2.1 Overview of the Event
According to -15 observations, a C5.1 flare took place in NOAA AR 11990 (S12E82) from 21:31 UT on 2014 Feb 24. The AIA data show that no mass or magnetic structure escaped from the solar surface during the weak flare. Three hours later, an X4.9 flare occurred from the same location with peak at 00:49 UT on Feb 25, accompanied by a filament eruption and a halo CME with a median velocity of 1041 km s-1 (see CACTus catalogue, http://sidc.be/cactus). Our observations cover both events well.
2.2 A Flux Rope Appearing During the Confined Flare
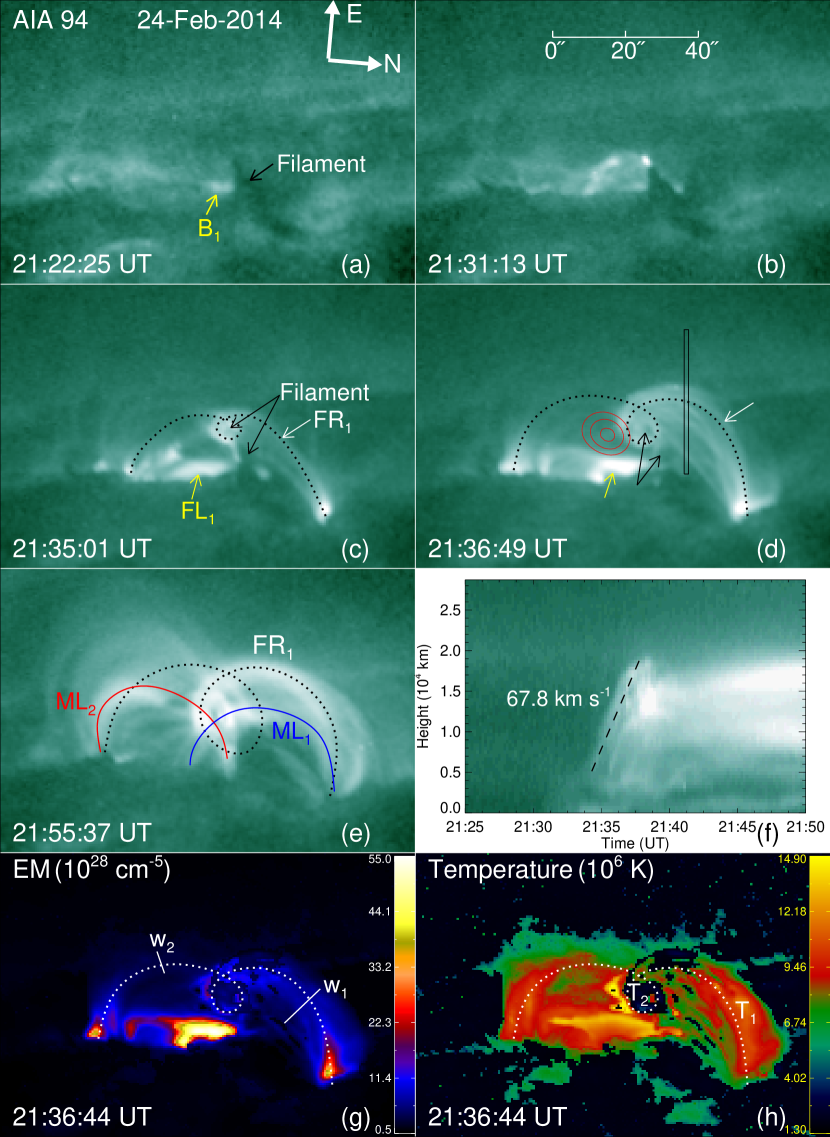
Figures 1(a)–(e) display the general evolution of the confined flare in AIA 94 Å (see animation 1 in the online journal for more details). At 21:22:25 UT, about 8 min before the start of the flare, an obvious brightening B1 appeared beneath the filament. As the flare began and developed, a twisted flux rope FR1, which is outlined by the helical dotted lines in panels (c) and (d), was observed to wrap around the filament and move upward. Meanwhile, a small flaring loop FL1 arose at almost the same location as B1. From RHESSI observations, an X-ray source in the energy range of 10–20 keV (as shown by the red contours in panel (d)) appeared between FR1 and FL1 during the flare, suggesting magnetic reconnection is very likely occurring there. The black arrows in panels (c) and (d) point to the filament. It can be seen that the filament passed through and was supported by the dip of FR1. From 21:34:22 UT to 21:37:48 UT, the top edge of FR1 rose by about 14 Mm, which derived a mean upward velocity of 67.8 km s-1. Then, its apex stopped at a projected height of 19 Mm. The kinetics of FR1 is exhibited by the time-slit map (panel (f)), which is from the AIA 94 Å images along the slit in panel (d). Panel (e) shows the complex loop structures of AR 11990 after the confined flare. Besides the twisted flux rope FR1, it appears that some other loop structures, such as ML1 and ML2, existed in the AR.
Applying the differential emission measure (DEM) method (see Cheng et al., 2012, for more details) to the AIA simultaneous data in 6 EUV wavebands, we calculated the emission measure (EM) and the temperature of AR 11990 at the peak of the confined flare, which are displayed in Figures 1(g) and (h), respectively. According to the relationship between EM and density n,
| (1) |
we estimated the density of FR1. Here, we assume that the depths of FR1 along the line of sight l are approximately equal to its widths w1 and w2, which are indicated by the solid lines in panel (g). As a result, an almost same mean value of 8.0 109 cm-3 of the density is outputted from the different widths (w19840 km and w24570 km) and the corresponding mean EMs (EM16.3 1028 cm-5 and EM23.0 1028 cm-5) along the solid lines. According to the temperature map, the plasma in the main stem of FR1 has an average temperature of T1 10 MK. However, the average plasma temperature T2 in the dip region is only 2 MK, which may be related to the cool filament material in the region wrapped by the twisted FR1.
2.3 Tether-cutting Reconnection Triggering the Ejective X4.9 Flare
As mentioned above, about 3 hr after the confined flare, the filament erupted fully from AR 11990 with a strong X4.9 class flare and a halo CME. During the interval, the loop structures in AR 11990 underwent a series of evolutions and changes, and the most remarkable observational feature is the tether-cutting reconnection which occurred between the pre-existing loop structures in the AR. In Figure 2, we provide the distinct evidences for the tether-cutting reconnection during the major solar eruption event.
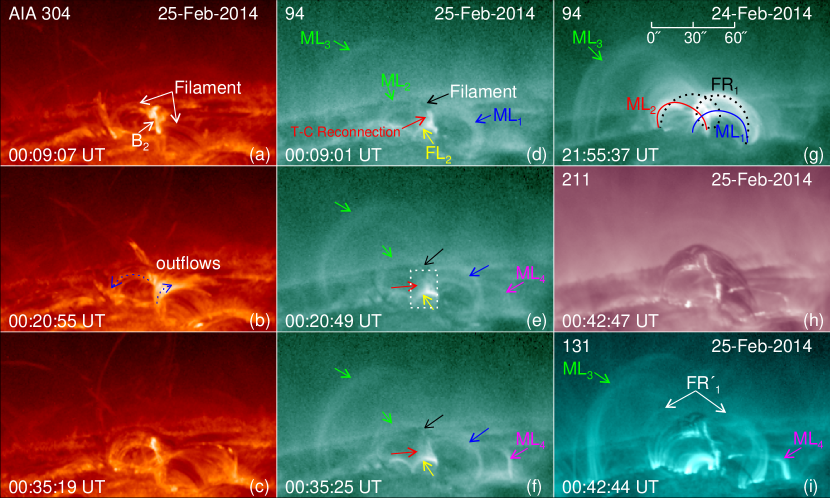
The AIA 304 Å (panels (a)–(c)) and 94 Å (panels (d)–(f)) images in Figure 2 display the evolutions of the filament and the associated magnetic loops (ML1, ML2, ML3, and ML4) before the flare. Figure 2(g) is the same AIA 94 Å image as Figure 1(e), but with a larger field of view (FOV). In the 94 Å channel, it can be clearly seen that ML1 obviously interacted with ML2 since 23:30 UT, which produced a brightening region (indicated by the red arrows) beneath the filament. Meantime, a flaring loop FL2 (indicated by the yellow arrows) appeared just below the interaction region. We also observed in 304 Å channel the associated brightening B2 (panel (a)) underneath the filament and hot mass outflows (as shown by the curved blue arrows in panel (b)) from the interaction region. As the interaction between ML1 and ML2 proceeded, some new helical lines connecting the far ends of ML1 and ML2 were gradually formed and continually added into FR1, which resulted in the twisted flux rope FR1 (indicated by the white arrows in panel (i)). Subject to magnetic pressure and tension, FR1 gradually rose up and expanded with the filament. From the movie in 94 Å (animation 2 in the online journal), we can clearly see that FR1 separated from the interaction region at the onset of the eruption and FL2 shrank downward simultaneously. All the observations described above are well consistent with the tether-cutting model (Moore et al., 2001). The interaction between ML1 and ML2 is very likely a kind of slow magnetic reconnection, which is similar to the photospheric flux cancellation (e.g., van Ballegooijen & Martens, 1989; Wang & Shi, 1993; Zhang et al., 2001), but occurred in the low corona. It cut the “tethers” constraining the filament and triggered the eruption. Additionally, one AIA 211 Å intensity image was given in panel (h) to display the fine structure of the erupting filament. The obvious spatial difference between the filament and FR1 (panel (i)) can be easily discerned.
2.4 Tether-cutting Reconnection and Kink Instability Resulting in the Filament Eruption
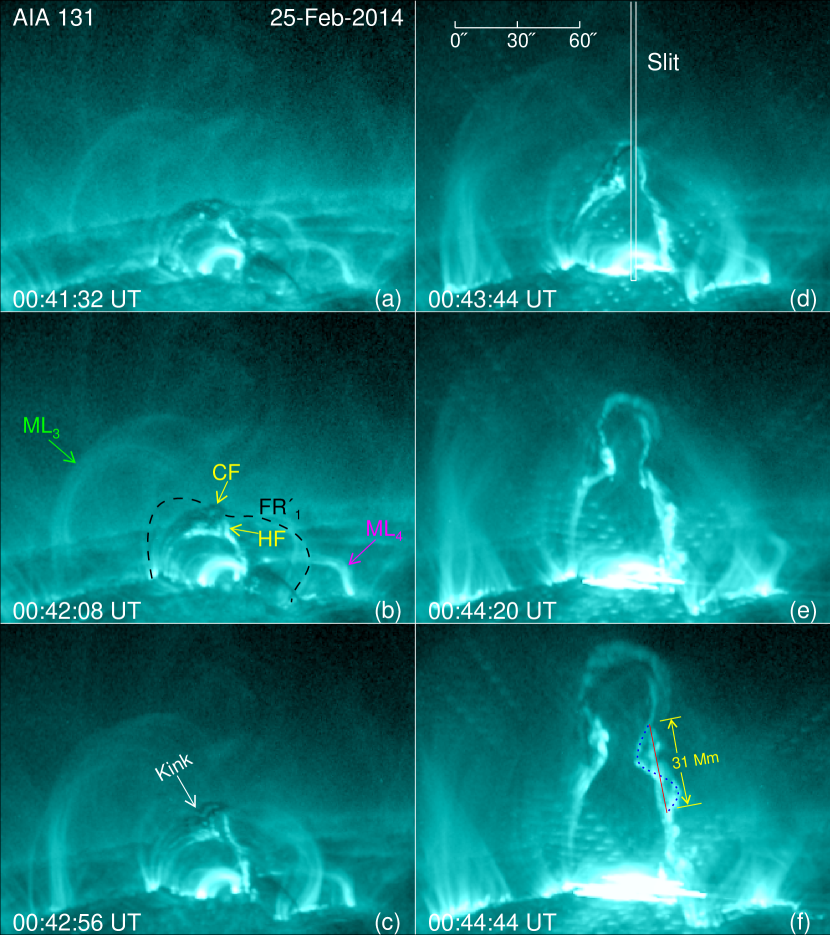
According to the multi-wavelength observations from AIA, the flux rope FR1 resulting from the tether-cutting reconnection was only visible as emission in the 94 Å and 131 Å wavebands, which indicates that the plasma in FR1 was very hot with temperatures as high as 7–11 MK. Figure 3 displays the main eruption process of the cool filament and the hot FR1 in 131 Å (see animation 3 in the online journal for more details). From panel (b), it can be seen that FR1 (outlined by the black dashed curve) passed under the filament. At the beginning of the eruption, FR1 seemed to impose an upward driving force to the filament. In the meantime, most likely due to magnetic reconnection, the filament was partially heated and appeared as both bright (hot) and dark (cool) erupting features, labeled HF and CF in panel (b), respectively. As the eruption went on, HF and CF both exhibited obvious twisted and kinked structures (see panels (c)–(f)), which suggests that the kink instability may also play a role in the destabilization of the filament.
From Figures 3(e) and (f), we can see that the filament displayed an -like erupting structure, which is quite distinct from the usual reversed-Y shape kink structure (e.g., Ji et al., 2003; Williams et al., 2005; Chen et al., 2013; Cheng et al., 2014) in morphology and rarely mentioned in previous studies. One similar observational case was reported by Romano et al. (2003) and numerically simulated by Török et al. (2010) (see Figure 12(b) in their paper). In their works, a very high magnetic twist (10–11) stored in the flux rope was proposed to explain the uncommon erupting morphology of filament. For a comparison with their results, we made an estimation. In panel (f), one helical thread (indicated by the blue dotted line) winding around the other bright threads can be clearly identified in the filament. According to our calculation, the length of the filament axis (indicated by the red line) is about 31 Mm when the helix wind around the axis in a circle; The total axis length of the filament is about 194 Mm. Thus, on the assumption of a uniform twist along the axis of the filament, a total twist of 12 is derived. This result is comparable to those reported by Romano et al. (2003) and Török et al. (2010).
Additionally, ML3 and ML4 (see Figure 3(b)) are also involved in this eruption. According to the AIA observations, ML4 seemed to twine around HF and was ejected with the filament finally; Like FR1, ML3 also passed under the top of the filament and erupted with the whole ejective system. However, due to the projection effect, it is hard to discern the connectivity of ML3 during the eruption.
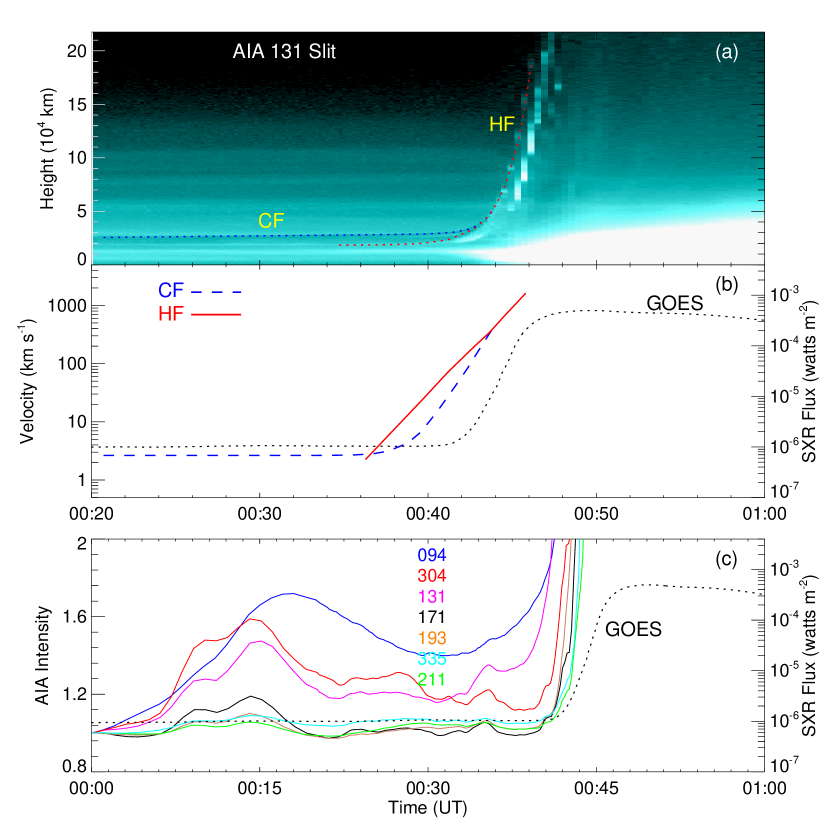
To reveal the kinetics of the filament, we made the time-slit map from the AIA 131 Å images and displayed it in Figure 4(a). Due to the limited FOV of Figure 3, the open narrow box in Figure 3(d) only indicates the lower part of the area where the slit image was made. Figure 4(a) shows the time profiles of the projected heights of CF and HF. Note that it is hard to discern the top edge of CF in the 131 Å images during its rapid rise phase, so the kinetics of CF is not clear after about 00:44 UT. It can be seen that the evolution of the filament eruption within the FOV of AIA divided into two phases: a slow rise phase and an impulsive acceleration phase. We used a function consisting of both a linear and an exponential component and a pure exponential function to fit the height-time measurements of CF and HF, respectively. The corresponding fitting results are displayed by the blue and red dotted lines in Figure 4(a). It can be found that the heights of CF and HF coincide well with the fitting curves. Exponential growth of height profile is believed to be the fundamental kinematic feature of flux rope eruption due to kink instability (e.g., Török & Kliem, 2005). In this aspect, our observations also suggest that the kink instability may play a role in driving the filament eruption. Time variations of the velocities of CF and HF were derived from the fitting results and plotted in Figure 4(b). According to the velocity curves, CF rose slowly with a mean velocity of 2.7 km s-1 prior to the flare, which was very likely caused by the tether-cutting reconnection, as reported in previous studies (e.g., Sterling et al., 2007a, 2011); As for HF, its velocity increased from tens of km s-1 to more than 1200 km s-1 during a period of 6 min, which derives an average acceleration of 3.5 km s-2.
In addition, we calculated the AIA intensity fluxes of the tether-cutting reconnection region (as indicated by the dotted box in Figure 2(e)) in seven EUV channels. For convenience, each intensity flux was divided by its initial value. In Figure 4(c), the time profiles of the GOES 1–8 Å flux (dotted line) and the AIA intensity flux in 94 Å (blue), 304 Å (red), 131 Å (purple), 171 Å (black), 193 Å (orange), 335 Å (turquoise), and 211 Å (green) are plotted. It is apparent that the intensity fluxes in all seven AIA channels, especially in the 94 Å, 304 Å and 131 Å channels, increased within the period of about 40 min before the X-class flare. The associated process of energy release is very likely to result from the tether-cutting reconnection.
3 Summary and Discussion
We presented the detailed observations of two successive flare cases occurring in NOAA AR 11990 in this work. Although one is a C5.1 confined flare and the other is an X4.9 ejective flare with a halo CME, some similar observational features, such as the preflare brightenings (B1 and B2), the small flaring loops (FL1 and FL2), and the large-scale twisted flux ropes (FR1 and FR1), both appeared in the two cases. All these observations are well consistent with the tether-cutting model (Moore et al., 2001), which strongly suggests that the two flares probably have the same triggering mechanism, i.e., tether-cutting reconnection. Compared with the other similar observations in previous reports (e.g., Kim et al., 2008; Liu et al., 2010), our observations clearly exhibit the detailed process of tether-cutting reconnection, which occurred between the inner legs of pre-existing sheared magnetic loops in the AR. To our knowledge, this is the first direct observation of tether-cutting reconnection. According to our results, the reconnection region is most evident in the AIA 94 Å channel, indicating the temperature of the plasma in the reconnection region is about 7 MK.
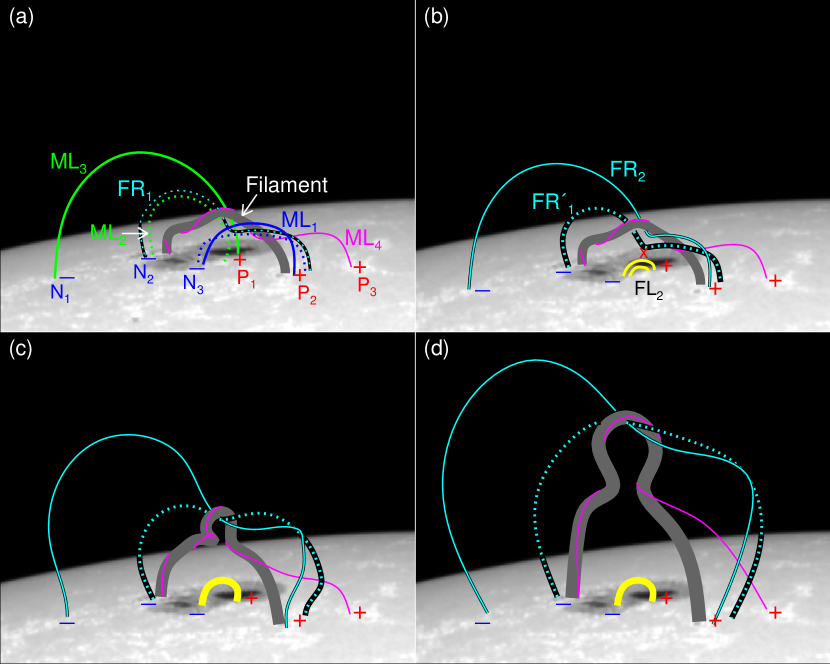
To describe the detailed process of the ejective eruption studied here, we have to think about the connectivity of ML3. According to the AIA observations, ML3 might connect with the filament, or/and ML4, or with ML1 through reconnection during the eruption. From Figure 2, it seems that the right (northern) end of ML3 was rooted in the same magnetic field region as that of ML2. Thus, we prefer to believe that the tether-cutting reconnection might also occur between ML1 and ML3 before the flare, which produced another large-scale flux rope like FR1. In Figure 5, we drew a schematic diagram on the background of HMI continuum intensity images to display this possible scenario and describe the early phase of the ejective eruption. Before the onset of the eruption, the filament was located at the PIL of the AR, and overlaid by the sheared fields ML1, ML2 and ML3, which connected the positive polarity regions P2 and P1 with the negative polarity regions N3, N2, and N1, respectively. ML4 winded around the filament with one end rooted in the positive polarity region P3. While the inner legs of ML1, ML2 and ML3 approached each other, the reconnection occurred between ML1 and ML2 and between ML1 and ML3, resulting in the formation of the flux ropes FR1 (enhanced FR1) and FR2 and the small flaring loop FL2. As the “tethers” (ML1, ML2 and ML3) were cut, the outward magnetic pressure was out-of-balance with the downward magnetic tension and then caused the whole field to expand. Meanwhile, the filament underwent an exponential rise and exhibited an -like erupting structure subject to kink instability.
References
- Amari et al. (1999) Amari, T., Luciani, J. F., Mikic, Z., & Linker, J. 1999, ApJ, 518, L57
- Amari et al. (2000) Amari, T., Luciani, J. F., Mikic, Z., & Linker, J. 2000, ApJ, 529, L49
- Chen et al. (2013) Chen, H., Ma, S., & Zhang, J. 2013, ApJ, 778, 70
- Chen (2011) Chen, P. F. 2011, Living Reviews in Solar Physics, 8, 1
- Cheng et al. (2014) Cheng, X., Ding, M. D., Zhang, J., et al. 2014, ApJ, 789, L35
- Cheng et al. (2012) Cheng, X., Zhang, J., Saar, S. H., & Ding, M. D. 2012, ApJ, 761, 62
- Green & Kliem (2009) Green, L. M., & Kliem, B. 2009, ApJ, 700, L83
- Ji et al. (2003) Ji, H., Wang, H., Schmahl, E. J., Moon, Y.-J., & Jiang, Y. 2003, ApJ, 595, L135
- Kim et al. (2008) Kim, S., Moon, Y.-J., Kim, Y.-H., et al. 2008, ApJ, 683, 510
- Kliem et al. (2004) Kliem, B., Titov, V. S., Török, T. 2004, A&A, 413, L23
- Lemen et al. (2012) Lemen, J. R., Title, A. M., Akin, D. J., et al. 2012, Sol. Phys., 275, 17
- Lin et al. (2003) Lin, J., Soon, W., & Baliunas, S. L. 2003, New A Rev., 47, 53
- Lin et al. (2002) Lin, R. P., Dennis, B. R., Hurford, G. J., et al. 2002, Sol. Phys., 210, 3
- Liu et al. (2012) Liu, C., Deng, N., Liu, R., et al. 2012, ApJ, 745, L4
- Liu et al. (2008) Liu, R., Gilbert, H. R., Alexander, D., & Su, Y. 2008, ApJ, 680, 1508
- Liu et al. (2010) Liu, R., Liu, C., Wang, S., Deng, N., & Wang, H. 2010, ApJ, 725, L84
- Moore & Labonte (1980) Moore, R. L., & Labonte, B. J. 1980, Solar and Interplanetary Dynamics, 91, 207
- Moore & Roumeliotis (1992) Moore, R. L., & Roumeliotis, G. 1992, in IAU Colloq. 133: Eruptive Solar Flares, ed. Z. Svestka, B. V. Jackson, & M. E. Machado (Lecture Notes in Physics, Vol. 399; Berlin: Springer), 69
- Moore et al. (2001) Moore, R. L., Sterling, A. C., Hudson, H. S., & Lemen, J. R. 2001, ApJ, 552, 833
- Romano et al. (2003) Romano, P., Contarino, L., & Zuccarello, F. 2003, Sol. Phys., 214, 313
- Savcheva et al. (2012) Savcheva, A. S., Green, L. M., van Ballegooijen, A. A., & DeLuca, E. E. 2012, ApJ, 759, 105
- Schou et al. (2012) Schou, J., Scherrer, P. H., Bush, R. I., et al. 2012, Sol. Phys., 275, 229
- Shen et al. (2012) Shen, Y., Liu, Y., & Su, J. 2012, ApJ, 750, 12
- Sterling et al. (2007a) Sterling, A. C., Harra, L. K., & Moore, R. L. 2007a, ApJ, 669, 1359
- Sterling & Moore (2005) Sterling, A. C., & Moore, R. L. 2005, ApJ, 630, 1148
- Sterling et al. (2007b) Sterling, A. C., Moore, R. L., Berger, T. E., et al. 2007b, PASJ, 59, 823
- Sterling et al. (2011) Sterling, A. C., Moore, R. L., & Freeland, S. L. 2011, ApJ, 731, L3
- Török et al. (2010) Török, T., Berger, M. A., & Kliem, B. 2010, A&A, 516, A49
- Török & Kliem (2003) Török, T., & Kliem, B. 2003, A&A, 406, 1043
- Török & Kliem (2005) Török, T., & Kliem, B. 2005, ApJ, 630, L97
- van Ballegooijen & Martens (1989) van Ballegooijen, A. A., & Martens, P. C. H. 1989, ApJ, 343, 971
- Vršnak (2008) Vršnak, B. 2008, Annales Geophysicae, 26, 3089
- Wang & Shi (1993) Wang, J., & Shi, Z. 1993, Sol. Phys., 143, 119
- Williams et al. (2005) Williams, D. R., Török, T., Démoulin, P., van Driel-Gesztelyi, L., & Kliem, B. 2005, ApJ, 628, L163
- Yang et al. (2012) Yang, J., Jiang, Y., Bi, Y., Li, H., Hong, J., Yang, D., Zheng, R., & Yang, B. 2012, ApJ, 749, 12
- Yurchyshyn et al. (2006) Yurchyshyn, V., Karlický, M., Hu, Q., & Wang, H. 2006, Sol. Phys., 235, 147
- Zehnder et al. (2003) Zehnder, A., Bialkowski, J., Burri, F., et al. 2003, Proc. SPIE, 4853, 41
- Zhang et al. (2001) Zhang, J., Wang, J., Deng, Y., & Wu, D. 2001, ApJ, 548, L99