Intervalence Charge Transfer Luminescence: The Anomalous Luminescence of Cerium-Doped Cs2LiLuCl6 Elpasolite.
Abstract
The existence of intervalence charge transfer (IVCT) luminescence is reported. It is shown that the so called anomalous luminescence of Ce-doped elpasolite Cs2LiLuCl6, which is characterized mainly by a very large Stokes shift and a very large band width, corresponds to an IVCT emission that takes place in Ce3+–Ce4+ pairs, from the orbital of Ce3+ to orbitals of Ce4+. Its Stokes shift is the sum of the large reorganization energies of the Ce4+ and Ce3+ centers formed after the fixed-nuclei electron transfer and it is equal to the energy of the IVCT absortion commonly found in mixed-valence compounds, which is predicted to exist in this material and to be slightly larger than 10000 cm-1. The large band width is the consequence of the large offset between the minima of the Ce3+–Ce4+ and Ce4+–Ce3+ pairs along the electron transfer reaction coordinate. This offset is approximately times the difference of Ce-Cl equilibrium distances in the Ce3+ and Ce4+ centers. It is shown that the energies of the peaks and the widths of IVCT absortion and emission bands can be calculated ab initio with reasonable accuracy from diabatic energy surfaces of the ground and excited states and that these can be obtained, in turn, from independent calculations on the donor and acceptor active centers. We obtained the energies of the Ce3+ and Ce4+ active centers of Ce-doped Cs2LiLuCl6 by means of state-of-the-art wave-function-theory spin-orbit coupling relativistic calculations on the donor cluster (CeCl6Li6Cs8)11+ and the acceptor cluster (CeCl6Li6Cs8)12+ embedded in a quantum mechanical embedding potential of the host. The calculations provide interpretations of unexplained experimental observations as due to higher energy IVCT absorptions, and allow to reinterpret others. The existence of another IVCT emission of lower energy, at around 14000-16000 cm-1 less than the emission, is also predicted.
I Introduction
Intervalence charge transfer (IVCT) is the conventional name for electron transfer between two metal sites differing only in oxidation state. Verhoeven (1996) Therefore, it is a particular case of metal-to-metal charge transfer (MMCT) in which the two metal ions involved in the redox process are identical; in other words, it is the homonuclear, symmetric MMCT. IVC The basic theory for electron transfer was formulated by Marcus Marcus (1964) and the systematic study of intervalence compounds Allen and Hush (1967); Robin and Day (1968) has played a key role in elucidating electron transfer reactions. The electron transfer between the ground states of the two metal sites can be thermally induced after passing through an activated complex with an activation energy barrier; in the activated complex the electron is equally distributed among the two metallic centers. The electron transfer can also be photoinduced. In this case, a fixed nuclei IVCT photon absorption takes place that is followed by a nonradiative decay involving nuclei reorganization; the decay passes through the activated complex and it can branch either to the original state or to the charge transfer state, which are degenerate (Fig. 1, red lines). Obviously, there cannot be any emission associated with the IVCT absorption. IVCT absorption explained the early observations of Werner Werner (1896) on the dark color of substances containing platinum in two oxidation states and it was found in a large number of mixed valence compounds, Allen and Hush (1967); Robin and Day (1968) mostly involving transition metals. The Marcus theory of electron tranfer was complemented by Hush Hush (1967, 1985) with a theory of heteronuclear MMCT and homonuclear IVCT considering a two-state problem. Piepho et al. Piepho et al. (1975) formulated a vibronic model for the IVCT absorption of the two-state problem. We are not aware of extensions of these theories to absorptions and emissions involving higher excited states of the mixed valence compounds.

The relevance of MMCT transitions in solids has been reviewed by Blasse, Blasse (1991) including IVCT absorptions in mixed-valence compounds; most of the materials involve transition metal ions. In f-element doped solids, MMCT between f-elements and the cations of the host have been considered responsible for green-blue luminescence quenching and red luminescence induction in Pr3+-doped compounds, Boutinaud et al. (2007) and a near-IR/Visible broad absorption band in Ce-doped LaPO4 has been ascribed to a Ce3+–Ce4+ IVCT absorption, van Schaik et al. (1993) for instance, but neither heteronuclear MMCT nor homonuclear IVCT have been the subject of extensive investigations.
Although the IVCT absorption is very well known in mixed valence compounds, IVCT luminescence transitions (Fig. 1 blue arrow) have never been reported, to the best of our knowledge. A series of ab initio studies on lanthanide optically active centers in solids is leading us to propose that IVCT emissions have in fact been observed in Ce-doped elpasolites and in Yb-doped fluorites, even though they have not been identified as such. We also expect these emissions to be present in Eu-doped solids and in other solids doped with f-elements in which several valence states are likely to coexist. IVCT states are also likely to be responsible for luminescence quenching in many materials. Here we report ab initio calculations on the IVCT luminescence of Ce-doped Cs2LiLuCl6. In a separate paper we report ab initio calculations on the IVCT luminescence of Yb-doped fluorites. BAR
Ce-doped Cs2LiLuCl6 elpasolite is a scintillating material that presents an anomalous luminescence. Bessière et al. (2006) Such emission is excited by the absortion but it cannot be a usual emission because its energy is much lower than its excitation (more than 9000 cm-1 lower) and its band width is very large (full width at half maximum of 4800 cm-1 at room temperature). Its intensity increases with temperature up to 250 K and decreases above it. This anomalous luminescence was also found in Cs3LuCl6:Ce [Ref. Dorenbos et al., 2003] and Cs2NaYCl6:Ce [Ref. Bessière et al., 2004]; in these materials it is quenched at room temperature but the basic mechanism is likely to be the same in all three.
In this work, we interpret the anomalous luminescence of Cs2LiLuCl6:Ce as a Ce3+ Ce4+ intervalence charge transfer emission that takes place in Ce3+–Ce4+ active pairs. This interpretation is based on wave function theory ab initio calculations on Ce-doped Cs2LiLuCl6 which involve: the and manifolds of the Ce3+ active center, and its impurity-trapped exciton (ITE); the Ce4+ closed-shell center; and the diabatic energy surfaces of the Ce3+–Ce4+ active pair along the electron transfer reaction coordinates of the ground state and excited states.
The results suggest that Ce3+-Ce4+ IVCT states might also be responsible for other not well understood features of related materials, like unassigned low-T excitation bands of Cs2NaYCl6:Ce [Ref. Duan et al., 2009] and Cs2NaYF6:Ce [Ref. Duan et al., 2011], and the anomalous behaviour of the 351 nm emission of Cs2NaYF6:Ce under various excitation wavelengths. Duan et al. (2011)
Also, it is shown that the diabatic energy surfaces of the Ce3+–Ce4+ mixed valence pairs are sufficient to provide the basic understanding of the states involved in the relevant absorptions, emissions, and nonradiative decays. They can be obtained from independent ab initio calculations in embedded monometallic clusters of the oxidized and reduced species, like (CeCl6)3- and (CeCl6)2-. The adiabatic energy surfaces, which require much more demanding calculations on embedded dimetallic clusters like (Ce2Cl12)5-, are only necessary when electronic interaction between them are expected to be significant and accurate numerical results are targeted.
II Potential energy surfaces of mixed valence active pairs
The intervalence charge transfer luminescence of Ce-doped Cs2LiLuCl6 takes place between states of Ce3+-Ce4+ mixed valence active pairs. In Secs. II.1 and II.2 we describe the basics of their adiabatic and diabatic potential energy surfaces (equivalent to the full and dashed lines in Fig. 1, respectively) and their relations.
II.1 Adiabatic potential energy surfaces
Let us consider a donor and an acceptor , which in this case will be the separated embedded clusters (CeCl6)3- and (CeCl6)2-. Let us also consider a donor-acceptor pair prior to electron transfer, , and after the electron transfer, . In the homonuclear, symmetric MMCT case, or IVCT, is and is , so that we can call the pair after the electron transfer the acceptor-donor pair . In this case, and will be the mixed valence embedded cluster (Ce2Cl12)5- with conventional left–right distributions Ce3+–Ce4+ and Ce4+–Ce3+ respectively. We are interested in the energies of the and pairs in their ground and excited states as functions of the nuclear coordinates. Since the electronic spectroscopic transitions are dominated by the totally symmetric vibrational coordinates, we will only consider the breathing modes of octahedral (CeCl6)3- and (CeCl6)2-, so that the only vibrational degrees of freedom will be the Ce-Cl distances in the left and right components of the pairs, and . For each nuclear configuration, the electronic states of the pairs result from the combinations between the individual states of and the individual states of . In this case they will be the states of the , , , and (impurity-trapped exciton) configurations of (CeCl6)3- combined with the closed-shell state of (CeCl6)2-. Besides, since both and electronic configurations are possible, the total number of adiabatic electronic states of the mixed valence pair is . Their adiabatic potential energy surfaces (equivalent to the full lines in Fig. 1) will be , . These adiabatic energy surfaces can provide basic spectroscopic data without requiring to solve the full vibronic problem, like the positions of absorption and emission band maxima via the Frank-Condon approximation, and others. In general, they result from direct quantum mechanical calculations on mixed valence dimers, which are highly demanding. Depending on the number of open-shell electrons of the lanthanide, they can be extremely demanding.
II.2 Diabatic potential energy surfaces
II.2.1 Definition
Independently of the method used for the calculation of the adiabatic potential energy surfaces, they can be considered to result from the diagonalization of a interaction matrix. The diagonal elements of the interaction matrix are the diabatic potential energy surfaces (equivalent to the dashed lines in Fig. 1) and the off-diagonal elements are the electronic couplings. The diabatic energy surfaces can cross each other and, contrary to the adiabatic, they mantain the nature of the electronic state across the crossings. The diabatic basis is arbitrary; a convenient choice is the set of generalized antisymmetric product functions McWeeny (1959, 1989) resulting from the combination of the states of and . So, from the combination of the state of , , and the state of , , we will have two diabatic wavefunctions: one for the state of , , and one for the state of , ( is a normalization constant and is the inter-group antisymmetrization operator McWeeny (1959)). Their expected values of the fixed nuclei Hamiltonian of the embedded pair , are the two corresponding diabatic potential energy surfaces and : , . Their electronic coupling is . Note that .
We must remark now that, if the full vibronic problem of the mixed valence pair needed to be solved, both the adiabatic basis and the diabatic basis , would be valid alternatives leading to the same vibronic energies and wavefunctions. If, instead, the focus is on some relevant features of the electronic spectra like zero-phonon lines, absorption and emission band maxima and band widths, etc., or of the electronic states of the mixed valence pair, like equilibrium structures, activation energy barriers, etc., the adiabatic energy surfaces are the valid ones and the diabatic energy surfaces are an approximation to them. Let us briefly discuss on the limits of the diabatic approximation.
In the regions of the nuclear configuration space where the electronic couplings are not very large, the adiabatic and diabatic energy surfaces are close, each adiabatic wavefunction is very similar to one of the diabatic wavefunctions, and a particular or character can be associated with it. E.g., for and values respectively close to the Ce-Cl equilibrium distance of the Ce3+ donor site and of the Ce4+ acceptor site, one of the adiabatic energies will be close to and another to ; will be the lowest of the two because both the donor and the acceptor are structurally relaxed, and will be the highest of the two because both the donor and the acceptor are structurally stressed, each of them being in the equilibrium structure of the other. This is an important observation because the calculations of the diabatic energy surfaces, which can be hihgly demanding, are always significantly less demanding than the calculations of the adiabatic ones.
In the regions of the nuclear configuration space near crossings of diabatic energy surfaces, e.g. near the activated complex where , the electronic couplings have larger effects and produce avoided crossings. The crossing diabatic states are then replaced by a lower adiabatic state with a smaller thermal energy barrier, plus an upper adiabatic state which has become stable at the configuration where the electron is equally distributed among the two metals (see Fig. 1). In these regions, the adiabatic results are necessary when quantitative energy barriers or quantitative nonradiative dynamics are targeted. Many of the spectroscopic features of the mixed valence pairs can however be addressed quantitatively or semiquantitatively with the diabatic energy surfaces only. We describe next how they can be computed.
II.2.2 Approximations
The diabatic pair energies are the sum of the donor and acceptor energies plus their mutual Coulomb and exchange interaction. McWeeny (1989) The latter should be almost independent of the donor and acceptor states, in general. Hence, we can write:
| (1) |
In Eq. 1, and include the embedding interactions of and with the crystalline environment of the pair in Cs2LiLuCl6. We aim at computing by means of embedded cluster calculations and we can think of two alternative computational strategies: In one of them, the symmetry reductions around and due to the presence of the other ( and respectively) are considered from the very beginning. In the other, they are removed in a first step and they are considered later, at the same time that the electronic couplings, i.e. when the adiabatic surfaces are calculated. The strength of the first approach is to be able to give energy splittings driven by symmetry lowering, which are dependent on the distance and relative orientation between and . The strength of the second approach is to be able to give the basics of the energy surfaces by means of independent calculations on the embedded and . These alternatives are as follows:
1) One calculation 1D of the donor (CeCl6)3- embedded in a Cs2LiLuCl6 lattice in which one Lu3+ ion is substituted by a Ce4+ ion gives . Another calculation 1A of the acceptor (CeCl6)2- embedded in a Cs2LiLuCl6 lattice in which one Lu3+ ion is substituted by a Ce3+ ion gives . Then, . Here, and depend on the relative positions of and . is dominated by the long-range Coulomb interactions, so that, except for short donor-acceptor distances, . According to this alternative we have:
| (2) |
with
| (3) |
2) One calculation 2D of the donor (CeCl6)3- embedded in a Cs2LiLuCl6 lattice gives , where stands for the Coulomb and exchange interaction energy between the donor (CeCl6)3- and the cluster with the original host cation C (Lu3+ in this case), (LuCl. Another calculation 2A of the acceptor (CeCl6)2- embedded in a Cs2LiLuCl6 lattice gives , where stands for the Coulomb and exchange interaction energy between the acceptor (CeCl6)2- and the cluster with the original host cation, (LuCl. Then, . Here, and are independent of the relative positions of and . Except for short cation-cation distances, . According to this alternative we have:
| (4) |
with
| (5) | |||||
Summarizing, the diabatic potential energy surfaces will be given by:
| (6) |
with donor and acceptor energies and obtained in embedded cluster calculations 1D and 1A and the term , which is common to the and energy surfaces, given by Eq. 3 (alternative 1), or with donor and acceptor energies obtained in embedded cluster calculations 2D and 2A and the common term given by Eq. 5 (alternative 2). Alternative 1 has into account the effects of charge substitutions in the original lattice on the energy levels of and . In the present case, the most important ones are expected to be the splittings produced on the (CeCl6)3- levels. They should be responsible for fine features of the spectra, but not for the number and positions of the main absorption and emission bands. In any case, this alternative implies site symmetry reduction, which may add significant computatioanl effort. Alternative 2 neglects these effects. It has, however, an important computational advantage: the diabatic potential energy surfaces of the mixed valence pairs are computed using the energy curves of the donor and acceptor centers embedded in the original host lattice, i.e. of the clusters (CeCl6)3- and (CeCl6)2- embedded in Cs2LiLuCl6 in our case. We must remark that, regardless of the alternative used, the term is common to the and energy surfaces and to all states of both. Its effect is a common shift of all of them and, consequently, it does not contribute to energy differences between them. In this work we have adopted alternative 2.
II.2.3 Topology

The diabatic potential energy surfaces of the and mixed valence pairs in their ground states, and , are shown in Fig. 2 for our case. An equivalent result is found for any pair of and excited state surfaces, so that the following discussion also holds for them. The diabatic energy surfaces correspond to the (CeCl6)3-–(CeCl6)2- pair (red surface) and to the (CeCl6)2-–(CeCl6)3- pair (blue surface), respectively. Their respective minima are found where the left and right distances and take the values of the donor (CeCl6)3- and acceptor (CeCl6)2- ground state Ce-Cl equilibrium distances, and (2.660 Å and 2.542 Å in our case; see below), and viceversa: () and (). The energies at the minima are equal: .
The and diabatic surfaces are degenerate along the = line. So, the diabatic activated complex of the electron transfer reaction, which is the crossing point between the two surfaces with lowest energy, can be found by minimization of any of the two surfaces along the = line. (Strictly speaking, the activated complex is the full = line, but here we will use the term only for its most stable structure.) In the diabatic activated complex, which is expected to be close to the adiabatic, the left and right distances take a common value . In our case, the minimum is found at a common Ce-Cl distance of the donor (CeCl6)3- and the acceptor (CeCl6)2- of =2.599 Å.
A fairly good estimation of can be obtained from the harmonic approximation of the diabatic surfaces. In this approximation, the activated complex is found at , and being the vibrational frequencies of and ground states respectively. In other words, would be the -weighted average of donor and acceptor equilibrium distances. If equal values for the vibrational frequencies of donor and acceptor are assumed, as it is done in the vibronic model of Piepho et al., Piepho et al. (1975) is the simple average, . Since the acceptor has a higher force constant than the donor, should be close to the average of and but closer to than to . The values =313 cm-1 and =355 cm-1 found in the present ab initio calculations (see below) give =2.594 Å for the different-frequencies harmonic approximation and =2.601 Å for the equal-frequencies harmonic approximation. Both of them are close to the found =2.599 Å, although, interstingly, the latter is closer. It is a manifestantion of the fact that anharmonicity increases the Ce-Cl distance of the activated complex, as it does with the equilibrium distances of donor and acceptor. It means that there is a compensation of the errors due to assuming equal force constants and neglecting anharmonicity.
The diabatic electron transfer activation energy is . It is independent of the distance between donor and acceptor (within approximation 2 of Sec. II.2.2) and it is an upper bound of the adiabatic activation energy, which is -dependent.
The ground state diabatic electron transfer reaction coordinate can be aproximated with the straight lines that connect the activated complex with the two minima and . This reaction coordinate is represented in Fig. 2 in the - plane. The pair has the lowest diabatic energy in the left side of the activated complex () and the pair in the right side (), in correspondance with the larger size of at equilibrium. The lowest and highest diabatic energies along the reaction coordinate are shown in Fig. 2 with full and dashed lines, respectively, drawn on the surfaces. Since these lines contain the most interesting information of the diabatic energy surfaces, it is convenient to plot them in energy diagrams along the reaction coordinate (as the dashed lines in Fig. 1) instead of the more cumbersome energy surfaces, i.e. vs. instead of vs. ().
For a precise definition of , we can recall that the changes of the Ce-Cl distances in the left and right clusters and along the reaction coordinate fulfil
| (9) |
Then, the normal reaction coordinate can be written as
| (10) |
and being the normal breathing modes of the left and right CeCl6 moieties with respect to their structures in the activated complex:
| (11) |
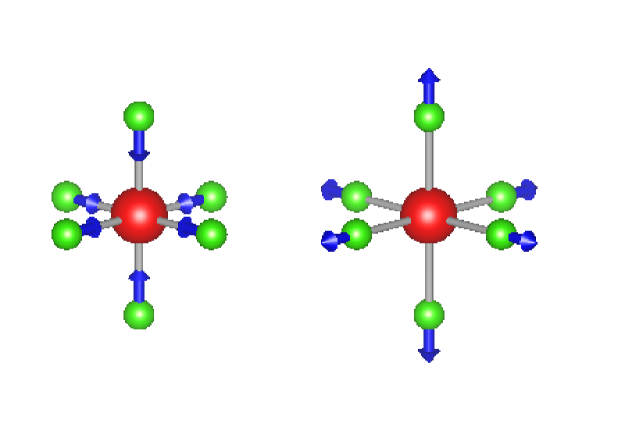
which have been expressed in terms of the displacements and of the chlorine atoms in the left and right CeCl6 moieties away from their respective Ce atoms, starting from the positions they occupy in the activated complex. A graphical representation of the Cl displacements along is shown in Fig. 3.
|
Since the left and right cluster breathings imply and , we can write
| (12) |
and
| (13) | |||||
We may mention the relationship betweem this reaction coordinate and the one of the vibronic model of Piepho et al. Piepho et al. (1975) The latter correspons to , which implies and gives = . We observed that this is a rather good approximation in our case.
III Details of the quantum mechanical calculations
In this Section we describe the details of the quantum mechanical calculations of the () and () components of the mixed valence pair energies in Eq. 6. As donor and acceptor we adopted, respectively, the (CeCl6Li6Cs8)11+ and (CeCl6Li6Cs8)12+ clusters. We performed ab initio wave function theory embedded cluster quantum chemical calculations on these clusters embedded in the Cs2LiLuCl6 elpasolite host with the MOLCAS suite of programs. Karlström et al. (2003) The calculations include bonding interactions, static and dynamic electron correlation effects, and scalar and spin-orbit coupling relativistic effects within the clusters, which are treated at a high theoretical level. They also include Coulomb, exchange, and Pauli repulsion interations between the host and the clusters, which are considered at a lower theoretical level by means of a quantum mechanical embedding potential. Electron correlation effects between the cluster and the host are excluded from these calculations.
The embedded cluster calculations are two-step spin-orbit coupling SA-CASSCF/MS-CASPT2/RASSI-SO DKH calculations. In the first step, we used the many-electron scalar relativistic second-order Douglas-Kroll-Hess (DKH) Hamiltonian. Douglas and Kroll (1974); Hess (1986) In Cs2LiLuCl6:(CeCl6Li6Cs8)11+, we performed state-average complete-active-space self-consistent-field Roos et al. (1980); Siegbahn et al. (1980, 1981) (SA-CASSCF) calculations with the active space that results from distributing one active electrons in 13 active molecular orbitals with main character Ce , , and . The equivalent calculation in Cs2LiLuCl6:(CeCl6Li6Cs8)12+ is a closed-shell Hartree-Fock SCF calculation. These calculations provided occupied and empty molecular orbitals to feed subsequent multi-state second-order perturbation theory calculations (MS-CASPT2), Andersson et al. (1990, 1992); Zaitsevskii and Malrieu (1995); Finley et al. (1998) where the dynamic correlation of the Ce , Cl , and Cs electrons was taken into account. We used the standard IPEA value (0.25 au). G. Ghigo, B. O. Roos, and P.-Å. Malmqvist (2004)
In the second step, we included spin-orbit coupling effects by adding the Atomic Mean Field Integrals approximation (AMFI) of the DKH spin-orbit coupling operator Hess et al. (1996) to the scalar relativistic Hamiltonian. In this step, we used the spin-free-state-shifting operator as a means to combine spin-orbit couplings calculated with statically correlated wave functions and spin-orbit free energies calculated with dynamic correlation Llusar et al. (1996) and, accordingly, we performed restricted-active-space state-interaction spin-orbit calculations (RASSI-SO) Malmqvist et al. (2002); Paulovic et al. (2003) with the transformed CASSCF wave functions (first-order wave functions of the MS-CASPT2 method) and the MS-CASPT2 energies.
We considered nuclear configurations of the clusters with varying Ce-Cl distance. The calculations were performed using the abelian symmetry group. The spin-orbit coupling states of the donor (CeCl6Li6Cs8)11+ are the following Kramers doublets: For the ungerade configuration, one double degenerate of character, two double degenerate of and characters, and two quadruple degenerate of and characters; for the gerade and configurations, one double degenerate of character, one double degenerate of characters, and two quadruple degenerate of and characters. The closed-shell acceptor (CeCl6Li6Cs8)12+ has one state of character.
We used the following gaussian basis set: All-electron atomic natural orbital (ANO) relativistic basis sets for cerium, Roos et al. (2008) chlorine, Roos et al. (2005) and lithium, Roos et al. (2003) with respective contractions ()/[], ()/[], and ()/[]. For cesium, we used a [Cd]-core ab initio model potential (AIMP) Huzinaga et al. (1987) that was obtained in this work from the ,, relativistic core ANOs of Ref. Roos et al., 2003, and a valence basis set from the same reference with the contraction ()/[].
The Hamiltonian of the (CeCl6Li6Cs8)11+ and (CeCl6Li6Cs8)12+ clusters was supplemented with the AIMP embedding potential Barandiarán and Seijo (1988) of Cs2LiLuCl6, which has been obtained in this work. This embedding potential is made of: 1) total-ion embedding AIMPs representing Cs+, Li+, and Lu3+ cations and Cl- anions, which are located at experimental sites of the Cs2LiLuCl6 lattice, within a cube made of unit cells and centered on Lu3+, and 2) a set of 25271 additional point charges situated at lattice sites, generated by the zero-multipole method of Gellé and Lepetit, Gellé and Lepetit (2008) which closely reproduce the Ewald potential Ewald (1921) within the clusters. The experimental crystal structure of Cs2LiLuCl6 (Ref. Meyer et al., 1986) is the following: Space group number 225, Fm3m cubic; lattice constant =10.409 Å, x(Cl)=0.2483. The embedding AIMPs have been obtained in self-consistent embedded-ions (SCEI) Seijo and Barandiarán (1991) Hartree-Fock (HF) calculations.
The [Cd]-core AIMP of Cs and the embedding AIMP of Cs2LiLuCl6 produced in this work are available from the authors AIM and are included in the supplementary material.
IV Results and discussion
In this Section we discuss the results of the calculations, which we use for a better understanding of the excited states of Ce-doped Cs2LiLuCl6. We ultimately show that the never reported IVCT luminescence has in fact been observed in this material. For convenience, we summarize first the experimental energies of the excited states in Sec. IV.1. We discuss in Sec. IV.2 the states that are associated with the Ce3+ active center and in Sec. IV.3 those associated with the Ce3+-Ce4+ active pairs, which are ultimately responsible for the IVCT luminescence.
IV.1 Excited states of Ce-doped Cs2LiLuCl6
The experimental energies of the excited states of Ce-doped Cs2LiLuCl6 after Ref. Bessière et al., 2006 are summarized in the first four columns of Table 1. In the last three columns we summarize the results of this work, which are discussed below in detail.
| Experiment | This work | |||||
| Feature | nm | cm-1 | Assignment | Assignment | Process | cm-1 |
| Emission spectrum peaks (with excitation) | ||||||
| E1 | 405,372 | 24700,26900 | same | 2 | 20200-23300 | |
| E2 | 275 | 36400 | anomalous state | IVCT Ce3+ Ce4+sts | 7 | 32000-35300 |
| (257-293)111Full width at half maximum at 290 K. | (34100-38900)111Full width at half maximum at 290 K. | |||||
| Excitation spectrum peaks (monitoring emission) | ||||||
| A1 | >330 | <30300 | same | 1 | 24500, 25700 | |
| A2 222Absent at low temperature. | 216.5,210 | 46190,47600 | (JT split) | same | 3 | 46100 |
| (45300,46900) 333A 1600 cm-1 splitting between the two peaks of the Jahn-Teller split absorption is calculated at room temperature out of (Reference Bersuker, 1984). | ||||||
| A3 | 303 | 33000 | unassigned | IVCT Ce3+ Ce4+sts | 8 | 31010,32170 |
| A4 | 280 | 35700 | lower symmetry Ce3+ | |||
| A5 | 264,243 | 37900,41200 | lower symmetry Ce3+ | |||
| A6 | 198 | 50500 | host self-trapped exciton | |||
| A7 | 182 | 54900 | impurity-trapped exciton | IVCT Ce3+ Ce4+sts | 6 | 56240 |
| A8 | 176 | 56800 | free excitons | 5 | 59190 | |
| Excitation spectrum peaks (monitoring the anomalous emission) | ||||||
| A2 | 216.5,210 | 46190,47600 | (JT split) | same | 3 | 46100 |
| (45300,46900) 333A 1600 cm-1 splitting between the two peaks of the Jahn-Teller split absorption is calculated at room temperature out of (Reference Bersuker, 1984). | ||||||
| A9 | 184 | 54300 | IVCT Ce3+ Ce4+sts | 6 | 56240 | |
| A10 | 174 | 57500 | 5 | 59190 | ||
| Non-observed transitions | ||||||
| emission | 4 | 43000-46030 | ||||
| IVCT emission Ce3+ Ce4+sts | 13500-16800 | |||||
| IVCT absorption Ce3+ Ce4+sts | 9 | 10000-13300 | ||||
The manifold of excited states is made of: states associated with the , , and configurations of Ce3+, an impurity-trapped exciton (ITE) also associated with Ce3+, and self-trapped exciton and free exciton host states. Besides them, an anomalous state has been found neccesary to explain an anomalous emission. Bessière et al. (2006) Interesting features of the anomalous emission are: it is excited by absortions but not by excitations to the host conduction band, its energy is much lower than its excitation (large Stokes shift) and higher than the absortions, it is a much wider band than the regular Ce3+ emissions, and its intensity increases with temperature up to 250 K and decreases above this. In order to understand these properties, the existence of an anomalous state that emits to the ground state was suggested. Bessière et al. (2006) This state would have an energy itermediate between the and manifolds and it would be populated after an auto-ionization of the electron from to the conduction band such that it would remain near Ce. The true nature of the anomalous state ramained not fully clear. Bessière et al. (2006)
IV.2 Ce3+ active center
The energy levels of the (CeCl6Li6Cs8)11+ cluster embedded in Cs2LiLuCl6 resulting from the spin-orbit coupling ab initio calculation are represented in Fig. 4 as a function of the Ce-Cl distance along the breathing mode of the CeCl6 moiety.

|
We include in the Figure the total energy of the (CeCl6Li6Cs8)12+ embedded cluster in the same energy scale. This means that the energy difference between the ground state of Ce4+ center (dashed red line) and the () state of Ce3+ center (lowest full black line) corresponds to the ionization potential of Ce3+, not to the conduction band of the host, but to the vacuum. Equilibrium Ce-Cl bond lengths and breathing mode vibrational frequencies of all states, adiabatic transition energies (minimum-to-minimum), and vertical (or Frank-Condon) transitions energies calculated at significant values of , are given in Table 2.
The calculations give standard and manifolds, like in Cs2NaYCl6:Ce3+ (Ref. Tanner et al., 2003), and a high energy impurity-trapped exciton state, like those previously found in Cs2GeF6:U4+ (Ref. Ordejón et al., 2007) and SrCl2:Yb2+ (Ref. Sánchez-Sanz et al., 2010). They support the assignments of the so called normal features of the excitation and emission spectra made in Ref. Bessière et al., 2006.
The absorption and emission (1 and 2 in Fig. 4 and Table 2) are calculated at 24500-25700 cm-1 and 20200-23350 cm-1 respectively. The emission is split in two bands, one with three components peaking at 20200-21000 cm-1 due to the crystal-field splitting of -, and anoher with two components peaking at 22750-23350 cm-1 due to the crystal-field splitting of -. In Fig. 5a we show the simulation of the shape of these absortion (blue lines) and emission (green lines) bands. They have been calculated using the semiclassical time-dependent approach of Heller Heller (1975, 1981); Zink and Shin (1991) assuming harmonic vibrations on the initial and final electronic states. We used a common vibrational frequency of 316 cm-1 and the oscillator strengths computed at the respective equilibrium geometries of the ground state (absorption) and the respective excited states (emissions), which are shown in Table 4 of Additional Material. Experimentally, was found below 30300 cm-1 in the excitation spectrum (its maximum was not reported) and split in two bands peaking at 24700 and 26900 cm-1 in the emission spectrum (A1 and E1 in Table 1).
The absorption (3 in Fig. 4 and Table 2) is calculated as centered at 46100 cm-1, split by an Jahn-Teller coupling with Jahn-Teller energy =1670 cm-1. In the excitation spectrum, this transition was found as a Jahn-Teller split band with peaks at 46190 and 47600 cm-1 (A2 in Table 1). The position of the band is well reproduced and its splitting corresponds to a Jahn-Teller energy not far from the calculated one. The emission (4 in Fig. 4 and Table 2) is calculated split in two bands: one with peaks at 43000-43700 cm-1 and another with peaks at 45500-46000 cm-1. In Fig. 5b we show the simulation of the shape of these absortion (blue lines) and emission (green lines) bands, without considering the effects of the Jahn-Teller coupling and using the oscillator strengths of Table 4 of Additional Material. This emission was not found experimentally, which was interpreted as due to non-radiative decay to an anomalous state. Bessière et al. (2006) The lack of this emission in Ce-doped Cs2LiYCl6 was interpreted in the same way Bessière et al. (2004); in Ce-doped Cs2NaYCl6 the responsibility of Pr3+ and/or Nd3+ killer sites, which are present in low concentrations and absorb in the same energy region, was considered instead. Tanner et al. (2003) In overall, the calculations of the manifold underestimate the energy of and give a good energy of ; this indicates an overestimation of the crystal-field splitting () together with an underestimation of the barycenter. energy underestimations of 2500 cm-1 and good energies were previously found in similar calculation on Ce-doped Cs2NaYCl6 (Ref. Tanner et al., 2003).
| (Å) | |||||||||
| Branch | State | Te | 2.660 | 2.618 | 2.669 | 2.555 | 2.542 | ||
| A Ce3+ | (2) | (4) | (6) | ||||||
| () | 2.660 | 313 | 0 | 0 | -23340 | -46030 | -52050 | -34880 | |
| () | 2.662 | 314 | 530 | 540 | -22740 | -45500 | -51360 | -34160 | |
| () | 2.660 | 314 | 2340 | 2340 | -21010 | -43690 | -49720 | -32550 | |
| () | 2.662 | 314 | 2800 | 2800 | -20490 | -43230 | -49120 | -31920 | |
| () | 2.663 | 314 | 3040 | 3040 | -20220 | -43000 | -48800 | -31590 | |
| B Ce3+ | (1) | ||||||||
| () | 2.618 | 318 | 23930 | 24500 | 0 | -21290 | -30620 | -13860 | |
| () | 2.618 | 319 | 25120 | 25710 | 1190 | -20080 | -29460 | -12710 | |
| C Ce3+ | (3) | ||||||||
| () 111The calculation of the Jahn-Teller coupling of the () state gives a equilibrium structure with the following data: =0.081 Å, =2.831 Å, =2.588 Å, =228 cm-1, =1670 cm-1, T=44190 cm-1, and an energy barrier between equivalent minima of 1200 cm-1: T=45390 cm-1. | 2.669 | 322 | 45860 | 46070 | 22910 | 0 | -5780 | 11370 | |
| D Ce3+ ITE- | (5) | ||||||||
| () | 2.555 | 325 | 55810 | 59190 | 33220 | 13690 | 0 | 16170 | |
| Ce4+ + (vacuum) | |||||||||
| () | 2.542 | 355 | 39690 | 44870 | 18050 | -420 | -16050 | 0 | |

|
A weak broad band in the excitation spectra peaking at 182 nm (54900 cm-1) was assigned to an impurity-trapped exciton and next to it, at 176 nm (56800 cm-1), another more intense but still weak broad band was assigned to free excitons Bessière et al. (2006) (A7 and A8 in Table 1). The calculations give a state of ITE- character 55800 cm-1 above the ground state, with the maximum of the absorption band at 59200 cm-1 (5 in Fig. 4 and Table 2). This state has an equilibrium Ce-Cl distance of 2.555 Å, which is much shorter than in the , and states and not far from the 2.542 Å of the Ce4+ center. Its vibrational frequency (325 cm-1) is only slighlty larger than in the , and states and it does not get as close to the 355 cm-1 of the Ce4+ center. Its emission is predicted at 48800-52050 cm-1 (6 in Fig. 4 and Table 2). In Fig. 5c we show the simulation of the shape of these absortion (blue lines) and emission (green lines) bands. The oscillator strengths of Table 4 of Additional Material have been used for the emisson band. The absorption is electric dipole forbidden in symmetry and we used an arbitrary oscillator strength. In this way we are able to see the band shape, which is made of a very long vibrational progression; note, however, that the intensities of the absorption and emission band in Fig. 5c cannot be compared.
The calculations of the Ce3+ center do not give any state that could be considered responsible for the very broad emission at 36400 cm-1. This is so in spite of the fact that the basis sets and spaces used in the calculations are flexible enough to reveal the existence electron-hole electronic structures, like those associated so far with the excited states responsible for anomalous luminescence in lanthanide-doped crystals, should they occur.McClure and Pédrini (1985); B. Moine, B. Courtois and Pédrini (1989); Dorenbos (2003)
IV.3 Ce3+–Ce4+ active pair
It is not uncommon that Ce4+ is present in Ce3+-doped solids. van Schaik et al. (1993) Having in mind the possibility that this is the case in Ce3+-doped elpasolites, we discuss in this Section the basics of the electronic structure of the Ce3+–Ce4+ pairs in Ce-doped Cs2LiLuCl6. We show what absorptions and emissions can take place that are associated with these pairs and cannot be present in single Ce3+ active centers. In particular, we focus on the intervalence charge transfer luminescence that can be responsible for the so called anomalous luminescence of this material.
The diabatic potential energy surfaces of the ground and excited states of the Ce3+–Ce4+ active pair as functions of the Ce-Cl distances in the left and right CeCl6 moieties have been calculated using Eq. 6 as described in Sec. II.2. Those of the ground state are shown in Fig. 2. Their main features are summarized in Table 3. The energies of the states as functions of the ground state electron transfer reaction coordinate are shown in Fig. 6. In Fig. 7 of Additional Material we represent them as functions of the electron transfer reaction coordinates of excited states. Let us briefly describe the meaning of the notation in these Figures and in Table 3.

|


|

|
The brach contains the [,] electronic states of the Ce3+–Ce4+ pair. The branch contains the states of the Ce4+–Ce3+ pair that result from the branch after electron transfer from Ce3+ to Ce4+. The thermal conversion of the states into states are the electron transfer reactions
which involve energy barriers. The diabatic barriers shown in Fig. 6 are upper bounds of the adiabatic barriers that result after consideration of the electronic couplings. The branch represents the stressed states, i.e. the [,] states of the Ce3+–Ce4+ pair with structures close to the equilibrium structure of the Ce4+–Ce3+ pair in [,] states. Equivalently, the branch represents stressed states after electron transfer from the branch, i.e. the [,] states of the Ce4+–Ce3+ pair with structures close to the equilibrium structure of the [,] states of the Ce3+–Ce4+ pair. Going from branch to is the non-radiative decay of the [,] states to their equilibrium structure, which involves the release of the reorganization energy. Obviously, this is energetically equivalent to the non-radiative decay of the [,] states, i.e. going from branch to . The vertical transitions from branch to are the intervalence charge transfer absorptions, which take place with fixed nuclei positions (7 in Fig. 6 and Table 3)
They would inmediatly be followed by the non-radiative decay to , which involves the simultaneous relaxation of the coordination shells of Ce4+ and Ce3+,
| Absorption and emission peaks | |||||
|---|---|---|---|---|---|
| ,: | 2.660,2.542 | 2.618,2.542 | 2.669,2.542 | 2.555,2.542 | |
| absorption | emission | emission | ITE emission | ||
| Initial state [Ce3+,Ce4+]: | (), | (), | (), | (), | |
| Branch | Final state | ||||
| (2) | (4) | (6) | |||
| [Ce3+(),Ce4+] | Ce3+ | Ce3+ | Ce3+ | Ce3+ ITE- | |
| 0 | 23340 | 46030 | 52050 | ||
| 540 | 22740 | 45500 | 51360 | ||
| 2340 | 21010 | 43690 | 49720 | ||
| 2800 | 20490 | 43230 | 49120 | ||
| 3040 | 20220 | 43000 | 48800 | ||
| (7) | (10) | (11) | |||
| [Ce4+,Ce3+()]sts | Ce3+ Ce4+ | Ce3+ Ce4+ | Ce3+ Ce4+ | Ce3+ITE- Ce4+ | |
| 10000 | 16820 | 35290 | 50920 | ||
| 10720 | 16100 | 34570 | 50200 | ||
| 12330 | 14490 | 32960 | 48590 | ||
| 12950 | 13870 | 32340 | 47970 | ||
| 13290 | 13530 | 32000 | 47630 | ||
| (1) | |||||
| [Ce3+(),Ce4+] | Ce3+ | ||||
| 24500 | 0 | 21290 | 30620 | ||
| 25710 | 20080 | 29460 | |||
| (8) | |||||
| [Ce4+,Ce3+()]sts | Ce3+ Ce4+ | ||||
| 31010 | 14280 | 29910 | |||
| 32170 | 13120 | 28750 | |||
| (3) | |||||
| [Ce3+(),Ce4+] | Ce3+ | ||||
| 46070 | 0 | 5780 | |||
| (9) | |||||
| [Ce4+,Ce3+()]sts | Ce3+ Ce4+ | ||||
| 56240 | 4680 | ||||
| (5) | |||||
| [Ce3+(ITE-),Ce4+] | Ce3+ ITE- | ||||
| 59190 | 0 | ||||
| [Ce4+,Ce3+(ITE-)]sts | |||||
| 61050 | |||||
| Branch crossings | |||||
| Branch pair and energy barrier | - 2600 | - 1100 | - 2900 | - 50 | |
| 2.599 | 2.578 | 2.600 | 2.548 | ||
| Branch pair and energy barrier | - 5800 | - 5100 | - 1100 | ||
| , | 2.70, 2.45 | 2.79, 2.49 | 2.56, 2.49 | ||
The , , and related branches are equivalent to the ones, but referred to the states of Ce3+ of the configuration, the configuration, and the ITE- impurity trapped excitonic character, respectively.
In Fig. 6 and Table 3 we have indicated the photo-processes that take place in the Ce3+ active center and are responsible for observed spectroscopic features, as discussed in the previous section: The , , and ITE- absorptions (1, 3, 5), and the emission (2).
IV.3.1 IVCT absorptions
More interesting now are the photo-processes that involve intervalence charge transfer between Ce3+ and Ce4+. In Fig. 6 they correspond to vertical lines starting in the minimum of one branch (, , , , , , , ), drawn with full lines, and ending in one of the stressed branches (, , , , , , , ), drawn with dashed lines. We have indicated three of them in Fig. 6. All of these transitions give very broad bands because of the large offsets between the minima of their corresponding energy surfaces: and , and , etc. These offsets are given by , with the equilibrium coordinates of the final and initial state and given by Eq. 13. The values of these horizontal offsets are given in Table 5 of Additional Material. They are approximately equal to , and being the Ce-Cl bond length changes experienced by the Ce4+ acceptor center (right) and the Ce3+ donor center (left) in the IVCT transition, which, in turn, is about times the difference of Ce-Cl equilibrium distances in the Ce3+ and Ce4+ centers.
Absorption 7, , or [Ce3+(),Ce4+]eq [Ce4+,Ce3+()]sts, is the photoinduced electron transfer commonly found in mixed valence compounds, Werner (1896); Allen and Hush (1967); Robin and Day (1968) i.e. the IVCT absorption. It has been reported in Ce3+-doped LaPO4 by Van Schaik et al. van Schaik et al. (1993) It corresponds to the vertical one-electron orbital transition Ce3+ Ce4+ and it is followed by a strong nuclei reorganization around Ce4+ and Ce3+ in which all the IVCT absortion energy is released: [Ce4+,Ce3+()]sts [Ce4+,Ce3+()]eq, The present calculations predict it for the Ce3+–Ce4+ pair in Cs2LiLuCl6 as a very broad band peaking at about 10000-13300 cm-1, which can also occur in other chloroelpasolites. The large width of this band is associated with the large offset between the minima of the and energy surfaces, which is here found to be of about 0.41 Å (cf. Table 5 of Additional Material).
Absorption 8, , or [Ce3+(),Ce4+]eq [Ce4+,Ce3+()]sts, is an IVCT absorption of higher energy. It corresponds to the vertical one-electron orbital transition Ce3+ Ce4+. Its energy is above the regular Ce3+ absorption (1) and the difference between them is the reorganization energy that is released after the absorption. In this case, it is predicted as a very broad band peaking at 31000-32200 cm-1, which is 6500 cm-1 above Ce3+ . Since the latter is underestimated in these calculations, we can expect the same degree of underestimation in this IVCT absortion. The experimental peaks in the excitation spectrum at 33000 cm-1 (A3) and 35700 cm-1 (A4), which are very wide and have been unassigned (A3) or assigned to lower symmetry Ce3+ sites Bessière et al. (2006) (A4) can be assigned to this IVCT absorption. Again, the large width of this band is associated with the large offset between the minima of the and energy surfaces, which is here found to be of about 0.34 Å (cf. Table 5 of Additional Material).
Absorption 9, , or [Ce3+(),Ce4+]eq [Ce4+,Ce3+()]sts, is an IVCT absorption of even higher energy. Analogously to absorption 8, it is the vertical one-electron orbital transition Ce3+ Ce4+ and its energy is above the regular Ce3+ absorption (3) in an amount equal to the reorganization energy. It is predicted as a very broad band peaking at 56240 cm-1, 10200 cm-1 above Ce3+ . Since the latter is calculated to be close to experiment in these calculations, we can expect analogous agreement in this IVCT absortion. The experimental peak in the excitation spectrum at 54900 cm-1 (A7), can be associated with this IVCT absorption. The fact that the intensity of the A7 band in the excitation spectrum of the emission is comparable to that of the Ce3+ (A2) band further suggests this assignement.
IV.3.2 IVCT luminescence
Emission 10, , or [Ce3+(),Ce4+]eq [Ce4+,Ce3+()]sts, is specially interesting because it is an IVCT emission and, to the best of our knowledge, IVCT emissions have never been reported. As we discuss next, this emission corresponds well with the so called anomalous emission (E2). Bessière et al. (2006) This IVCT luminescence is the vertical one-electron orbital transition Ce3+ Ce4+ and it is followed by a strong nuclei reorganization around Ce4+ and Ce3+. This involves a large Ce-Cl distance shortening around Ce4+ and a large Ce-Cl distance elongation around Ce3+, and it releases an energy which is very similar to the energy of the IVCT absorption 7. The only difference between these energies arises from the fact that the Ce-Cl equilibrium bond length in the Ce3+ center is different in its states and states, but this difference is much smaller than the offset between the minima of the and branches along the electron transfer normal coordinate , which determines the reorganization energy. The reorganization energy after the IVCT emission is the amount by which this emission is lower than the Ce3+ absorption, i.e. it is its Stokes shift. In other words, the Stokes shift of this IVCT emission amounts the ground IVCT absorption 7. This is slightly above 10000 cm-1 in the present calculations. The experimental Stokes shift of the anomalous emission, calculated as the difference between the experimental absorption maximum (46900 cm-1 average of the JT split excitation) and the anomalous emission maximum (36400 cm-1) is 10500 cm-1.
The calculation predicts this IVCT emission band to be a very wide band with peaks in the 32000-35300 cm-1 region (Table 3). Its simulation is shown in red in Fig. 5b. Since the diabatic calculations do not provide oscillator strengths, we have used the oscillator strengths of the regular emission in Table 4 of Additional Material in order to be able to simulate the band shape. Accordingly, the intensities of the IVCT emission band and the emission band in Fig. 5b cannot be compared, but we must expect that the different shapes of both emission bands are fairly well reproduced. The IVCT emission is a very broad band with a full width at half maximum (FWHM) of about 5000 cm-1. The experimental FWHM at 290 K is 4800 cm-1. So, both the position and shape of this band correspond well with the anomalous emission (E2). Moreover, the following additional supporting argument on the band width can be given: First, we should expect the IVCT emission 10 to have a band shape very similar to that of the regular IVCT absorption 7, because both of them have very similar normal coordinate offsets. Second, the band width (in cm-1) and band maximum (in cm-1) of the latter are related according to at temperatures T (in K) high enough so that , being the vibrational frequency; Hush (1967) and using the experimental Stokes shift of the anomalous emission for , =10500 cm-1, we get at T=290 K a FWHM of =4850 cm-1, which agrees very well with the experimental FWHM of the anomalous emission.
According to the interpretation given in this paper, the anomalous emission is not due to an electron-hole recombination in which the electron is in the conduction band and the hole in the Ce impurity, and there is no anomalous state. Instead, the emission is an electron transfer from a orbital of a Ce3+ center to a orbital of a Ce4+ center, which takes place with frozen nuclei positions and leaves the newly formed Ce4+ and Ce3+ centers in their ground electronic states and under strong structural stress. The large relaxation energy released afterwars is basically the large Stokes shift of this emission. This is graphically represented in Fig. 8 of Additional Material. If an electron-hole recombination description is to be used, the electron is in a Ce3+ center and the hole in a Ce4+ center, but this kind of description is not very adequate because such a recombanition of electron and hole would still leave a hole and an electron.
The principal excitation of the anomalous emission is the Ce3+ absorption (A2, cf. Figs. 5c and 5d in Ref. Bessière et al., 2006); this is in agreement with the emission starting in the manifold. Also, two additional broad peaks have been identified in its excitation spectrum at 54300 cm-1 (A9) and 57500 cm-1 (A10); they can be made of absorptions from the branch to the , , and branches, i.e. to Ce3+ Ce4+ IVCT absorption and absorptions to the impurity-trapped exciton. We must note that the electronic couplings, which are missing in the diabatic energy surfaces, will have a stronger effect on the states of these excited branches. This and the lower symmetry driven splittings also missing here, indicate that the states at about 5000-10000 cm-1 above the Ce3+ manifold should be a strong mix of the diabatic states of the , , and branches. They can be responsible for the above mentioned peaks, but also for the peaks at 54900 and 56800 cm-1 of the excitation spectrum of the Ce3+ emission (A7, A8). The 56800 cm-1 peak was assigned to an impurity-trapped exciton in Ref. Bessière et al., 2006.
Another specific feature of the anomalous emission of Ce-doped Cs2LiLuCl6 is that it is not excited by absorptions to the conduction band (CB), although these absorptions effectively excite the emission. Bessière et al. (2006) Such absortions mean an ionization of Ce3+ to the CB that destroys the Ce3+–Ce4+ pair, so that for the anomalous emission to happen, the electron must be transferred back from the CB to the empty orbital of Ce4+. The present calculation does not give information on this; calculations on metal-to-metal charge transfer in Ce-Lu, Ce-Cs, and Ce-Li pairs will be the subject of further study.
Finally, in Ref. Bessière et al., 2006 it was shown that the decay time of the anomalous emission excited with the absorption was found to remain constant from 12 K to 240 K, to start dropping at 240 K (cf. Fig. 8 in Ref. Bessière et al., 2006), and to quench at 370 K. Following its correlation with the emission it was also shown that the anomalous emission is quenched by means of energy transfer to the states of Ce3+. Fitting the parameters of a kinetic model to the experimental data led them to an activation energy of 2900 cm-1. Parallely, the absorption was found to excite the emission, although no connection with the above activation energy was made.
All these observations are consistent with the present interpretation. In effect, the - crossing is responsible for the decay from the state that emits the anomalous luminescence (though it is a state and not an anomalous state) to the state. Such crossing gives the activation energy of the thermal process Ce3+() + Ce4+ Ce4++ Ce3+(). The diabatic result found here is 5100 cm-1. This value is reduced by the Jahn-Teller splitting of the state, it will be further reduced by the inclusion of electronic couplings and, perhaps more importantly, by a lower crystal-field splitting and by a larger offset between the minima of the and branches. We already commented above that the present calculation overestimates the crystal field splitting and underestimations of the nuclear offsets are common in calculations of this type. Gracia et al. (2008) And this interpretation also explains that the absorption excites the emission.
Besides, the quenching of the emission can be related to the - crossing, i.e. to the thermal process Ce3+() + Ce4+ Ce4++ Ce3+(). This is found to have a diabatic activation energy of 5800 cm-1, higher than that of the decay but not much. With the same arguments than before, we should expect this barrier to be reduced upon inclusion of the missing contributions, but not more than the other, so that the results indicate that the activation energy is slightly larger for the non-radiative decay of the states than of the states. Hence a larger quenching temperature of the emission compared with the anomalous emission.
Before ending this discussion we may remark that, according to these results, we may expect the existence of an IVCT emission of lower energy corresponding to the vertical one-electron orbital transition Ce3+ Ce4+, which is to say to the transiton , or [Ce3+(),Ce4+]eq [Ce4+,Ce3+()]sts. This transition is expected to appear at an energy lower than the emission by an amount very similar the first IVCT absortion, 10000 cm-1 in our case, i.e. at about 14000-16000 cm-1.
The new interpretation of the electronic excited states of Ce-doped Cs2LiLuCl6 is summarized in Table 1.
V Conclusions
In this paper we report for the first time the existence of intervalence charge transfer luminescence. We have shown that the so called anomalous luminescence of Ce-doped Cs2LiLuCl6, which is characterized mainly by a very large Stokes shift and a very large band width, corresponds to an IVCT emission that takes place in Ce3+–Ce4+ pairs, in particular to the vertical one-electron orbital transition Ce3+ Ce4+. The Stokes shift is the sum of the large reorganization energies of the Ce4+ and Ce3+ centers formed after the electron transfer. It equals the energy of the IVCT absortion, which is predicted to exist in this material and to be slightly larger than 10000 cm-1. The large band width is the consequence of the large offset between the minima of the Ce3+–Ce4+ and Ce4+–Ce3+ pairs along the electron transfer reaction coordinate, which is approximately times the difference of Ce-Cl equilibrium distances in the Ce3+ and Ce4+ centers.
We have shown that the energies of the peaks and the widths of IVCT absortion and emission bands can be calculated ab initio with reasonable accuracy from diabatic energy surfaces of the ground and excited states and that these can be obtained, in turn, from independent ab initio calculations on the donor and acceptor active centers.
We obtained the energies of the Ce3+ and Ce4+ active centers of Ce-doped Cs2LiLuCl6 by means of state-of-the-art SA-CASSCF/MS-CASPT2/RASSISO ab initio spin-orbit coupling DKH relativistic calculations on the donor cluster (CeCl6Li6Cs8)11+ and the acceptor cluster (CeCl6Li6Cs8)12+ embedded in an AIMP quantum mechanical embedding potential of the host elpasolite Cs2LiLuCl6. The calculations provide interpretations of unexplained experimental observations in Ce-doped Cs2LiLuCl6 as due to higher energy IVCT absorptions. They also allow to reinterpret other observations. The existence of another IVCT emission of lower energy, at around 14000-16000 cm-1 less than the emission, is also predicted.
IVCT emissions and high energy IVCT absorptions like the ones reported here for Ce3+-Ce4+ pairs, which are an extension of the known IVCT absorption of mixed-valence compounds, have also been found in Yb-doped solids and are reported separately. They are very likely to exist also in Eu-doped solids and in solids with f-elements in which several valence states can coexist.
Acknowledgements.
This work was partly supported by a grant from Ministerio de Economía y Competitivad, Spain (Dirección General de Investigación y Gestión del Plan Nacional de I+D+I, MAT2011-24586).References
- Verhoeven (1996) J. W. Verhoeven, Pure Appl. Chem. 68, 2223 (1996).
- (2) The term IVCT is used sometimes for MMCT between non-equivalent metal ions and also for electron transfer processes not involving metals; here we will adopt the conventional meaning and we will call IVCT only to the homonuclear, symmetric MMCT.
- Marcus (1964) R. A. Marcus, Annu. Rev. Phys. Chem 15, 155 (1964).
- Allen and Hush (1967) G. C. Allen and N. S. Hush, Prog. Inorg. Chem. 8, 357 (1967).
- Robin and Day (1968) M. Robin and P. Day, Adv. Inorg. Chem. Radiochem. 10, 247 (1968).
- Werner (1896) A. Werner, Z. Anorg. Chem. 12, 46 (1896).
- Hush (1967) N. S. Hush, Prog. Inorg. Chem. 8, 391 (1967).
- Hush (1985) N. S. Hush, Coord. Chem. Rev. 64, 135 (1985).
- Piepho et al. (1975) S. B. Piepho, E. R. Krausz, and P. N. Schatz, J. Amer. Chem. Soc. 100, 2996 (1975).
- Blasse (1991) G. Blasse, Struct. Bond. 76, 153 (1991).
- Boutinaud et al. (2007) P. Boutinaud, R. Mahiou, E. Cavalli, and M. Bettinelli, J. Lumin. 122-123, 430 (2007).
- van Schaik et al. (1993) W. van Schaik, S. Lizzo, W. Smit, and G. Blasse, J. Electrochem. Soc. 140, 216 (1993).
- (13) Z. Barandiarán and L. Seijo, "Intervalence Charge Transfer Luminescence: Interpaly Between Anomalous and 5d-4f emissions in Yb-doped florite-type crystals," J. Chem. Phys., accepted.
- Bessière et al. (2006) A. Bessière, P. Dorenbos, C. van Eijk, K. Krämer, H. Güdel, and A. Galtayries, J. Lumin. 117, 187 (2006).
- Dorenbos et al. (2003) P. Dorenbos, E. van Loef, C. van Eijk, K. Krämer, and H. Güdel, Phys. Rev. B 68, 125108 (2003).
- Bessière et al. (2004) A. Bessière, P. Dorenbos, C. van Eijk, L. Pidol, K. Krämer, and H. Güdel, J. Phys.: Condens. Matter 16, 1887 (2004).
- Duan et al. (2009) C.-K. Duan, P. A. Tanner, A. Meijerink, and V. Babin, J. Phys.: Condens. Matter 21, 395501 (2009).
- Duan et al. (2011) C.-K. Duan, P. A. Tanner, V. Makhov, and N. Khaidukov, J. Phys. Chem. A 115, 8870 (2011).
- McWeeny (1959) R. McWeeny, Proc. R. Soc. Lond. A 253, 242 (1959).
- McWeeny (1989) R. McWeeny, Methods of molecular quantum mechanics (Academic Press, London, 1989), 2nd ed.
- Karlström et al. (2003) G. Karlström, R. Lindh, P. A. Malmqvist, B. O. Roos, U. Ryde, V. Veryazov, P. O. Widmark, M. Cossi, B. Schimmelpfennig, P. Neogrady, et al., Comput. Mater. Sci. 28, 222 (2003).
- Douglas and Kroll (1974) M. Douglas and N. M. Kroll, Ann. Phys. (N.Y.) 82, 89 (1974).
- Hess (1986) B. A. Hess, Phys. Rev. A 33, 3742 (1986).
- Roos et al. (1980) B. O. Roos, P. R. Taylor, and P. E. M. Siegbahn, Chem. Phys. 48, 157 (1980).
- Siegbahn et al. (1980) P. E. M. Siegbahn, A. Heiberg, B. O. Roos, and B. Levy, Phys. Scr. 21, 323 (1980).
- Siegbahn et al. (1981) P. E. M. Siegbahn, A. Heiberg, J. Almlöf, and B. O. Roos, J. Chem. Phys. 74, 2384 (1981).
- Andersson et al. (1990) K. Andersson, P.-A. Malmqvist, B. O. Roos, A. J. Sadlej, and K. Wolinski, J. Phys. Chem. 94, 5483 (1990).
- Andersson et al. (1992) K. Andersson, P.-A. Malmqvist, and B. O. Roos, J. Chem. Phys. 96, 1218 (1992).
- Zaitsevskii and Malrieu (1995) A. Zaitsevskii and J.-P. Malrieu, Chem. Phys. Lett. 233, 597 (1995).
- Finley et al. (1998) J. Finley, P.-A. Malmqvist, B. O. Roos, and L. Serrano-Andrés, Chem. Phys. Lett. 288, 299 (1998).
- G. Ghigo, B. O. Roos, and P.-Å. Malmqvist (2004) G. Ghigo, B. O. Roos, and P.-Å. Malmqvist, Chem. Phys. Lett. 396, 142 (2004).
- Hess et al. (1996) B. A. Hess, C. M. Marian, U. Wahlgren, and O. Gropen, Chem. Phys. Lett. 251, 365 (1996).
- Llusar et al. (1996) R. Llusar, M. Casarrubios, Z. Barandiarán, and L. Seijo, J. Chem. Phys. 105, 5321 (1996).
- Malmqvist et al. (2002) P. A. Malmqvist, B. O. Roos, and B. Schimmelpfennig, Chem. Phys. Lett. 357, 230 (2002).
- Paulovic et al. (2003) J. Paulovic, T. Nakajima, K. Hirao, R. Lindh, , and P.-A. Malmqvist, J. Chem. Phys. 119, 798 (2003).
- Roos et al. (2008) B. O. Roos, R. Lindh, P. A. Malmqvist, V. Veryazov, and P. O. Widmark, J. Chem. Phys. 112, 11431 (2008).
- Roos et al. (2005) B. O. Roos, R. Lindh, P. A. Malmqvist, V. Veryazov, and P. O. Widmark, J. Phys. Chem. A 108, 2851 (2005).
- Roos et al. (2003) B. O. Roos, V. Veryazov, and P. O. Widmark, Theor. Chim. Acta 111, 345 (2003).
- Huzinaga et al. (1987) S. Huzinaga, L. Seijo, Z. Barandiarán, and M. Klobukowski, J. Chem. Phys. 86, 2132 (1987).
- Barandiarán and Seijo (1988) Z. Barandiarán and L. Seijo, J. Chem. Phys. 89, 5739 (1988).
- Gellé and Lepetit (2008) A. Gellé and M.-B. Lepetit, J. Chem. Phys. 128, 244716 (2008).
- Ewald (1921) P. P. Ewald, Ann. Phys. 369, 253 (1921).
- Meyer et al. (1986) G. Meyer, S. J. Hwu, and J. D. Corbett, Z. Anorg. Allg. Chem. 535, 208 (1986).
- Seijo and Barandiarán (1991) L. Seijo and Z. Barandiarán, J. Chem. Phys. 94, 8158 (1991).
- (45) Detailed embedding AIMP data libraries in electronic format are available from the authors upon request or directly at the address http://www.uam.es/quimica/aimp/Data/AIMPLibs.html. See also Ref. Karlström et al., 2003.
- Bersuker (1984) I. B. Bersuker, The Jahn-Teller Effect and Vibronic Interactions in Modern Chemistry (Plenum Press, New York and London, 1984).
- Tanner et al. (2003) P. A. Tanner, C. S. K. Mak, N. M. Edelstein, K. M. Murdoch, G. Liu, J. Huang, L. Seijo, , and Z. Barandiarán, J. Amer. Chem. Soc. 125, 13225 (2003).
- Ordejón et al. (2007) B. Ordejón, L. Seijo, and Z. Barandiarán, J. Chem. Phys. 126, 194712 (2007).
- Sánchez-Sanz et al. (2010) G. Sánchez-Sanz, L. Seijo, and Z. Barandiarán, J. Chem. Phys. 133, 114509 (2010).
- Heller (1975) E. J. Heller, J. Chem. Phys. 62, 1544 (1975).
- Heller (1981) E. J. Heller, Acc. Chem. Res. 14, 368 (1981).
- Zink and Shin (1991) J. I. Zink and K. S. Shin, in Advances in Photochemistry (Wiley, New York, 1991), vol. 16, pp. 119–214.
- McClure and Pédrini (1985) D. S. McClure and C. Pédrini, Phys. Rev. B 32, 8465 (1985).
- B. Moine, B. Courtois and Pédrini (1989) B. Moine, B. Courtois and C. Pédrini, J. Phys. France 50, 2105 (1989).
- Dorenbos (2003) P. Dorenbos, J. Phys.: Condens. Matter 15, 2645 (2003).
- Gracia et al. (2008) J. Gracia, L. Seijo, Z. Barandiarán, D. Curulla, H. Niemansverdriet, and W. van Gennip, J. Lumin. 128, 1248 (2008).
VI Additional material
| Configuration | State | ||||
|---|---|---|---|---|---|
| () | 0 | ||||
| () | |||||
| () | 0 | ||||
| () | |||||
| () | |||||
| () | |||||
| () | |||||
| () | |||||
| ITE- | |||||
| () | 0 |
| absorption | emission | emission | ITE emission | ||
| Initial state [Ce3+,Ce4+]: | (), | (), | (), | (), | |
|---|---|---|---|---|---|
| Branch | Final state | ||||
| (2) | (4) | (6) | |||
| [Ce3+(),Ce4+] | Ce3+ | Ce3+ | Ce3+ | Ce3+ ITE- | |
| 0 | +0.103 | –0.022 | +0.257 | ||
| +0.005 | +0.108 | –0.017 | +0.262 | ||
| +0.000 | +0.103 | –0.022 | +0.257 | ||
| +0.005 | +0.108 | –0.017 | +0.262 | ||
| +0.007 | +0.110 | –0.015 | +0.265 | ||
| (7) | (10) | ||||
| [Ce4+,Ce3+()]sts | Ce3+ Ce4+ | Ce3+ Ce4+ | Ce3+ Ce4+ | ||
| 0.409 | 0.343 | 0.425 | |||
| 0.412 | 0.348 | 0.428 | |||
| 0.409 | 0.343 | 0.425 | |||
| 0.412 | 0.348 | 0.428 | |||
| 0.414 | 0.350 | 0.430 | |||
| (1) | |||||
| [Ce3+(),Ce4+] | Ce3+ | ||||
| –0.103 | |||||
| –0.103 | |||||
| (8) | |||||
| [Ce4+,Ce3+()]sts | Ce3+ Ce4+ | ||||
| 0.343 | |||||
| 0.343 | |||||
| (3) | |||||
| [Ce3+(),Ce4+] | Ce3+ | ||||
| +0.022 | |||||
| (9) | |||||
| [Ce4+,Ce3+()]sts | Ce3+ Ce4+ | ||||
| 0.425 | |||||
| (5) | |||||
| [Ce3+(ITE-),Ce4+] | Ce3+ ITE- | ||||
| –0.257 | |||||
| [Ce4+,Ce3+(ITE-)]sts | |||||
| 0.291 |

|

|

|
