A comprehensive statistical assessment of star-planet interaction
Abstract
We investigate whether magnetic interaction between close-in giant planets and their host stars produce observable statistical enhancements in stellar coronal or chromospheric activity. New Chandra observations of 12 nearby ( pc) planet-hosting solar analogs are combined with archival Chandra, XMM-Newton, and ROSAT coverage of 11 similar stars to construct a sample inoculated against inherent stellar class and planet-detection biases. Survival analysis and Bayesian regression methods (incorporating both measurements errors and X-ray upper limits; 13/23 stars have secure detections) are used to test whether “hot Jupiter” hosts are systematically more X-ray luminous than comparable stars with more distant or smaller planets. No significant correlations are present between common proxies for interaction strength ( or ) versus coronal activity ( or ). In contrast, a sample of 198 FGK main-sequence stars does show a significant (% confidence) increase in X-ray luminosity with . While selection biases are incontrovertibly present within the main-sequence sample, we demonstrate that the effect is primarily driven by a handful of extreme hot-Jupiter systems with AU-2, which here are all X-ray luminous but to a degree commensurate with their Ca II H and K activity, in contrast to presented magnetic star-planet interaction scenarios that predict enhancements relatively larger in . We discuss these results in the context of cumulative tidal spin-up of stars hosting close-in gas giants (potentially followed by planetary infall and destruction). We also test our main-sequence sample for correlations between planetary properties and UV luminosity or Ca II H and K emission, and find no significant dependence.
Subject headings:
planetary systems — stars: activity — stars: magnetic fields — stars: individual (HD 73256, tau Boo, HD 162020, HD 179949, HD 189733)I. Introduction
The initial detection of “hot Jupiter” exoplanets (with but in orbits with semi-major axes only a fraction that of Mercury) presented a challenge to traditional models of planetary formation. While it is now clear that such systems are exceptional rather than the norm (e.g., Wright et al. 2012), and likely result from planet-disk or planet-planet migration, these extreme cases permit investigation of planetary events that are irrelevant or observationally inaccessible for longer-period planets. For example, close-in gas giants111Or smaller planets as well (Rappaport et al. 2012; Budaj 2013). can experience substantial mass loss due to atmospheric heating and inflation from high-energy X-ray and far ultraviolet (FUV) irradiation (Lammer et al. 2003; Knutson et al. 2010), and tidal effects may also help strip planetary atmospheres (Jackson et al. 2010). X-ray observations are just beginning to constrain such theories (e.g., Poppenhaeger et al. 2012). Tidal decay may destroy hot Jupiters on Gyr timescales, as suggestively supported by an apparent scarcity of close-in massive planets around older stars (Jackson et al. 2009; Debes & Jackson 2010). Such studies also explore how hot Jupiters might spin-up their host stars, and help put constraints on tidal values for stars and giant exoplanets. Magnetic star-planet interaction could speed evaporation of planetary atmospheres (e.g., Lanza 2013) and may enhance stellar coronal and chromospheric activity in hot Jupiter systems (Cuntz et al. 2000; Rubenstein & Schaefer 2000), to a degree proportional to the exoplanet magnetic field strength. Here we investigate the statistical observability of star-planet interaction, primarily by means of single-pointing X-ray measurements tracing coronal activity.
The energy released in a magnetic star-planet interaction event is theoretically expected to scale approximately as (Saar et al. 2004; Kashyap et al. 2008; alternatively the radius of the planetary magnetosphere may be parameterized in terms of and and then the dissipated power scales as , as in Lanza 2009; see also Cuntz et al. 2000). Here and are the star and planet magnetic field strengths, respectively, and is the relative velocity between field lines.222The relative velocity in terms of observables is with at the stellar equator (Cuntz et al. 2000). The dependence upon the semi-major axis is close to the star (for a simple dipole) and further out, in the “Parker spiral” region. The stellar magnetic field strength can be measured directly (e.g., Fares et al. 2010 find averages of 33, 22, and 36 Gauss in 2006, 2007, and 2008 for HD 189733, and Fares et al. 2012 find averages of 2.6 and 3.7 Gauss in 2007 and 2009 for HD 179949; note the actual field structure is not a simple dipole but is complex in both these hot Jupiter hosts) or estimated from the intrinsic X-ray-to-bolometric luminosity (in the absense of any planetary enhancement; Pevtsov et al. 2003), which in turn scales with the chromospheric activity measurable in Ca II H and K line core emission and parameterized by (Mamajek & Hillenbrand 2008).
The planetary magnetic field strength is unknown; it is potentially measureable with a calibrated star-planet interaction relation, or speculatively via radio emission (Grießmeier et al. 2007; Fares et al. 2010; Lecavelier des Etangs et al. 2013) or bow-shock produced offsets in UV transit times (Vidotto et al. 2011; but see also Turner et al. 2013, 2014). Based on direct measurements within our own solar system, planetary magnetic field strength likely scales with mass (Arge et al 1995; Stevens 2005); it may also depend upon rotation rate, which for close-in gas giants is tidally locked to the orbital period (Bodenheimer et al. 2001) of days, rather than the 10 hours for Jupiter (which, for reference, has an equatorial field strength of order 4.3 gauss). The best radial-velocity selected candidates to display star-planet interaction based on the relation include well-studied hot Jupiter systems such as And, Boo, HD 75289, HD 179949, HD 189733, and HD 209458, all of which rank in the top 10% of predicted energy released. For a fixed set of stellar parameters, the interaction energy is expected to scale simply with (the systems listed above are also in the top 10% by this metric), and we use this proxy333We ignore the distinction between and the minimum mass of explanets derived from radial velocity work, since the inclination term is unknown for most of these systems but provides a typical correction of only 15% (Wright & Gaudi 2013). throughout (see also Miller et al. 2012), along with for comparison to other studies.
Some numerical work supports the theory of magnetic star-planet interaction. Lanza (2008) modeled chromospheric hot spots in several systems (offset from the subplanetary point by varying degrees) as arising from star-planet magnetic reconnection events. Saur (2013) pointed out that only limited energy fluxes are expected from sub-Alfvenic plasma interactions, however Lanza (2009) suggested that interaction may serve as a catalyst for a release of coronal field energy. Cohen et al. (2009, 2011) carried out three-dimensional magnetohydrodynamic simulations illustrating that close-in giant planets can potentially produce an increase in overall X-ray luminosity, and generate (non-persistent) coronal hot spots that rotate synchronously with the planet (albeit potentially shifted in phase); see also Pillitteri et al. (2010). Observational evidence of magnetic star-planet interaction has now been claimed for several individual cases (including five of the six systems mentioned above, excepting HD 209458; e.g., Shkolnik et al. 2005; Saar et al. 2008; Walker et al. 2008; Pillitteri et al. 2010; Lanza et al. 2011) based on measurements of photospheric (optical light curve), chromospheric (Ca II H and K line core emission) or coronal (X-ray emission) activity enhancements concentrated near a specific planetary orbital phase. However, even in the best candidate systems, any signatures seem to be transient (Shkolnik et al. 2008). As a striking counterexample, the extreme WASP-18 system, which contains a planet in a 0.94 d period, shows no evidence for planet-linked activity (Miller et al. 2012; Pillitteri et al. 2014b); such interaction must be either absent, only rarely present, or rendered inefficient by an extremely weak stellar magnetic field444WASP-18 has (Miller et al. 2012), which is in the bottom 10% for activity of stars known to host hot Jupiters. (Lanza et al. 2013; Shkolnik et al. 2013; but see also Miller et al. 2012).
Single-pointing X-ray observations of planet-bearing stars have been utilized to search for systematic enhancements in in hot Jupiter systems, with mixed results (e.g., Kashyap et al. 2008; Poppenhaeger et al. 2010; Scharf 2010; Poppenhaeger & Schmitt 2011). Such investigations typically statistically average over orbital phase, trading decreased sensitivity to a phase-restricted effect in a given system for a much larger sample size and increased comparative sensitivity to phase-independent or full-surface activity increases; these X-ray surveys probe magnetic or tidal star-planet interaction (presumed one-sided or two-sided, respectively) as well as the potential cumulative tidal influence of hot Jupiters upon their hosts (e.g., stellar spin-up and associated activity rejuvenation; Schröter et al. 2011; Poppenhaeger et al. 2013). However, this approach is challenged by deeply embedded biases. For example, it is more difficult with radial velocity (RV) searches to detect distant or low-mass planets around intrinsically active stars, so in an RV-derived sample the hot Jupiter systems will have relatively greater average X-ray luminosities already prior to considering any star-planet interaction. While Kashyap et al. (2008) found that stars hosting planets with AU remain X-ray brighter by a factor of 1.3–4 even after attempting to control for this sensitivity bias, Poppenhaeger et al. (2010) found no significant trends in with or and ascribed a weak observed correlation between with entirely to such selection effects. Other biases may result from inhomogeneous stellar properties and/or Malmquist-type distance incompleteness, particularly with shallow ROSAT All-Sky Survey (RASS) data. A RASS-based study by Scharf (2010) did not support comparatively higher stellar in systems with AU planets, but did note a strong correlation between and in such short-period systems; however, Poppenhaeger & Schmitt (2011) demonstrated that this trend is not significantly present in with deeper XMM-Newton data.
We are able to improve upon previous studies in several areas. Most obviously, many planetary systems have been newly discovered in the last few years. This gives a larger pool of candidates from which to draw for statistical study, which in turn permits us to be more discriminating than was previously practical. We only use published and verified planets discovered in radial velocity searches. Our main-sequence (MS) sample carefully excludes stars for which the color and bolometric luminosity indicate even modest post-MS evolution. Further, we incorporate recent XMM-Newton (e.g., Poppenhaeger et al. 2010) and Chandra (e.g., this work) observations that detect stars down to luminosities far below shallow ROSAT limits, which provides a larger detection fraction that improves both the sensitivity and reliability of correlation or regression tests. In contrast to most previous statistical studies, we consider orbital phase where available. Complementary multi-wavelength data is now published for most systems, and we additionally investigate UV luminosity and Ca II H and K emission, and consider our X-ray results in the context of the intrinsic chromospheric activity. The focus of this work is a study of solar analogs, with the sample constructed to mitigate many of the selection biases that affected previous work (e.g., Poppenhaeger & Schmitt 2011). Finally, we use a variety of statistical tests to assess whether hot Jupiter systems display enhanced activity, including the Bayesian linear regression tool of Kelly (2007) that handles both measurement errors and censoring. This last step of fully accounting for X-ray upper limits is critical to obtaining an accurate determination of significance for any potential correlations. Our work here provides the most comprehensive statistical assessment of the observability of star-planet interaction conducted to date.
This paper is organized as follows. Section 2 describes the construction of the main-sequence and solar analogs samples and the X-ray observations and data reduction. Section 3 presents the results of testing the solar analogs and full samples for enhanced X-ray emission in hot Jupiter systems, including consideration of selection biases. Section 4 considers several interpretations of these results. Section 5 investigates other measures of stellar activity, specifically UV luminosity and Ca II H and K emission. Section 6 summarizes and provides our conclusions.
| Name | RMS | Per | ObsaaObservatory: no entry is RASS limit; B/F is RASS Bright/Faint source; P/H is ROSAT pointed PSPC/HRI detection; X is XMM-Newton detection or limit; C is Chandra detection or limit; O is other as explained in text. | ||||||||||
|---|---|---|---|---|---|---|---|---|---|---|---|---|---|
| (K) | (erg s1) | (m s-1) | () | (AU) | (d) | (m s-1) | () | (AU-1) | (erg s-1) | ||||
| HD 142 b | 6248 | 34.04 | -4.92 | 12.00 | 1.31 | 1.04 | 350.30 | 33.90 | 1.20 | 0.96 | 27.90 | 6.14 | |
| HD 1237 b | 5536 | 33.38 | -4.44 | 19.20 | 3.37 | 0.49 | 133.71 | 167.00 | 13.79 | 2.02 | 28.750.16 | 4.63 | B |
| HD 1461 b | 5765 | 33.60 | -5.02 | 3.43 | 0.02 | 0.06 | 5.77 | 2.70 | 5.95 | 15.74 | 27.81 | 5.79 | |
| HIP 2247 b | 4714 | 32.98 | -4.79 | 4.10 | 5.12 | 1.34 | 655.60 | 173.30 | 2.86 | 0.75 | 28.18 | 4.80 | |
| HD 2638 b | 5192 | 33.21 | -99.00 | 3.30 | 0.48 | 0.04 | 3.44 | 67.40 | 251.39 | 22.95 | 28.47 | 4.74 | |
| HD 3651 b | 5220 | 33.31 | -5.02 | 6.30 | 0.23 | 0.29 | 62.22 | 15.90 | 2.64 | 3.39 | 27.120.18 | 6.19 | H |
| HD 4113 b | 5688 | 33.66 | -99.00 | 8.40 | 1.65 | 1.27 | 526.62 | 97.10 | 1.02 | 0.79 | 28.37 | 5.29 | |
| HD 4208 b | 5600 | 33.42 | -4.95 | 3.40 | 0.81 | 1.65 | 828.00 | 19.06 | 0.30 | 0.60 | 28.10 | 5.32 | |
| HD 4308 b | 5695 | 33.58 | -99.00 | 1.30 | 0.05 | 0.12 | 15.56 | 4.07 | 3.36 | 8.39 | 26.660.14 | 6.92 | C |
| HD 5388 b | 6297 | 34.22 | -4.98 | 3.33 | 1.97 | 1.76 | 777.00 | 41.70 | 0.63 | 0.57 | 28.54 | 5.68 | |
| HD 6434 b | 5835 | 33.65 | -4.90 | 10.60 | 0.40 | 0.14 | 22.00 | 34.20 | 19.68 | 7.04 | 26.60 | 7.05 | C |
| HIP 5158 b | 4962 | 32.86 | -4.80 | 2.47 | 1.43 | 0.89 | 345.72 | 57.00 | 1.81 | 1.13 | 28.31 | 4.55 | |
| HD 6718 b | 5746 | 33.61 | -4.97 | 1.79 | 1.56 | 3.55 | 2496.00 | 24.10 | 0.12 | 0.28 | 28.56 | 5.05 | |
| HD 7199 b | 5386 | 33.46 | -4.80 | 2.63 | 0.30 | 1.36 | 615.00 | 7.76 | 0.16 | 0.73 | 28.19 | 5.27 | |
| HD 7449 b | 6024 | 33.67 | -4.85 | 3.81 | 1.31 | 2.34 | 1275.00 | 41.59 | 0.24 | 0.43 | 28.25 | 5.42 | |
| HD 7924 b | 5177 | 33.14 | -4.89 | 2.78 | 0.03 | 0.06 | 5.40 | 3.87 | 9.08 | 17.66 | 27.270.26 | 5.87 | F |
| HD 8535 b | 6136 | 33.85 | -4.95 | 2.49 | 0.68 | 2.44 | 1313.00 | 11.80 | 0.11 | 0.41 | 28.52 | 5.33 | |
| HD 8574 b | 6049 | 33.95 | -5.09 | 14.20 | 1.81 | 0.76 | 227.00 | 58.30 | 3.15 | 1.32 | 28.38 | 5.57 | |
| HD 9446 b | 5793 | 33.55 | -4.50 | 15.10 | 0.70 | 0.19 | 30.05 | 46.60 | 19.52 | 5.29 | 28.490.28 | 5.06 | F |
| And b | 6212 | 34.12 | -4.98 | 13.66 | 0.67 | 0.06 | 4.62 | 68.21 | 189.78 | 16.84 | 27.660.12 | 6.46 | O |
Note. — Table is ordered by RA. The 23 bolded names make up the solar analogs subsample (the two italicized names are excluded due to high values). The full table is available online; a portion is provided here to illustrate format.
II. Sample construction and X-ray luminosity measurements
II.1. Main sequence FGK and solar analogs selection
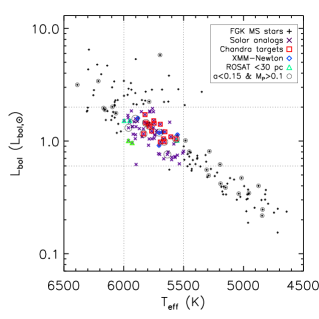
We selected main-sequence planet-hosting stars from the Exoplanet Orbit Database (EOD)555http://exoplanets.org as of March 2013. Our sample is limited to stars at distances less than 60 parsecs, and restricted to RV discovered planets with (this is deliberately greater than the usual brown dwarf cutoff so as to include all strongly interacting systems, but only HD 162020 has and AU). Stars are identified as main sequence by requiring surface gravity and inferred stellar radius , which is appropriate for non-evolved stars across the full range of temperatures here considered. (See, e.g., Niedzielski et al. 2014 and references therein for planet-hosting evolved systems.) We require the effective temperature to be between 4000 K and 6500 K. The upper temperature limit excludes early F and hotter stars for which the disappearance of the upper convective zone eliminates dynamo action and leaves them generally X-ray dark. The lower temperature limit excludes M dwarfs, which have efficient dynamos (Kitchatinov & Olemskoy 2011) and coronal activity producing high ratios (they are also generally UV active; France et al. 2013). M dwarfs are also less likely to host gas giants and more likely to contain super Earths (e.g., Wu & Lithwick 2013); this is not solely a selection effect, as theoretical models (e.g., Boss 2006) predict that low-mass stars more easily (but certainly not exclusively; see also Johnson et al. 2012) form lower-mass planets.
For multiple-planet systems, we consider only the properties of the planet most relevant for potential magnetic interaction. We rank by in multi-planet systems (see discussion in Section 1); in nearly all cases this is equivalent to choosing the closest-in known planet. The bolometric luminosity is calculated from the B-V color index and the apparent V-band magnitude based on the main-sequence trends tabulated by Bessell et al. (1998); specifically, we take the bolometric correction to be . Measurements of are from the EOD except for five values for hot Jupiter systems adopted from Knutson et al. (2010)666Use of this catalog instead of the values in the EOD changed HD 179949 from 4.8046 to 4.622, HD 189733 from no measurement to 4.501, HD 209458 from 5.014 to 4.970, HD 80606 from 5.0886 to 5.061, and And from 5.066 to 4.982. and eight values added from Isaacson & Fischer (2010).777Specifically, HD 28185, 16760, 102365, 37603, 114762, 155358, 156846, and 171238 have values of 5.023, 4.923, 4.931, 5.025, 4.902, 4.931, 5.082, 4.605. Measurements of are taken from Shkolnik (2013).
From the main-sequence parent sample of planet-hosting stars, we select solar analogs as having and . Additional criteria were imposed on our new Chandra targets: those 12 stars are non-active ( km s-1 and where known) and have definitively Jovian planets () in low eccentricity orbits (). The activity and mass cuts further reduce detectability bias, and additionally sub-Jovian planets may have distinct magnetic field properties that could blur a statistical signature of interaction in the sample. Low eccentricity establishes that the planet remains at a nearly constant distance from its star, so any interaction is quasi-continuous and X-ray observations do not need to be timed to periastron (but see also Hodgson et al. 2014 for using eccentric systems to test for star-planet interaction).
Targeting low-activity solar analogs reduces detectability bias, but it has both additional advantages and disadvantages for investigating star-planet interaction. The absolute energy produced by planet-induced activity is expected to scale with stellar magnetic field strength (1); however, the fractional increase in X-ray luminosity may be relatively constant, due to correlating with (Pevtsov et al. 2003). In active systems the intrinsic chromospheric or coronal variability, such as from starspots or flares, is generally several times greater than that expected from star-planet interaction (e.g., see discussion of HD 73256 in Shkolnik et al. 2005). Intensive phase-resolved coverage of individual active systems can potentially distinguish stellar from planet-induced variability (Shkolnik et al. 2005, 2008; Miller al. 2012; Scandariato et al. 2013), but for our statistical study that seeks to test planet-induced enhancements in X-ray luminosity by an average factor of a few (Kashyap et al. 2008) it is preferable to mitigate against increased noise. After considering the properties of solar analogs, we broaden the scope of our analysis to the full FGK MS sample that also includes more active stars.
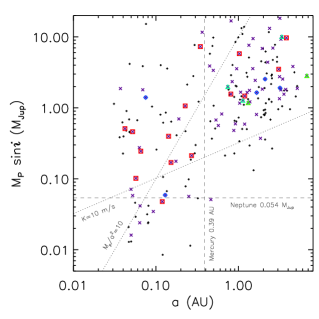
Properties of the 198 FGK MS stars and their relevant planets are provided in Table 1. Figure 1 shows an HR diagram of the full sample, with the cuts selecting solar analogs indicated as dashed lines. Figure 2 shows the semi-major axis and planetary mass for the most relevant planet in each system, as defined above; there is good coverage of the plane. Trend lines for constant semi-amplitude (which, along with intrinsic stellar noise, determines detection sensitivity) and for expected interaction strength are also shown on Figure 2.
II.2. Chandra and archival X-ray observations
Chandra archival coverage of solar analogs includes observations of 51 Peg (ObsID 10825; PI Schmitt; Poppenhaeger et al. 2009), HD 4308 (ObsID 12339; PI Schmitt), and CrB (ObsID 12396; PI Saar; Saar & Testa 2012). We reprocessed these data as described below. XMM-Newton observations targeting planet-hosting stars within pc (Kashyap et al. 2008; Poppenhaeger et al. 2010) include an five additional solar analogs (47 UMa, HD 190360, HD 217107, 16 Cyg B, and HD 70642; 51 Peg and HD 4308 also have XMM-Newton coverage), for which we take measurements from Poppenhaeger et al. (2010). For completeness we also include complementary ROSAT coverage of five solar analogs at pc888We do not include the shallow ROSAT coverage at pc, which provides only a 6% detection rate, in our analysis of the solar analogs, but it is used for the full FGK MS sample. (HD 39091, HD 82943, HD 147513, HD 150706, HD 210277), calculating from RASS bright or faint source catalog net count rates. However, two (HD 147513 and HD 150706) of these five solar analogs with ROSAT coverage are quite active (likely because they are young), with , and they are set aside for this analysis as they do not provide a proper point of comparison with true solar analogs; note that they both have only distant Jupiter-mass planets known, so their activity cannot be related to star-planet interaction. To this archival data we add our 12 new Chandra observations (PI Miller, ObsIDs 13658–13669) to construct a sample of 23 solar analogs with sensitive X-ray coverage.
The new and archival Chandra observations of solar analogs are detailed in Table 2. These observations were taken with the ACIS-S array, with the target positioned at the aim point of the S3 chip; the soft-band sensitivity of this back-illuminated chip is helpful for detecting coronal emission (Poppenhaeger et al. 2009). All observations were taken using Very Faint telemetry to optimize background removal. The data were reduced using the CIAO software package, version 4.5, using standard techniques which are briefly described below.
The data were reprocessed with the EDSER subpixel optimization applied, with Very Faint particle background cleaning applied, with the charge transfer inefficiency correction applied, with time-dependent gain correction applied, and using the most recently available CALDB calibration files (including the updated ACIS contamination model that accounts for condensation on the optical blocking filters). The standard grades of 02346 were retained. Observations were checked for background flaring; point sources were identified on the S3 chip using wavdetect and removed for these purposes, then the deflare script was run on a lightcurve binned to 200 s and any identified intervals of high background were filtered out of the level 2 event file. A 0.8 keV exposure map was used to determine the effective exposure times at the source positions, and to excise edge regions (1.5%). A 0.15–2 keV image of the S3 chip was created for each observation and used for all subsequent analysis. The coronal emission from these solar-type stars is not expected to extend to harder energies (we verified that at most a few percent of the source counts have energies keV), and insufficient counts are available to justify subdividing this energy band.
| Name | ObsID | HJD | Exp | Cts | Rate | Flux | Dist | |||||
|---|---|---|---|---|---|---|---|---|---|---|---|---|
| HD 4308 | 12339aaFrom archival Chandra data; see 2.2. All other Chandra observations are from our Cycle 13 program. | 2455622.92 | 0.097 | 14.88 | 20.68 | 1.39 | 5.49 | 22.06 | 26.660.14 | 6.55 | 33.58 | 6.92 |
| HD 6434 | 13662 | 2456202.55 | 0.430 | 8.97 | 3.12 | 0.35 | 1.38 | 41.37 | 26.60 | 7.72 | 33.65 | 7.05 |
| HD 28185 | 13664 | 2456202.67 | 0.092 | 8.68 | 3.17 | 0.37 | 1.46 | 42.34 | 26.64 | 7.80 | 33.67 | 7.03 |
| HD 30177 | 13668 | 2456117.61 | 0.483 | 14.88 | 3.31 | 0.22 | 0.87 | 52.83 | 26.62 | 8.41 | 33.62 | 7.00 |
| HD 49674 | 13661 | 2456263.06 | 0.960 | 11.94 | 42.71 | 3.58 | 14.13 | 44.23 | 27.670.11 | 8.10 | 33.58 | 5.91 |
| HD 102117 | 13663 | 2456196.61 | 0.991 | 7.00 | 4.93 | 0.70 | 2.76 | 39.70 | 26.870.27 | 7.47 | 33.73 | 6.86 |
| HD 107148 | 13665 | 2456248.46 | 0.704 | 9.57 | 6.91 | 0.72 | 2.84 | 51.20 | 27.100.22 | 8.01 | 33.74 | 6.64 |
| HD 134987 | 13666 | 2455937.42 | 0.385 | 4.99 | 2.92bbHD 134987 is formally a detection at 90% confidence with our conservative methodology but is found by wavdetect; see 2.2. | 0.58 | 2.29 | 26.21 | 26.430.39 | 6.47 | 33.77 | 7.34 |
| CrB | 12396aaFrom archival Chandra data; see 2.2. All other Chandra observations are from our Cycle 13 program. | 2455944.05 | 0.644 | 9.86 | 5.88 | 0.60 | 2.37 | 17.24 | 26.070.24 | 5.39 | 33.82 | 7.75 |
| HD 168746 | 13660 | 2456226.63 | 0.590 | 9.96 | 3.17 | 0.32 | 1.26 | 42.73 | 26.59 | 7.95 | 33.60 | 7.01 |
| HD 178911B | 13659 | 2455933.36 | 0.914 | 9.94 | 20.88 | 2.10 | 8.29 | 42.59 | 27.410.11 | 7.97 | 33.60 | 6.19 |
| HD 187123 | 13658 | 2455970.76 | 0.465 | 9.76 | 3.15 | 0.32 | 1.26 | 48.26 | 26.70 | 7.83 | 33.75 | 7.05 |
| HD 188015 | 13667 | 2456171.39 | 0.872 | 12.92 | 19.73 | 1.53 | 6.04 | 57.01 | 27.520.14 | 8.24 | 33.74 | 6.22 |
| HD 204313 | 13669 | 2456222.07 | 0.786 | 9.66 | 3.12 | 0.32 | 1.26 | 47.37 | 26.69 | 7.99 | 33.67 | 6.98 |
| 51 Peg | 10825aaFrom archival Chandra data; see 2.2. All other Chandra observations are from our Cycle 13 program. | 2454806.96 | 0.746 | 4.92 | 7.94 | 1.61 | 6.35 | 15.61 | 26.420.21 | 5.45 | 33.72 | 7.30 |
Note. — Table is ordered by RA. Column details: HJD is the heliocentric Julian Date at the beginning of the observation; is the radial-velocity orbital phase relative to our line of sight; Exp is the effective exposure in ks; Cts is the net counts within a 2′′ aperture centered on the object coordinates at the time of the observation, or else the 95% confidence upper limit; Rate is the net counts per ks; Flux is the unabsorbed 0.2–2 keV flux for a mekal model with ; Dist is the distance in parsecs calculated from Hipparcos parallax; is the 0.2–2 keV X-ray luminosity in erg s-1 (expressed as a logarithm).
The targeted stars are optically bright, with a median . For effective temperatures of 5500–6000 K, these magnitudes are expected to result in approximately one photoelectron per pixel per standard 3.2 s frame exposure registering for the S3 chip near the aimpoint. Each excess photoelectron shifts the bias level by 3.4 eV, slightly altering the observed X-ray energy for a given event. However, for these observations the total number of X-ray counts is too low to conduct spectral analysis, so this slight contamination has no impact on the derived fluxes (i.e., subarray binning was not required). The optical photoelectrons cannot themselves register as an X-ray event, since the low energy cutoff we use of 0.15 keV is 44 photoelectrons, corresponding to stars 4 magnitudes brighter.
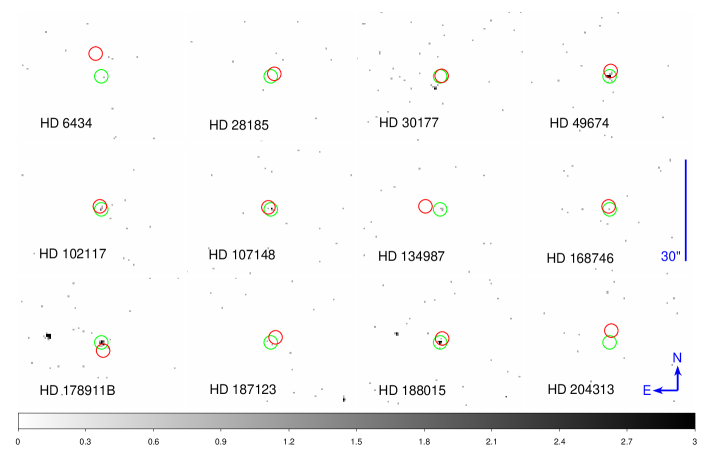
The 0.15–2 keV images of the targets are provided in Figure 3. Because the targets are relatively nearby, it is necessary to take proper motions into account. The J2000 coordinates were adjusted to the epoch of the Chandra observations using the proper motions measured by Hipparcos (van Leeuwen 2007). The red and green circles show apertures at the J2000 and updated positions, respectively. Source detection is assessed through running wavdetect at a significance thresshold of over the S3 chip and separately by calculating whether the number of observed counts is greater than could arise from background fluctuations at 95% confidence (per the Bayesian-derived tables given in Kraft et al. 1991). Five sources are clearly detected: HD 188015, HD 107148, HD 102117, HD 49674, and HD 178911B. Five sources are clearly not detected: HD 204313, HD 28185, HD 6434, HD 168746, and HD 187123. One source is borderline: HD 134987 has three counts and is formally a detection at 90–95% confidence using the criteria of Kraft et al. (1991), but those three counts are angularly concentrated within 1.2′′ (the on-axis PSF) and it is confirmed as a detection by wavdetect. One source is confused: HD 30177 has a clear detection but that source is distant from the expected target location; we conservatively consider this to be an unrelated object, most plausibly a wide-orbit companion.
X-ray counts were extracted from the indicated 2′′ apertures with the (nearly neglible) background estimated from nearby source-free regions. Net count rates were converted to unabsorbed fluxes using PIMMS999http://cxc.harvard.edu/toolkit/pimms.jsp for a fixed plasma/MEKAL model with three components at temperatures of 1 MK, 3 MK, and 10 MK (, 6.5, and 7.0 or 0.09, 0.27, and 0.86 keV, respectively), with relative flux normalizations of 1:1:1. Solar abundances and an cm-2 were assumed. This provides energy conversion factors between net rates and fluxes similar to those adopted by previous studies of star-planet interaction; for example, while we use 0.2–2 keV fluxes throughout, the ROSAT PSPC and HRI rates would translate into 0.1–4.5 keV fluxes through conversion by a factor of and , comparable to the factors of and adopted by Kashyap et al. (2008). This model also approximately reproduces the relative counts observed within the 0.2–0.45, 0.45–0.75, and 0.75–2.0 keV bands in XMM-Newton observations of solar-type stars (Poppenhaeger et al. 2010). The conversion factor from Chandra/ACIS-S (Cycle 13) net count rates to unabsorbed flux (both over 0.2–2 keV) is then . Minor modifications in these parameters would alter the resulting fluxes by less than the statistical errors. X-ray luminosities are calculated for the Hipparcos distances (van Leeuwen 2007), as for the bolometric luminosities. X-ray luminosities are expressed as logarithms throughout and given in units of erg s-1. We add an uncertainty of 20% to the statistical errors on the X-ray luminosities derived from the Chandra observations to account for inaccuracies in counts-to-flux conversion from using a fixed spectral model.
X-ray luminosities for the remainder of the full FGK MS sample are recalculated from the net count rates given in Poppenhaeger et al. (2010)101010Three stars from the sample in Poppenhaeger et al. (2010) are not listed in the EOD; two are evolved and so would be excluded as non-MS anyway (HD 62509 and HD 27442) while one is no longer considered planet-bearing (HD 20367; Wittenmyer et al. 2009). for stars observed by XMM-Newton (including those from Kashyap et al. 2008), or else from ROSAT coverage. For objects lacking Chandra or XMM-Newton values, we searched the RASS bright and faint source catalogs as well as source catalogs generated from pointed PSPC and HRI observations, prioritizing the latter. Net 0.1–2.5 keV ROSAT count rates were converted to 0.2–2 keV fluxes by factors of 3.95 and 2.02 for the PSPC and HRI detectors, respectively, while the energy conversion factor for XMM-Newton observations with the detector and the thick/medium/thin optical blocking filter is 3.90/2.66/2.43. The XMM-Newton conversion factors were calculated using XSPEC and for the fixed spectral model provide good agreement with the luminosities calculated by Poppenhaeger et al. (2010), with a median offset of 0.03 dex and a scatter of 0.10 dex.111111This is disregarding HD 195019 for which Poppenhaeger et al. (2010) give a distance of 20 pc whereas we take 38.5 pc from the parallax. Approximate upper limits were estimated for undetected stars from the typical RASS faint source catalog limit of erg s-1 cm-2. In two cases we use literature values for that are based on the median of multiple high-quality observations: And has Chandra coverage described in Poppenhaeger et al. (2011), while HD 179949 has XMM-Newton coverage described in Scandariato et al. (2013).
III. Testing planetary correlations with X-ray luminosity
III.1. Coronal activity in solar analogs
We tested for a statistically-significant correlation within the 23 solar analogs with X-ray coverage using the Kendall statistic implemented within ASURV121212http://astrostatistics.psu.edu/statcodes/asurv (Feigelson & Nelson 1985), which provides more accurate results than a Spearman correlation test for small sample sizes. This is a non-parametric ranking test that does not assume any particular functional relationship between the variables. X-ray upper limits are accounted for, but measurement errors are not; all points are equally weighted. We considered four different potential interaction scalings: and as activity indicators, versus and as interaction-strength proxies (Figure 4). The values of are 0.28 and 0.21 for and as a function of , and 0.42 and 0.35 as a function of . These correspond to probabilities for no correlation of 78%, 83%, 67%, and 73%; the null hypothesis cannot be rejected, and by this metric the solar analogs show no significant evidence for increased X-ray luminosity in hot Jupiter systems.
We next tested for a statistically-significant correlation by assessing whether a positive slope is present in a linear fit (using logarithmic quantities). We use the Bayesian linear regression code of Kelly (2007), which accounts for both measurement errors and upper limits. The resulting best-fit values are reported as the median of 10000 draws from the posterior distribution, with uncertainties corresponding to 1 given as the standard deviation. The preferred slopes are near zero, specifically and for , as a function of and . Kashyap et al. (2008) report an enhancement by a factor of 4 in X-ray emission for close-in planets, of which they estimate 2 is due to star-planet interaction, with the remainder attributable to selection effects. The separation between the putative weakly interacting and strongly interacting systems is 1.7 dex in ; a slope of 0.3 would then produce an increase of 0.5 dex (or 3) in X-ray luminosity, so we take the probability of as the likelihood that interaction is present. The close-in and distant systems in are separated by 1.0 dex, so here we consider to provide positive evidence of interaction. The posterior distribution of is shown in Figure 5; in all cases, slopes above these cutoff values are excluded at % confidence.131313Confidence estimates here and throughout are given as the percentage of draws from the posterior distribution satisfying the relevant condition, which is more accurate than extrapolating from a preferred parameter value and its estimated 1 errors. The insets show 500 draws from the posterior distribution for the intercepts and slopes. The linear regression slopes likewise and independently do not produce significant evidence for star-planet interaction in the solar analogs.
We also tested the significance of our result by conducting simulations, to assess whether 23 objects is sufficient to identify or exclude interaction. For each trial, we fixed the values of at those for the observed solar analogs, and then generated for two hypothetical distributions: first, a normal distribution about with scatter 0.7 dex (matching the preferred value fit to the data) and no dependence upon , and second, a normal distribution about the line = , again with 0.7 dex scatter. For the second model the slope is selected such that the increase in is 0.5 dex over the 1.7 orders of magnitude separating hypothetically weakly and strongly interacting systems, which matches the 2 (4) factor of increased X-ray activity found by Kashyap et al. (2008) after (prior) to controlling for selection effects. In only 7% of cases with no input interaction is the best-fit slope fit to the random realizations greater than 0.3 (i.e., 7% Type I error). In only 4% of cases with a signficant input interaction is the best-fit slope less than zero (i.e., 4% Type II error). These simulations indicate that our sample of solar analogs is sufficiently large in size and dynamic range to guard against randomly pathological distributions and verifies that the results of the correlation and linear regression tests are secure.

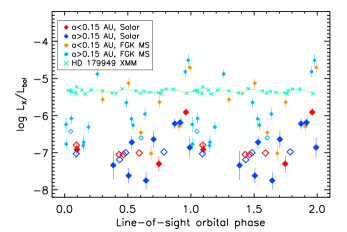
Finally, we consider the orbital phase at which the Chandra observations of solar analogs were conducted. It is possible that magnetic star-planet interaction could occur preferentially near a particular phase. For example, a reconnection-induced hotspot slightly leading the sub-planetary point on the stellar surface would cross the line of sight prior to the planet, at a phase slightly less than unity. Based on Ca II H and K variability in HD 179949 and And, Shkolnik et al. (2008) identified as an orbital phase at which star-planet interaction is preferentially manifested. On the other hand, Pillitteri et al.(2010, 2011, 2014a) find X-ray activity in HD 189733 near (i.e., when the planet is behind the star). A planet-induced coronal hotspot being dragged across the stellar surface should be visible over 0.5 of the planetary orbit, with the projected surface area peaking along the line of sight. We determined the heliocentric Julian date at the midpoint of the Chandra observation, and converted this to the line-of-sight orbital phase using the orbital parameters in the EOD (derived from fitting RV measurements). Figure 6 shows versus for solar analogs hosting close-in (red) and distant (blue) systems. For context, we also plot X-ray luminosities from single-pointing non-RASS coverage of FGK MS stars, generally from XMM-Newton observations. We also show the XMM-Newton monitoring campaign on HD 179949 from Scandariato et al. (2013; their Table 6); for extensive X-ray coverage and discussion of And, HD 179949, or HD 189733 we refer the reader to Poppenhaeger et al. (2011), Saar et al. (2008) plus Scandariato et al. (2013), and Poppenhaeger et al. (2013) plus Pillitteri et al. (2010, 2011, 2014a), respectively. Taking both detection and limits into account, there are no particular phases at which the close-in systems show systematic X-ray enhancements (or large positive-only scatter). While the number of points is not large enough to draw definitive conclusions, there is no evidence from these observations of a preferred phase at which planet-induced enhancements routinely occur in hot Jupiter systems.
III.2. Coronal activity in main sequence FGK stars
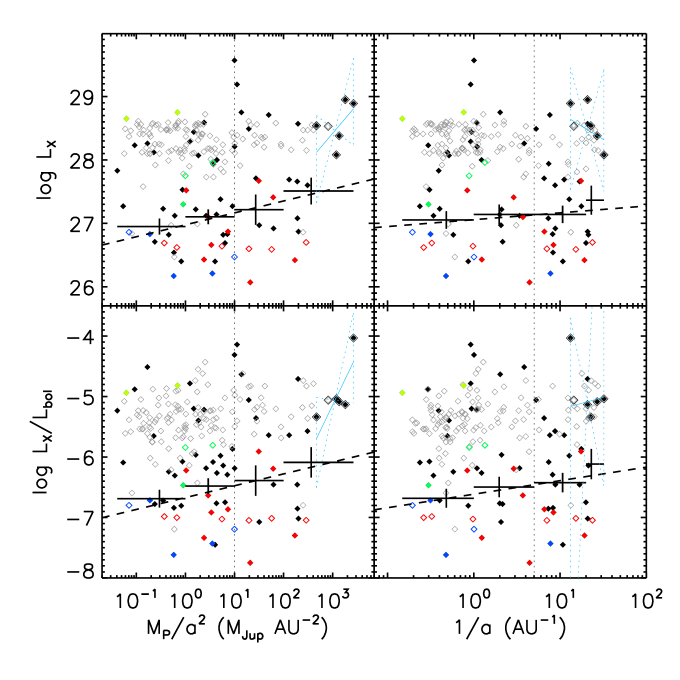
For the full main sequence sample, there are sufficient stars to compare and within four discrete bins of and . The Kaplan Meier mean is computed within ASURV, taking X-ray upper limits into account, and the X-ray luminosities are centered to and . The results are plotted as large crosses in Figure 7, with the horizontal bars indicating bin boundaries and vertical bars indicating the error on the mean within that bin. While the uncertainties are large, increases by dex from the lowest to the highest bin (with means, as logarithms, of and 2.56 AU-2, respectively, a separation of 3 dex), and similarly increases by across this same interval. The difference is less pronounced for as a function of X-ray luminosity; from the most distant to the most close-in bins (with means, as logarithms, of to 1.36 AU-1, respectively, a separation of 1.7 dex), the increase is and for and , respectively.
Testing the main-sequence sample for a correlation with ASURV, the Kendall values are 2.37 and 1.91 for and as a function of , which correspond to probabilities for no correlation of 1.8% and 5.6%; the null hypothesis is rejected at , confirming the increase in X-ray luminosity for hot Jupiters in the full sample, in contrast to the results for the solar analogs alone. On the other hand, the Kendall values are 1.09 and 1.55 for and as a function of , which correspond to probabilities for no correlation of 28% and 12%; here the null hypothesis cannot be rejected.
Qualitatively similar results are obtained for fitting or as a function of or (again with all quantities expressed as logarithms and centered). The best-fit linear relations (calculated with the Bayesian IDL routine of Kelly 2007) are overplotted in Figure 7 as dashed black lines. This methodology is completely independent of the mean values found within bins with ASURV, but it may be observed that there is good agreement in the trends. Specifically, the preferred slopes, with errors, are and for and as a function of , and and as a function of , with corresponding likelihood over the full posterior for the slope to be greater than zero of 99.6%, 99.3%, 79.8%, and 93.7%. (These preferred slopes are still significantly less than the values of 0.3 and 0.5 that would correspond to a typical increase in X-ray emission by a factor of 3 for and , respectively.)
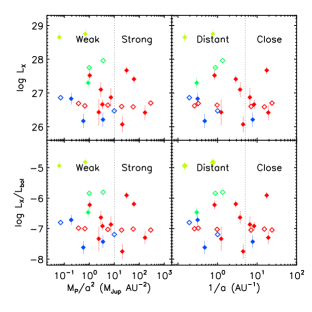
The significance by which the preferred slope exceeds zero is strongly dependent upon a handful of extreme systems. Specifically, if the six systems (HIP 14810, HD 73256, tau Boo, HD 162020, HD 179949, and HD 189733) with AU-2 were to be omitted, preferred slopes for all four fits would be consistent with zero (, , , ). HIP 14810 has only a loose X-ray limit, but the other five extreme systems are X-ray luminous and also chromospherically active, with . For completeness, we also fit linear relations to the extreme systems only (solid cyan lines in Figure 7), but because there are only six points the uncertainties in the slopes (dotted cyan lines) are quite large and permit slopes of zero, preventing us from drawing any definitive conclusions.
An older main-sequence star will have lower activity than an otherwise similar but younger counterpart, independent of planetary properties. Because the inferred signatures of star-planet interaction upon the chromospheric emission cores in the Ca II H and K lines is at the few percent level (Shkolnik et al. 2008), the value of for a given star should be nearly or entirely independent of planetary properties (e.g., Canto Martins et al. 2012; see further discussion in Section 5). We search for excess X-ray luminosity beyond that related to the intrinsic stellar activity by removing the dependence of upon , as parameterized for main-sequence stars by Mamajek & Hillenbrand (2008). The resulting preferred slopes are consistent with zero at the level (, , , and ). The preferred intercepts are modestly negative (, , , , all 0.09), perhaps reflective of the (selected) lower activity of radial-velocity targeted stars compared to those in the field (see also discussion in Shkolnik 2013). If only the most chromospherically active stars are considered, there are 31 stars with , of which 16 have X-ray detections, and the preferred slopes for this subset against or are consistent with zero at the 1 level.
An alternative method of testing whether a potential correlation between two variables could be related to a third variable is given by the Kendall partial tau test. This has been implemented for data including censoring by Akritas and Seibert (1996) and we use their methodology to test whether the correlation between and remains significant when controlling for . Kelly et al. (2007) identify instances in which this test can produce misleading results, but our sample is not subject to the strong multiple variable correlations that can be potentially problematic, and we use this test only as an additional check. For reference, with the third variable also equal to but summed with a random Gaussian of standard deviation 0.001, and , with , properly identifying the third variable as relevant; in contrast, controlling for a uniformly zero third variable produces and , with , properly rejecting the third variable as relevant. Controlling for , , , , and , with . This indicates that the null hypothesis cannot be rejected and so the influence of upon the versus correlation cannot be ruled out, consistent with the regression results. For completeness, we verified that a partial correlation with either distance or stellar temperature is rejected. These results are consistent with and reinforce those obtained from the two-variable correlation and linear regression tests.
While magnetic star-planet interaction might provide one explanation for these results, at least for the most extreme systems, it is necessary to consider also selection biases as well as planet and stellar evolution effects.
IV. Discussion of X-ray results
The lack of a systematic increase in coronal activity in hot Jupiter systems in our controlled investigation of solar analogs indicates that any magnetic star-planet interaction must be either uncommon or of low efficiency in these systems. These results limit the immediate utility of star-planet interaction as a general probe of exoplanet magnetic field strengths (the complementary extreme-system study of WASP-18 by Miller et al. 2012 reached similar conclusions). We next discuss various factors that may influence comparative X-ray emission across the full FGK MS sample, and specifically consider radial velocity sensitivity bias, binarity, star-planet interaction in extreme systems, and cumulative tidal effects.
IV.1. Radial velocity sensitivity bias
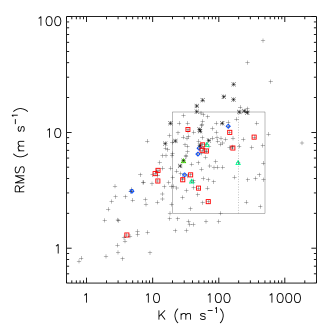
The full sample of main-sequence FGK planet-hosting stars is susceptible to selection biases; in particular, weakly interacting systems may only be detectable around inactive stars, resulting in a deficit of systems with low-mass, distant planets and high values and inducing a spurious correlation that must be removed prior to evaluating potential star-planet interaction signatures. This incompleteness is apparent in a diagram of the velocity semi-amplitude versus the residual ”jitter” noise (Figure 8). Here is primarily influenced by the planetary properties (the range of stellar masses is less than that in period and planetary mass) while reflects the intrinsic activity of the parent star. There is a dearth of points at low and high values due to sensitivity limitations in radial velocity searches.
This bias results in relatively fewer systems at low and high values. We confirm that a significant selection bias is present in our data through testing the scaling of the velocity semi-amplitude with distance, and find that a positive correlation is present at whereas in a complete sample no dependence would be expected. (Excluding the six most extreme systems with AU-2 does not remove the correlation with ).
Restricting consideration to a portion of the - plane with complete coverage, defined here as m s-1 and m s-1 (the solid square in Figure 8), produces a subsample of 110 systems, of which 30 have X-ray detections, for which no correlation (slope ) is now present between and distance. Four of the five X-ray detected extreme systems with AU-2 are included in this subset; Tau Boo is excluded with m s-1. This subsample does show a significant dependence of or upon (% probability that the slope ) and the preferred slopes are similar to those found for the full sample (albeit less tightly constrained), which suggests that the RV-sensitivity selection bias is not the sole driver associating enhanced X-ray emission with hot Jupiter systems. If instead the subsample is restricted to m s-1 and m s-1 (the dotted line in Figure 8; 95 systems, of which 24 have X-ray detections), four of the five extreme systems are now excluded as having m s-1 (HD 179949 is retained). Here again there is no correlation between and distance, but there is still suggestive evidence for a correlation between or and (% probability that the slope , dropping to 80% if HD 179949 is excluded). Removing the dependence of upon distance through selection of a - complete subsample does not eliminate the trend of increasing or toward greater , unless the most extreme systems are all deliberately excluded from the subsample.
We emphasize that the identification of a selection bias within a sample does not necessarily indicate that any correlation with planetary properties is due to that bias. In particular, since scales with , most proxies for interaction strength, including the preferred here, will correlate with .
IV.2. Binary systems
Planet-hosting stars are sometimes present in binary systems (10–20%; Raghavan et al. 2006; Roell et al. 2012). Binarity increases intrinsic X-ray activity even in long-period systems, perhaps related to initial formation (Pye et al. 1994). In addition, any unresolved X-ray emitting secondary companions would inflate the apparent X-ray luminosity of the planet-hosting primary; this is more of a concern for the XMM-Newton and particularly ROSAT observations, which lack the angular resolution of Chandra, but note that 25% contamination would only increase by 0.1 dex. Among our new Chandra targets, HD 188015 and HD 178911B are in wide binary141414HD 178911 is actually a triple, with AC having a separation of 0.1′′ (Raghavan et al. 2006). star systems (Raghavan et al. 2006) with projected component separations of 16′′ and 13′′ (corresponding to 790 and 680 AU), respectively. Both companions are detected in the Chandra observations (Figure 3). The dynamics and evolution of planetary systems are sensitive to binarity; for example, Kaib et al. (2013) demonstrate that outer exoplanets within wide binaries can be destabilized as the system responds to Milky Way tidal forces and passing stars, an effect that could artificially link (surviving) hot Jupiter systems with binary (more active) stars.
We consider whether binarity corresponds with increased X-ray activity in stars flagged as binary in the EOD (since these stars possess sensitive RV measurements required to discover planets, this assessment should also be complete with respect to close stellar companions). The full sample of 198 planet-hosting main-sequence stars contains 36 known binary systems. The Kaplan Meier mean values of are and for single stars (46/162 detected) and binary (16/36 detected) systems, respectively, calculated within ASURV. The mean values of are and . While the distributions of are marginally distinct (probability of 4.2% using the Peto & Prentice test), the distributions of are not inconsistent (Peto & Prentice probability 25%). The binary systems also have, on average, modestly more extreme planets, with mean and mean versus 0.35 and 0.21 for the single stars. Among the most extreme hot Jupiter systems, Boo and And are known binaries (Butler et al. 1997), as is HD 189733 (Roell et al. 2012).
IV.3. Magnetic interaction in extreme systems
In 3.2 we found that a handful of extreme systems with drive the correlation with or in the FGK MS sample. Extreme systems are easier to detect in RV searches (see 4.1), so a tendency toward higher X-ray luminosities within this bin is not a selection bias.151515It should be noted that there are exceptions to this trend; most notably, WASP-18 is strongly tidally interacting but X-ray weak with a low (Miller et al. 2012; Pillitteri et al. 2014b), and the solar-type star XO-5 has serendipitous Chandra coverage that suggests it is at most moderately X-ray bright, with (these transit-detected systems are not in our sample). Compared to the solar analogs for which no evidence of magnetic star-planet interaction is found, these extreme systems have similar masses but smaller semi-major axes. In addition, their shorter orbital periods produce faster rotation rates (for tidal locking at AU; Bodenheimer et al. 2001), which would also increase the interaction energy. The stellar magnetic fields are also likely to be higher, based on the values; for example, HD 189733 has a directly measured value of about 30 G (Fares et al. 2010), although for HD 179949 it is only a few Gauss (Fares et al. 2012), comparable to the Sun. We briefly highlight the properties of the X-ray-detected extreme systems and summarize previous phase-resolved studies that searched for or identified apparent star-planet interaction.
HD 73256 is a solar-temperature ( K) but active star, with and . Shkolnik et al. (2005) find variation of the Ca II H and K cores to be modulated with the stellar rotation period (with a flare observed near orbital phase 0.03), but note that the amplitude of the stellar variability could dilute a planet-induced signature. Shkolnik et al. (2008) retain it as a candidate for observable interaction.
Tau Boo is a hot ( K) and nearby ( pc) star that is moderately active, with and . (A more recent Chandra observation resolves the secondary and finds a somewhat lower X-ray value for the primary; Poppenhaeger & Wolk 2013). Because the stellar rotation period is identical or nearly so to the planetary orbital period, identification of persistent interaction requires long-epoch studies. Walker et al. (2007) do indeed find that starspot activity is concentrated near a fixed orbital phase. However, as noted by Shkolnik et al. (2008), tidal locking of the star to the planet would produce low relative velocities between field lines, limiting the energy available in magnetic interactions.
HD 162020 is a cool ( K) star that is categorized as pre-main sequence in SIMBAD. Poppenhaeger & Schmitt (2011) consequently exclude it when examining the correlation found by Scharf (2010). It is extremely X-ray luminous, with erg s-1 and , and also has a very massive hot Jupiter, with . There is no measurement of available in the literature.
HD 179949 is a hot ( K) star that is moderately active, with and . It is the first identified candidate to display star-planet interaction (Shkolnik et al. 2003) and has been extensively investigated since, with possible Ca II H and K variability phased with the planet at some epochs but not others (Shkolnik et al. 2008), and potential X-ray star-planet synchronicity identified by Saar et al. (2008). It is now clear that the magnetic field configuration is complex (Fares et al. 2012) and so a simple hotspot model might not be applicable. A recent large XMM-Newton plus optical study of HD 179949 did not find significant evidence of star-planet interaction in either X-rays or Ca II H and K emission (Scandariato et al. 2013).
HD 189733 is a cool ( K) star that hosts a transiting hot Jupiter. As such, it is among the most observed exoplanet systems to date, with numerous deep campaigns at optical (ground-based and HST and X-ray (Chandra and XMM-Newton) wavelengths. The star is active, with and . Pillitteri et al. (2010, 2011, 2014a) find cases of X-ray flaring near orbital phase (i.e., when the planet is behind the star). Shkolnik et al. (2008) find Ca II H and K emission variability to phase with the star but suggest a residual signature of interaction near ; on the other hand, Fares et al. (2010) find no evidence of magnetospheric interactions. Poppenhaeger et al. (2013; also Pillitteri et al. 2014a) find that the companion is not X-ray bright and so the system age is likely older than would be inferred from the activity of the primary.
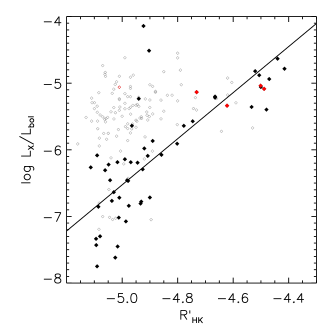
Based on phase-resolved studies of the most promising candidates, in particular HD 179949, the evidence for star-planet interaction is mixed; at best it seems the phenomenon is observable at select epochs. We reiterate that these extreme systems are not X-ray luminous relative to their chromospheric activity (Figure 9), which has been suggested to be the case for star-planet interaction (e.g., Kashyap et al. 2008). It is therefore possible that the most extreme systems are more likely to be active, but for reasons unrelated to direct magnetic interaction.
IV.4. Cumulative tidal effects in extreme systems
Extreme systems are susceptible to cumulative tidal evolution. A close-in gas giant can potentially spin-up its host star, temporarily halting or reversing the usual decline in rotation and dynamo activity with MS age, while gradually shrinking its orbit until infall (Jackson et al. 2009; Debes & Jackson 2010; see also Lanza & Shkolnik 2014 for multi-planet possibilities). There is some observational support for activity rejuvenation in binary systems; for CoRoT-2 and HD 189733, the hot Jupiter hosting primary is active while the companion is X-ray quiescent (Schröter et al. 2011; Pillitteri et al. 2011; Poppenhaeger & Wolk 2013, 2014). In these cases is much larger for the planet than for the companion star, and the lack of simultaneous activity rejuvenation in the companion implies the tidal influence of the planet is more relevant. In addition, Boo is apparently tidally locked to the orbit of its hot Jupiter (Shkolnik et al. 2008) at a rapid rotation period of only 3.2 d, strong evidence for planetary spin-up. At the same time, extreme systems are tidally unstable on timescales that depend sensitively on the orbital semi-major axis, eccentricity, planetary composition, and stellar size. For example, WASP-18 has a 10 planet in a 0.94 day orbit and an estimated age of 700 Myr (Hellier et al. 2009; Pillitteri et al. 2014b); the remaining lifetime of WASP-18b is likely quite short, only 50 Myr (Hellier et al. 2009).161616WASP-18 experiences significant tidal effects from the planet (Arras et al. 2012) and may also be spun-up, although it is still inactive (see Miller et al. 2012, Pillitteri et al. 2014b, and references therein). The relative paucity of hot Jupiter systems with stellar ages above a few Gyr and semi-major axes less than 0.05 AU is cited by Jackson et al. (2009) as reflecting tidal destruction on Gyr timescales. Subsequent age-rotation-activity evolution (unaffected by any remaining outer planets) would then decrease X-ray luminosity by orders of magnitude over the MS lifetime (Ribas et al. 2005). If in fact extreme systems do not survive beyond a few Gyr, then they are primarily present around younger stars that are both inherently more active and susceptible to cumulative tidal spin-up activity rejuvenation.
This interpretation is completely consistent with both the lack of star-planet interaction in the solar analogs (which do not feature the most extreme systems, and are screened to exclude active and likely young stars) and the trend toward greater X-ray luminosities with in the full FGK MS sample. It may be that selection biases (acting primarily at low ) and cumulative tidal influences (relevant primarily at high ) combine to mimic the statistical signature of star-planet interaction. Of course, these effects do not rule out magnetic recombination events producing enhanced activity,171717It has also been suggested that magnetic reconnection events could act to hinder spin down (Lanza 2010) or could decay orbits (Strugarek et al. 2014). but they do suggest that this type of interaction is not required to explain the statistical trends in X-ray studies.
V. UV luminosity and Ca II H and K activity and post-MS evolution
Within an inhomegeous sample spanning a wide range in stellar effective temperature and/or evolutionary stage, it is necessary to consider intrinsic differences in the types of planets preferentially hosted by particular stars. Hotter and more massive stars (i.e., FG versus KM) are more likely to host giant planets (e.g., Fischer & Valenti 2005; Gaidos et al. 2013), possibly a result of core accretion proceeding efficiently in more massive protoplanetary disks (e.g., Laughlin et al. 2004). Evolved subgiant stars are less likely to host hot Jupiters (Johnson et al. 2010), plausibly due to tidal destruction which can operate efficiently on Gyr timescales out to several tenths of an AU given the larger stellar radii in subgiants (Schlaufman & Winn 2013). Empirically, the distribution of Jovian-mass (0.1-13) exoplanets within the EOD includes a greater fraction at for stars with K. However, within our FGK MS sample, shows a similar trend as with (the importance of this check is described by Poppenhaeger et al. 2011), and the extreme systems that drive the correlation span a wide range of temperatures. In addition, there is no significant dependence of or on for these stars. By requiring and inferred stellar radius we have effectively excluded subgiants.
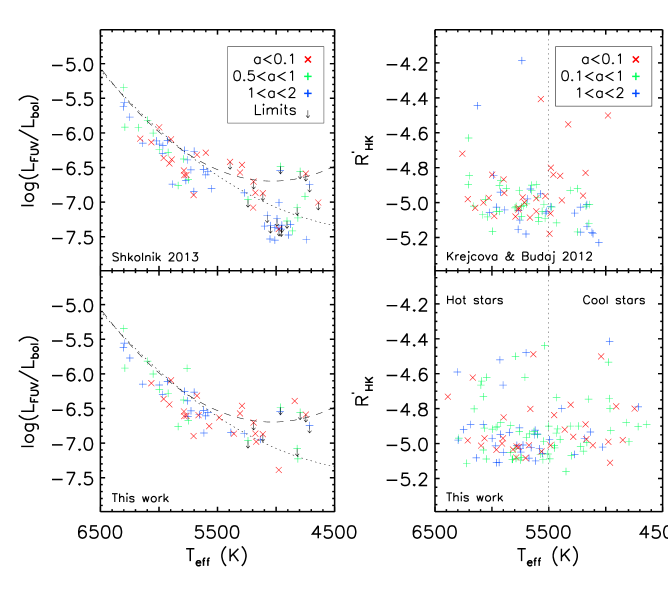
Two additional activity indicators that have been suggested to correlate with planetary properties are UV luminosity and .181818Note that an observed correlation between chromospheric stellar activity and hot Jupiter surface gravities might indicate that atmospheric mass-loss produces circumstellar absorbing material that reduces (Hartman 2010; Fossati et al. 2013; Lanza 2014). Shkolnik (2013) identify a marginal increase in relative UV luminosity for close-in systems ( AU), and Krejčová & Budaj (2012) find evidence that cooler stars (with K) are more active when they contain close-in planets, which contrasts with the findings of Canto-Martins et al. (2011) of no dependence of on . Both Shkolnik (2013) and Krejčová & Budaj (2012) stress that selection effects could be the underlying cause of the trends, and we find that this may indeed be the case, albeit related to stellar evolutionary properties rather than radial velocity sensitivity bias (Figure 10). We confirm that a positive slope is present when comparing for with sytems using the Shkolnik (2013) dataset, but our FGK MS sample does not contain a significant trend. It appears that their result is primarily due to a cluster of cool stars that tend to host distant rather than close-in planets, and that have low UV luminosities that lie well below the temperature-dependent expected UV luminosity that is derived from field stars in Shkolnik (2013) and shown in Figure 10 as a curving dashed line. Either eliminating these cool stars or employing a closer-to-linear correction, for example the ad hoc dotted line in Figure 10, would render insignificant the trend for excess UV luminosity in stars with close-in planets. We also confirm that KS tests produce a significant difference between close-in and distant systems for cool stars using the Krejčová & Budaj (2012) dataset, but again our FGK MS sample does not reproduce this result, and the mean and median values (where measured) for cooler stars are nearly identical and statistically indistinguishable in systems with and AU. Here too, it appears that cool and low-activity stars that tend not to have close-in giant planets help produce the observed trend. As seen in Figure 10, these type of systems are generally much less common within our sample.
The specific cool low-activity stars included in these samples have almost no overlap between the works, but in both cases include subgiants. For example, the cluster of stars with K and in Shkolnik (2013) includes eight objects (HD 5319, 24 Sex, HD 95089, 11 Com, HD 167042, HD 181342, HD 210702, and HD 212771) that are not present in our sample because their inferred radii are (and 6/8 are additionally at pc). The SIMBAD luminosity classes of these eight objects are either III, IV, or unknown. The cluster of stars with K and in Krejčová & Budaj (2012) includes one object in our sample (HD 11964, with a somewhat hotter K) and six excluded (HD 82886, HD 96063, HD 175541, HD 192699, HD 200964, and again HD 212771) because their inferred radii are (and 6/6 are additionally at pc). Many of the cool low-activity stars in Shkolnik (2013) and Krejčová & Budaj (2012) are described as “retired A stars” by Johnson et al. (2008, 2010, 2011; see also Lloyd 2011 and Johnson et al. 2013). Rather than directly supporting magnetic star-planet interaction, the results of the Shkolnik (2013) and Krejčová & Budaj (2012) studies may instead reflect the empirical scarcity of hot Jupiters hosted by subgiants, which effect might itself arise from cumulative star-planet tidal interaction producing eventual planetary infall and destruction (Schlaufman & Winn 2013).
VI. Conclusions
We have conducted a comprehensive investigation of the statistical observability of star-planet interaction, with the following main results:
1. A sample of 23 solar analogs, including 12 newly observed with Chandra, shows no evidence for planet-induced enhancements in X-ray luminosity. Specifically, the slopes for or versus either or (fit in loglog space) are consistent with zero, and exclude systematic increases of 3 in for hot Jupiter systems at 94% confidence.
2. A sample of 198 FGK main-sequence planet-hosting stars (including the 23 solar analogs), of which 62 are X-ray detected, does display a significant correlation between X-ray emission and planetary properties. While selection biases are present, this trend is primarily driven by a handful of extreme systems which are here X-ray luminous.
3. However, the X-ray lumimosities of these extreme systems are consistent with their chromospheric activity, in contrast to published scenarios for magnetic star-planet interaction which predict relatively greater X-ray increases. After removing the relation, the full sample no longer shows a significant correlation between X-ray emission and planetary properties.
4. We postulate that the apparently genuine paucity of inactive FGK MS systems hosting hot Jupiters may result from cumulative tidal interactions, such as planetary spin-up of the host star plausibly followed by planetary infall, destruction, and stellar spin-down on Gyr timescales.
5. There is no significant difference in either UV luminosity or for hot Jupiter versus other planetary systems in our FGK MS sample. This contrasts with some published results, which we demonstrate are strongly influenced by low-activity cool stars that are likely post-MS subgiants that either never formed or destroyed their hot Jupiters.
In summary, we find no positive statistical evidence for magnetic star-planet interaction acting to enhance coronal activity in hot Jupiter systems. However, the cumulative tidal influence of close-in gas giants on their host stars, and perhaps destructively vice-versa, may explain why the most extreme systems generally do have active hosts.
References
- Akritas & Siebert (1996) Akritas, M. G., & Siebert, J. 1996, MNRAS, 278, 919
- Arge et al. (1995) Arge, C. N., Mullan, D. J., & Dolginov, A. Z. 1995, ApJ, 443, 795
- Arras et al. (2012) Arras, P., Burkart, J., Quataert, E., & Weinberg, N. N. 2012, MNRAS, 422, 1761
- Bessell et al. (1998) Bessell, M. S., Castelli, F., & Plez, B. 1998, A&A, 333, 231
- Bodenheimer et al. (2001) Bodenheimer, P., Lin, D. N. C., & Mardling, R. A. 2001, ApJ, 548, 466
- Boss (2006) Boss, A. P. 2006, ApJ, 644, L79
- Budaj (2013) Budaj, J. 2013, A&A, 557, A72
- Butler et al. (1997) Butler, R. P., Marcy, G. W., Williams, E., Hauser, H., & Shirts, P. 1997, ApJ, 474, L115
- Canto Martins et al. (2011) Canto Martins, B. L., Das Chagas, M. L., Alves, S., et al. 2011, A&A, 530, A73
- Cohen et al. (2009) Cohen, O., Drake, J. J., Kashyap, V. L., et al. 2009, ApJ, 704, L85
- Cohen et al. (2011) Cohen, O., Kashyap, V. L., Drake, J. J., et al. 2011, ApJ, 733, 67
- Cuntz et al. (2000) Cuntz, M., Saar, S. H., & Musielak, Z. E. 2000, ApJ, 533, L151
- Debes & Jackson (2010) Debes, J. H., & Jackson, B. 2010, ApJ, 723, 1703
- Fares et al. (2010) Fares, R., Donati, J.-F., Moutou, C., et al. 2010, MNRAS, 406, 409
- Fares et al. (2012) Fares, R., Donati, J.-F., Moutou, C., et al. 2012, MNRAS, 423, 1006
- Feigelson & Nelson (1985) Feigelson, E. D., & Nelson, P. I. 1985, ApJ, 293, 192
- Fischer & Valenti (2005) Fischer, D. A., & Valenti, J. 2005, ApJ, 622, 1102
- Fossati et al. (2013) Fossati, L., Ayres, T. R., Haswell, C. A., et al. 2013, ApJ, 766, L20
- France et al. (2013) France, K., Froning, C. S., Linsky, J. L., et al. 2013, ApJ, 763, 149
- Gaidos et al. (2013) Gaidos, E., Fischer, D. A., Mann, A. W., & Howard, A. W. 2013, ApJ, 771, 18
- Grießmeier et al. (2007) Grießmeier, J.-M., Zarka, P., & Spreeuw, H. 2007, A&A, 475, 359
- Hartman (2010) Hartman, J. D. 2010, ApJ, 717, L138
- Hellier et al. (2009) Hellier, C., Anderson, D. R., Collier Cameron, A., et al. 2009, Nature, 460, 1098
- Hodgson et al. (2014) Hodgson, J. R., Christian, D. J., Bodewits, D., & Hawley, S. 2014, IAU Symposium, 299, 291
- Isaacson & Fischer (2010) Isaacson, H., & Fischer, D. 2010, ApJ, 725, 875
- Jackson et al. (2009) Jackson, B., Barnes, R., & Greenberg, R. 2009, ApJ, 698, 1357
- Jackson et al. (2010) Jackson, B., Miller, N., Barnes, R., et al. 2010, MNRAS, 407, 910
- Johnson et al. (2008) Johnson, J. A., Marcy, G. W., Fischer, D. A., et al. 2008, ApJ, 675, 784
- Johnson et al. (2010) Johnson, J. A., Howard, A. W., Bowler, B. P., et al. 2010, PASP, 122, 701
- Johnson et al. (2011) Johnson, J. A., Payne, M., Howard, A. W., et al. 2011, AJ, 141, 16
- Johnson et al. (2013) Johnson, J. A., Morton, T. D., & Wright, J. T. 2013, ApJ, 763, 53
- Kashyap et al. (2008) Kashyap, V. L., Drake, J. J., & Saar, S. H. 2008, ApJ, 687, 1339
- Kaib et al. (2013) Kaib, N. A., Raymond, S. N., & Duncan, M. 2013, Nature, 493, 381
- Kitchatinov & Olemskoy (2011) Kitchatinov, L. L., & Olemskoy, S. V. 2011, MNRAS, 411, 1059
- Kraft et al. (1991) Kraft, R. P., Burrows, D. N., & Nousek, J. A. 1991, ApJ, 374, 344
- Krejčová & Budaj (2012) Krejčová, T., & Budaj, J. 2012, A&A, 540, A82
- Lai (2012) Lai, D. 2012, ApJ, 757, L3
- Lammer et al. (2003) Lammer, H., Selsis, F., Ribas, I., et al. 2003, ApJ, 598, L121
- Lanza (2008) Lanza, A. F. 2008, A&A, 487, 1163
- Lanza (2009) Lanza, A. F. 2009, A&A, 505, 339
- Lanza (2010) Lanza, A. F. 2010, A&A, 512, A77
- Lanza et al. (2011) Lanza, A. F., Bonomo, A. S., Pagano, I., et al. 2011, A&A, 525, A14
- Lanza (2012) Lanza, A. F. 2012, A&A, 544, A23
- Lanza (2013) Lanza, A. F. 2013, A&A, 557, A31
- Lanza (2014) Lanza, A. F. 2014, arXiv:1410.8363
- Lanza & Shkolnik (2014) Lanza, A. F., & Shkolnik, E. L. 2014, MNRAS, 443, 1451
- Laughlin et al. (2004) Laughlin, G., Bodenheimer, P., & Adams, F. C. 2004, ApJ, 612, L73
- Lecavelier des Etangs et al. (2013) Lecavelier des Etangs, A., Sirothia, S. K., Gopal-Krishna, & Zarka, P. 2013, A&A, 552, A65
- Lloyd (2011) Lloyd, J. P. 2011, ApJ, 739, L49
- Mamajek & Hillenbrand (2008) Mamajek, E. E., & Hillenbrand, L. A. 2008, ApJ, 687, 1264
- Miller et al. (2012) Miller, B. P., Gallo, E., Wright, J. T., & Dupree, A. K. 2012, ApJ, 754, 137
- Niedzielski et al. (2014) Niedzielski, A., Villaver, E., Wolszczan, A., et al. 2014, arXiv:1410.5971
- Pevtsov et al. (2003) Pevtsov, A. A., Fisher, G. H., Acton, L. W., et al. 2003, ApJ, 598, 1387
- Pillitteri et al. (2010) Pillitteri, I., Wolk, S. J., Cohen, O., et al. 2010, ApJ, 722, 1216
- Pillitteri et al. (2011) Pillitteri, I., Günther, H. M., Wolk, S. J., Kashyap, V. L., & Cohen, O. 2011, ApJ, 741, L18
- Pillitteri et al. (2014) Pillitteri, I., Wolk, S. J., Lopez-Santiago, J., et al. 2014a, ApJ, 785, 145
- Pillitteri et al. (2014) Pillitteri, I., Wolk, S. J., Sciortino, S., & Antoci, V. 2014b, A&A, 567, AA128
- Poppenhaeger et al. (2009) Poppenhäger, K., Robrade, J., Schmitt, J. H. M. M., & Hall, J. C. 2009, A&A, 508, 1417
- Poppenhaeger et al. (2010) Poppenhäger, K., Robrade, J., & Schmitt, J. H. M. M. 2010, A&A, 515, A98
- Poppenhaeger & Schmitt (2011) Poppenhäger, K., & Schmitt, J. H. M. M. 2011, ApJ, 735, 59
- Poppenhaeger et al. (2011) Poppenhaeger, K., Lenz, L. F., Reiners, A., Schmitt, J. H. M. M., & Shkolnik, E. 2011, A&A, 528, A58
- Poppenhaeger et al. (2012) Poppenhaeger, K., Czesla, S., Schröter, S., et al. 2012, A&A, 541, A26
- Poppenhaeger et al. (2013) Poppenhaeger, K., Schmitt, J. H. M. M., & Wolk, S. J. 2013, ApJ, 773, 62
- Poppenhaeger & Wolk (2013) Poppenhaeger, K., & Wolk, S. J. 2013, arXiv:1309.6356
- Poppenhaeger & Wolk (2014) Poppenhaeger, K., & Wolk, S. J. 2014, A&A, 565, LL1
- Pye et al. (1994) Pye, J. P., Hodgkin, S. T., Stern, R. A., & Stauffer, J. R. 1994, MNRAS, 266, 798
- Rappaport et al. (2012) Rappaport, S., Levine, A., Chiang, E., et al. 2012, ApJ, 752, 1
- Raghavan et al. (2006) Raghavan, D., Henry, T. J., Mason, B. D., et al. 2006, ApJ, 646, 523
- Ribas et al. (2005) Ribas, I., Guinan, E. F., Güdel, M., & Audard, M. 2005, ApJ, 622, 680
- Roell et al. (2012) Roell, T., Neuhäuser, R., Seifahrt, A., & Mugrauer, M. 2012, A&A, 542, A92
- Rubenstein & Schaefer (2000) Rubenstein, E. P., & Schaefer, B. E. 2000, ApJ, 529, 1031
- Saar et al. (2004) Saar, S. H., Cuntz, M., & Shkolnik, E. 2004, Stars as Suns : Activity, Evolution and Planets, 219, 355
- Saar et al. (2008) Saar, S. H., Cuntz, M., Kashyap, V. L., & Hall, J. C. 2008, IAU Symposium, 249, 79
- Saar & Testa (2012) Saar, S. H., & Testa, P. 2012, IAU Symposium, 286, 335
- Sanz-Forcada et al. (2013) Sanz-Forcada, J., Stelzer, B., & Metcalfe, T. S. 2013, A&A, 553, L6
- Saur et al. (2013) Saur, J., Grambusch, T., Duling, S., Neubauer, F. M., & Simon, S. 2013, A&A, 552, A119
- Scandariato et al. (2013) Scandariato, G., Maggio, A., Lanza, A. F., et al. 2013, A&A, 552, A7
- Scharf (2010) Scharf, C. A. 2010, ApJ, 722, 1547
- Schlaufman & Winn (2013) Schlaufman, K. C., & Winn, J. N. 2013, ApJ, 772, 143
- Schröter et al. (2011) Schröter, S., Czesla, S., Wolter, U., et al. 2011, A&A, 532, A3
- Shkolnik et al. (2003) Shkolnik, E., Walker, G. A. H., & Bohlender, D. A. 2003, ApJ, 597, 1092
- Shkolnik et al. (2005) Shkolnik, E., Walker, G. A. H., Bohlender, D. A., Gu, P.-G., Kürster, M. 2005, ApJ, 622, 1075
- Shkolnik et al. (2008) Shkolnik, E., Bohlender, D. A., Walker, G. A. H., & Collier Cameron, A. 2008, ApJ, 676, 628
- Shkolnik (2013) Shkolnik, E. L. 2013, ApJ, 766, 9
- Stevens (2005) Stevens, I. R. 2005, MNRAS, 356, 1053
- Strugarek et al. (2014) Strugarek, A., Brun, A. S., Matt, S. P., & Réville, V. 2014, ApJ, 795, 86
- Turner et al. (2013) Turner, J. D., Smart, B. M., Hardegree-Ullman, K. K., et al. 2013, MNRAS, 428, 678
- Turner et al. (2014) Turner, J., Smart, B., Pearson, K., et al. 2014, American Astronomical Society Meeting Abstracts, 223, #347.13
- van Leeuwen (2007) van Leeuwen, F. 2007, A&A, 474, 653
- Vidotto et al. (2011) Vidotto, A. A., Jardine, M., & Helling, C. 2011, MNRAS, 411, L46
- Walker et al. (2008) Walker, G. A. H., Croll, B., Matthews, J. M., et al. 2008, A&A, 482, 691
- Wittenmyer et al. (2009) Wittenmyer, R. A., Endl, M., Cochran, W. D., Levison, H. F., & Henry, G. W. 2009, ApJS, 182, 97
- Wright et al. (2004) Wright, J. T., Marcy, G. W., Butler, R. P., & Vogt, S. S. 2004, ApJS, 152, 261
- Wright et al. (2011) Wright, J. T., Fakhouri, O., Marcy, G. W., et al. 2011, PASP, 123, 412
- Wright et al. (2012) Wright, J. T., Marcy, G. W., Howard, A. W., et al. 2012, ApJ, 753, 160
- Wright & Gaudi (2013) Wright, J. T., & Gaudi, B. S. 2013, Exoplanet Detection Methods in Planets, Stars and Stellar Systems. Volume 3, 489
- Wu & Lithwick (2013) Wu, Y., & Lithwick, Y. 2013, ApJ, 772, 74