Viral Misinformation: The Role of Homophily and Polarization
Abstract
The spreading of unsubstantiated rumors on online social networks (OSN) either unintentionally or intentionally (e.g., for political reasons or even trolling) can have serious consequences such as in the recent case of rumors about Ebola causing disruption to health-care workers. Here we show that indicators aimed at quantifying information consumption patterns might provide important insights about the virality of false claims. In particular, we address the driving forces behind the popularity of contents by analyzing a sample of Facebook Italian users consuming different (and opposite) types of information (science and conspiracy news). We show that users’ engagement across different contents correlates with the number of friends having similar consumption patterns (homophily), indicating the area in the social network where certain types of contents are more likely to spread. Then, we test diffusion patterns on an external sample of intentional satirical false claims showing that neither the presence of hubs (structural properties) nor the most active users (influencers) are prevalent in viral phenomena. Instead, we found out that in an environment where misinformation is pervasive, users’ aggregation around shared beliefs may make the usual exposure to conspiracy stories (polarization) a determinant for the virality of false information.
1 Introduction
The Web has become pervasive and digital technology permeates every aspect of daily life. Social interaction, healthcare activity, political engagement, and economic decision-making are influenced by the digital hyperconnectivity [1, 2, 3, 4, 5, 6, 7, 8]. Nowadays, everyone can produce and access a variety of information actively participating in the diffusion and reinforcement of narratives, by which we mean information coherent with a given worldview. Such a shift of paradigm in the consumption of information has profoundly affected the way people get informed[9, 10, 11, 12, 13, 14, 15]. However, the role of the socio-technical systems in shaping the public opinion still remains unclear. Indeed, the spreading of unsubstantiated rumors, whether it is unintentional or intentional (e.g., for political reasons or even trolling), could have serious consequences; the World Economic Forum has listed massive digital misinformation as one of the main risks for the modern society [16].
On online social networks, users discover and share information with their friends and through cascades of reshares information might reach a large number of individuals. Cascades are rare [17], but are common on online social media such as Facebook or Twitter [18, 19, 20]. Interesting is the popular case of Senator Cirenga’s [21, 22] law proposing to fund policy makers with 134 million of euros (10% of the Italian GDP) in case of defeat in the political competition. This was an intentional joke – the text of the post was explicitly mentioning its provocative nature – that became popular within online political activists to an extent that it has been used as an argumentation in political debates [23]. The information overload mixed with users’ limited attention may facilitate the creation of urban legends.
Predicting the evolution of cascades is far from trivial [24]. In this work, we want to understand the driving forces behind the popularity of contents accounting for the users information consumption patterns. To this end, we focus on two very distinct types of information: scientific and conspiracy news. The former are aiming at diffusing scientific knowledge as well as scientific thinking, while the latter provide alternative arguments that are difficult to substantiate. Conspiracists tend to reduce the complexity of reality by explaining significant social or political occurrences as plots conceived by powerful individuals or organizations. Since these kinds of arguments can sometimes involve the rejection of science, alternative explanations are invoked to replace the scientific evidence [25]. For instance, people who reject the link between HIV and AIDS generally believe that AIDS was created by the U.S. Government to control the African American population [26, 27]. Just recently, the fear of an Ebola outbreak in the United States rippled through social media networks [28, 29, 30]. Furthermore, the spread of misinformation can be particularly difficult to correct [31, 32, 33, 34]. In fact, recently, in [35] it has been shown that conspiracist and mainstream information reverberate in a similar way on social media and that users generally exposed to conspiracy stories are the more prone to like and share satirical information [36]. Meanwhile, scientific debunking on conspiracy rumors creates a reinforcement effect in consuming conspiracist information on polarized users [34].
Virality of unsubstantiated rumors. In this work, we analyze a sample of Facebook Italian users consuming different (and opposite) kind of information: scientific and conspiracy news. We observe that users engagement across different contents correlates with the number of friends having similar consumption patterns (homophily). Then, we focus on the popularity of posts of the two categories, finding that both present similar statistical signatures. Finally, we test this diffusion patterns on an external sample of intentional false information – satirical version and paradoxical claims – confirming that neither hubs (structural properties) nor the most active users (influencers) are relevant to characterize viral phenomena. Our analysis shows that where misinformation is pervasive, users’ aggregation around shared beliefs makes the frequent exposure to conspiracy stories (polarization) a determinant for the virality of false information. Furthermore, we provide important insights toward the understanding of viral processes around false information on online social media. In particular, through the relation between the users’ engagement and the number of friends, we provide new metrics – i.e., users polarization defined on the information consumption patterns – to detect areas in the social network where false claims are more likely to spread. We conclude the paper showing a nice case study about the role of the frequent exposure to conspiracy stories (polarization) on the virality of false information.
2 Related Works
Recent studies explored the evolution of social phenomena on online social networks from observable data; one of the most investigated aspects are the structural properties and their effect on social dynamics [10, 37, 38]. The strength of weak ties is currently matter of debate. In fact, in [38] it is shown that while long ties are relevant in the spreading of innovation and social movements, they are not enough to spread social reinforcement. In [10] the author found evidence of an effect of reinforcement in the adoption for clustered networks, where many redundant ties are present. In a more recent work [37], the number of different connected components, representing separate social contexts for the user, proved to be more influential than the number of friends itself and other properties of potential influencers have been addressed in [39]. Another interesting challenge is the one studying the possibility to distinguish influence from homophily [40, 41, 42]. In [40] it is performed over the global network of instant messaging traffic among about 30 millions users on Yahoo.com, with complete data on the adoption of a mobile service application and precise dynamic behavioral data on users. The effect of homophily proves to explain more than of the phenomena perceived as contagion. In [41] the role of social network and exposure to friends’ activities in information re-sharing on Facebook is analyzed. Through controlled experiments in which user were divided in exposed and not exposed to friends’ re-sharing, authors were able to isolate contagion from other confounding effects like homophily. They claimed that in the exposed case there is a considerably higher chance to share contents.
Recent studies settled on Facebook aimed at unfolding cascades characteristics [18] and predicting their trajectories and shapes [43]. As for the characteristics, it is found that a small but significant fraction of posts forms wide and deep cascades and that different cascades may evolve in different ways. Many aspects of cascades’ behavior – e.g., under which structural and user-constrained properties is possible to predict them – are hard tasks that have not been completely exploited. In the last years, a new online phenomenon is attracting the interest of the researchers community, the spreading of unsubstantiated and false claims through OSN (as Facebook), that often reverberate leading to mass misinformation. The study in [35] is a detailed analysis of the information consumption by Facebook users on different categories of pages: alternative information sources, political activism and mainstream media. Authors pointed out evidences that mainstream media information reverberate as long as unsubstantiated one, and that the exposition to the latter makes users more likely to interact with intentionally injected false information. More recently, in [34] it has been shown that the exposure to debunking posts might increase the engagement of users in consuming conspiracy information.
3 Data Collection
In this work, we aim at testing the relationship of content consumption with respect to social networks’ structure and viral phenomena. To do this, we need to clearly identify sources that are promoting different contents referring to opposite worldviews. We define the space of our investigation with the help of Facebook groups very active in the debunking of conspiracy theses (see the acknowledgements section for further details). We started from 73 public Facebook pages, from which 34 are about scientific news and 39 about news that can be considered conspiratorial; we refer to the former as science pages and to the latter as conspiracy pages. In Table 1 we summarize the details of our data collection. We downloaded all posts from these pages in a timespan of 4 years (2010 to 2014). In addition, we collected all the likes and comments from the posts, and we counted the number of shares111Unfortunately, although Facebook provides this number for a given post, it provides the IDs of only a small number of the sharers.. In total, we collected around likes and comments, performed by about and Facebook users, respectively (see Table 1). Likes, shares, and comments have a different meaning from the user viewpoint. Most of the times, a like stands for a positive feedback to the post; a share expresses the will to increase the visibility of a given information; and a comment is the way in which online collective debates take form. Comments may contain negative or positive feedbacks with respect to the post.
In addition, we collected the ego networks of users who liked at least one post on science or conspiracy pages222We used publicly available data, so we collected only data for which the users had the corresponding permissions open. We estimated that these form a percentage of more than of the total connections, allowing us to perform a meaningful analysis regarding the connections between users., that is, for each of these users we collected the list of friends and the links between them. This allowed us to create a social network of users and the (publicly declared) connections between them for a total of about nodes and edges.
| Total | Science | Conspiracy | |
|---|---|---|---|
| Pages | |||
| Posts | |||
| Likes | |||
| Comments | |||
| Shares | |||
| Likers | |||
| Commenters |
Finally, we obtained access to posts from two satirical Facebook pages (to which we will refer to as troll posts and troll pages) promoting intentionally false and caricatural version of the most debated issues. The more popular of the two is called called “Semplicemente Me”, it is followed by about users and it is focused on general online rumors. The second one is called “Simply Humans”, it is followed by about users, and it hosts mostly posts of conspiratorial nature. We collected about likes and comments on these posts, performed by about and Facebook users, respectively. These pages were able to trigger several viral phenomena, with one of them reaching more than shares. In Section 7, we use troll memes to measure how the social ecosystem under investigation is responding to the injection of false information.
4 Preliminaries and Definitions
Here we describe how we preprocess our dataset and provide some of the basic definitions that we use throughout the entire paper. Let be the set of all the posts in our collection, and define () as the set of posts posted on one of the 34 (39) Facebook pages about science (conspiracy) news. We call posts that were posted in pages about science, science posts, and similarly for conspiracy posts. Let be the set of all the users that we observed and the set of edges representing the Facebook friendship connections between them. These define a graph .
We also define the graph of likes, , which is the subgraph of composed of users who have liked at least one post. Thus, is the set of users of who have liked at least one post, and we set .
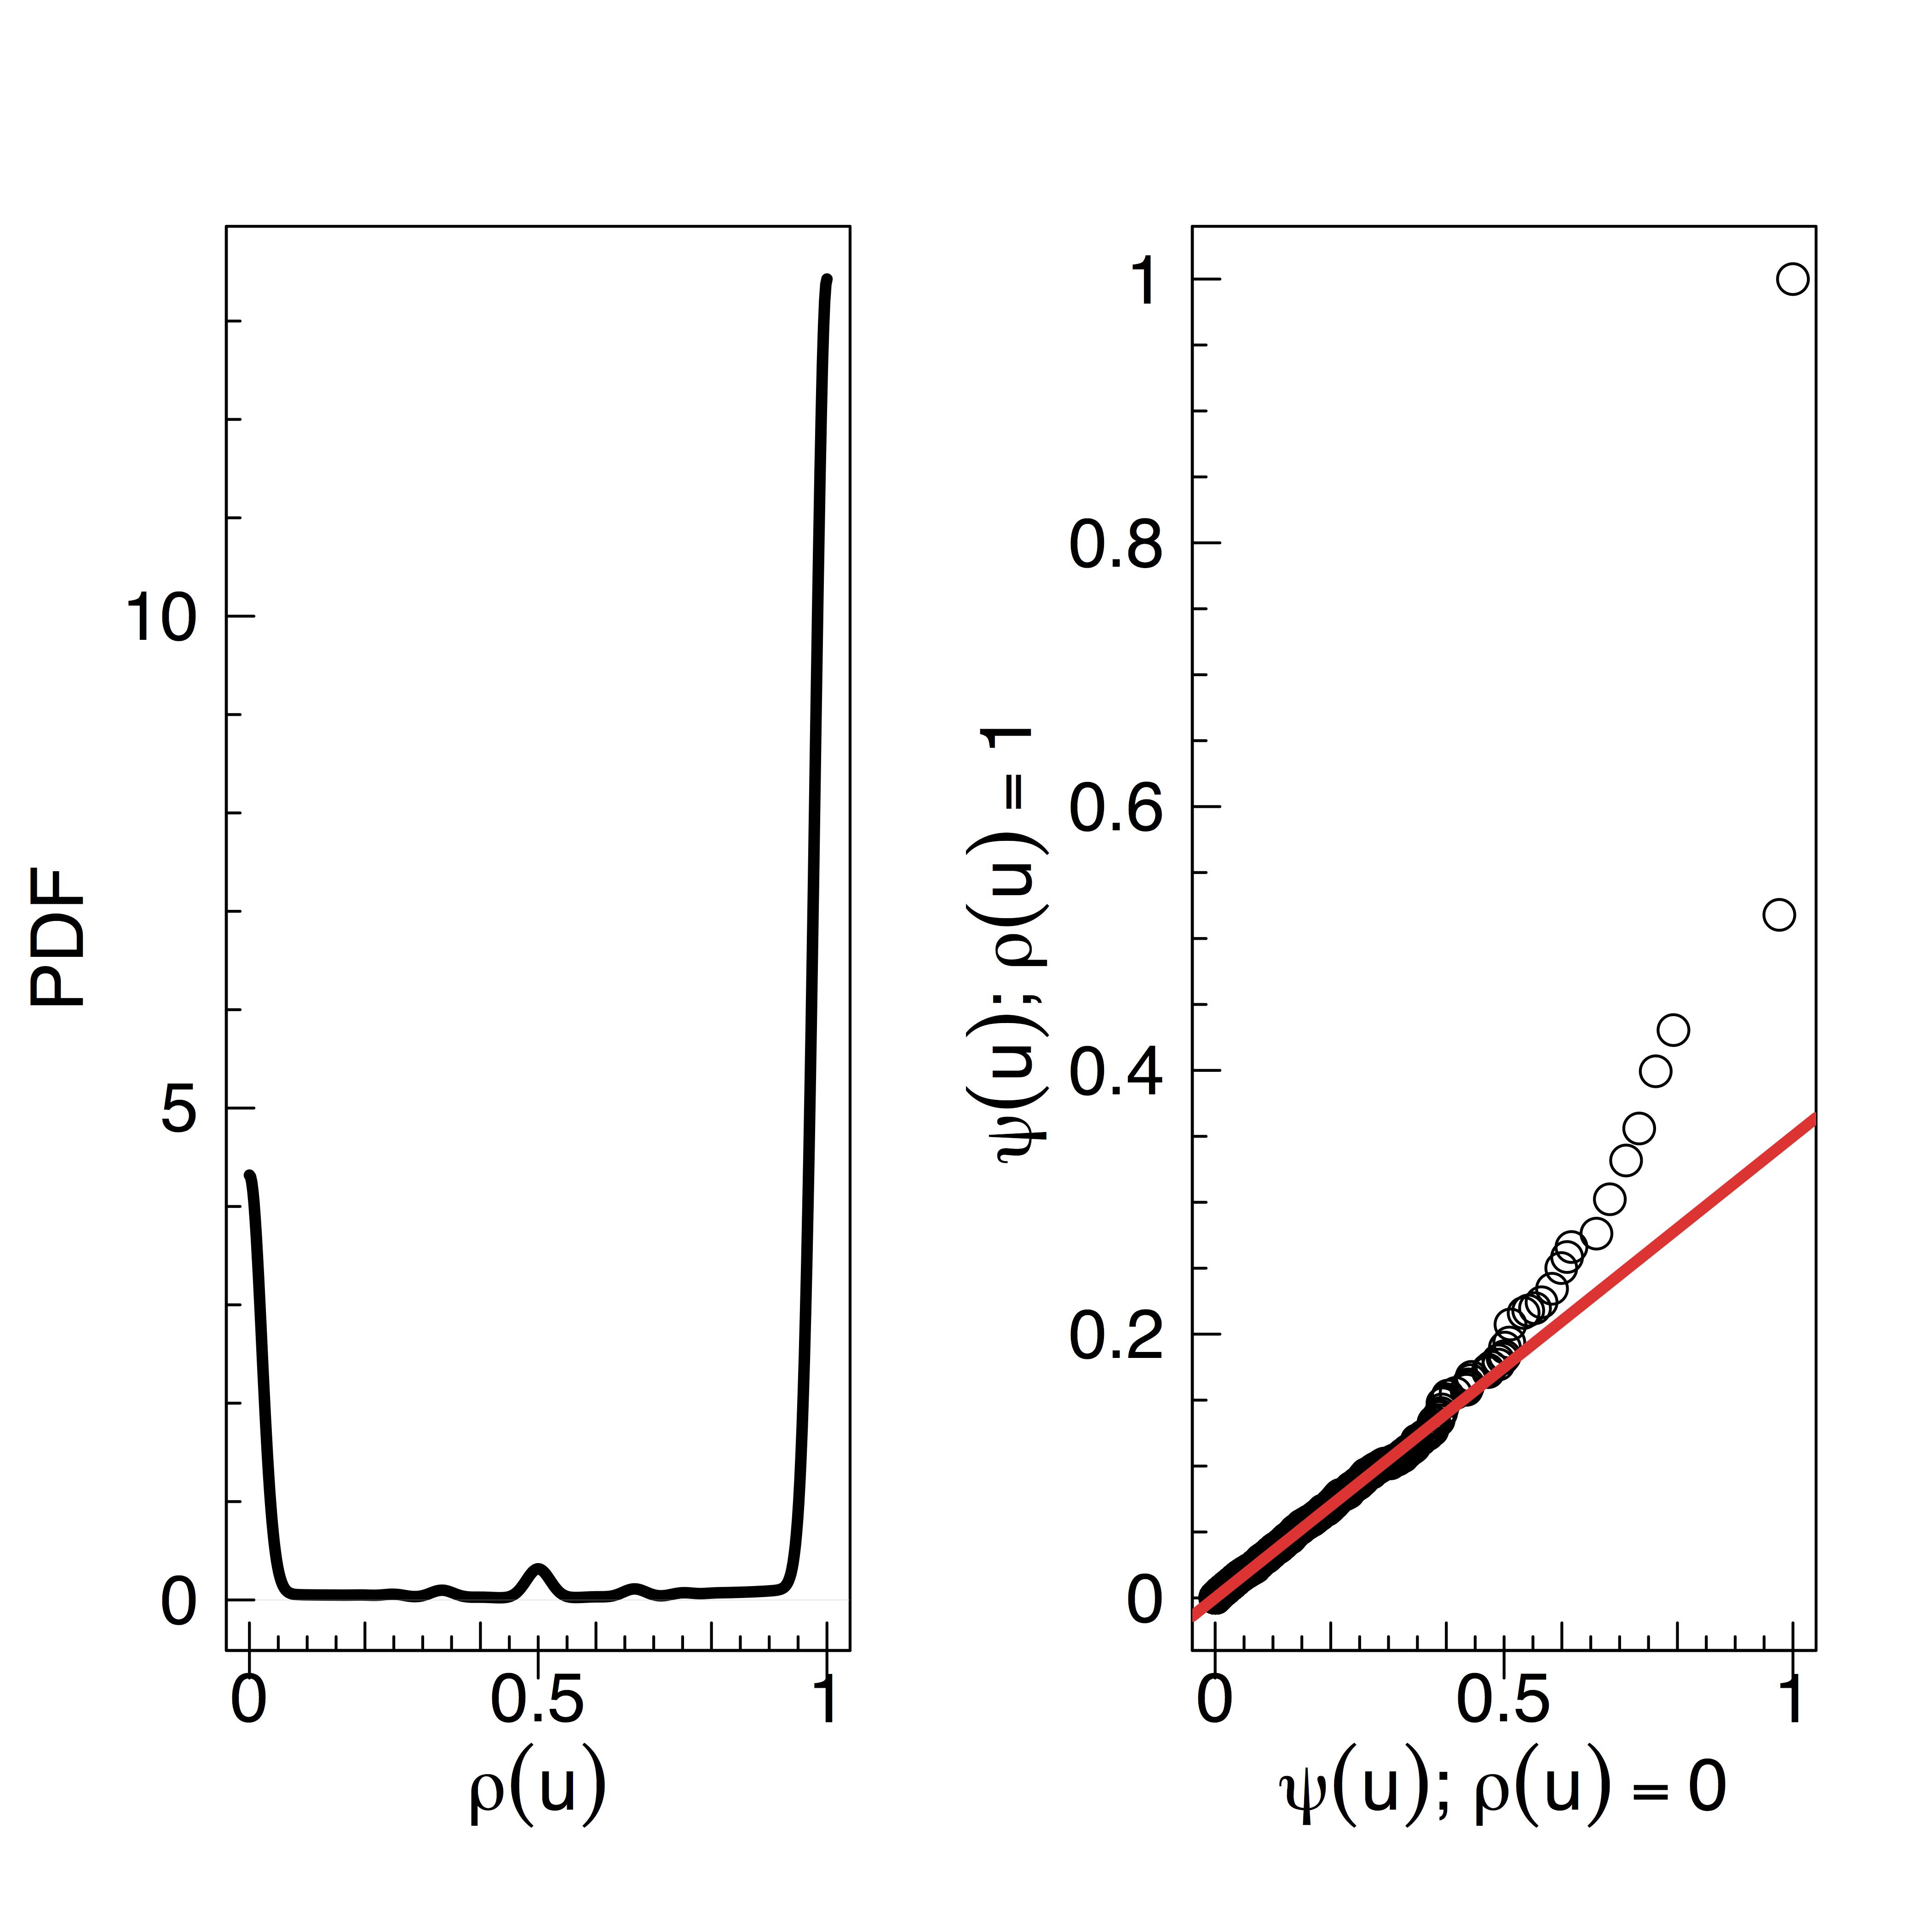
For each user let be the total number of likes that has expressed in posts in our collection . We define and call it the engagement of user as the normalized liking activity with respect to of all the users in our dataset, namely . We are interested in learning the extent to which users are polarized in a given content. Following previous works [35, 36, 34], we are interested in studying the polarization of users, which we informally define as the tendency of users to interact about only with a single type of information. Here we study the polarization towards science and conspiracy. To quantify it, we define the polarization of user , , as the ratio of likes that has performed on conspiracy posts: assuming that has performed and likes on science and conspiracy posts, respectively, we let . Thus, a user for whom is polarized towards science, whereas a user with is polarized towards conspiracy. Note that we use the liking activity to define polarization and we ignore the commenting activity. The former is usually an explicit endorsement of the original post, whereas a comment may be an endorsement, a criticism, or even a response to a previous comment.
In Figure 1 we depict the polarization of all the users in . On the left panel, we show the probability density function (PDF). Recall that value corresponds to users who have liked only science posts and value to users who have liked only conspiracy posts. From the plots it is evident that the vast majority of the users are polarized either towards science or towards conspiracy. Moreover, the quantile–quantile comparison shows that distributions of the number of likes for users totally polarized towards science and conspiracy – i.e, the distributions of the values and – are very similar. To further details on the interaction between users on the two categories refer to [36]. Findings depicted in Figure 1 suggest that most of the likers can be divided into two sets, those polarized towards science and those polarized towards conspiracy news. Let be the users with polarization more than towards science (i.e., less than towards conspiracy), formally:
and the users with polarization more than towards conspiracy, namely
For convenience, we call the first set of users science users and the second one conspiracy users, without implying that the former are scientists or that the latter necessarily believe in conspiracy theories. Note that these two sets contain most of the users in the peaks in Figure 1. We also experimented with values ranging from to , and the results were qualitatively the same. We can then define the induced subgraphs of , and in the natural way, for example, contains all the edges in such that both endpoints are in . In Section 6 we study those two graphs extensively.
We also define some of the graph-theoretic terms that we use throughout the paper. In general, nodes in the graphs represent the Facebook users of our study. For convenience, we use the terms node and user interchangeably. We assume that a graph to which we refer is clear from the context. The degree of node , , is the number of neighbors of node . The clustering coefficient of is the number of closed triplets over the total number of triplets (we use the time-efficiently method). The -core of a graph is the maximal subgraph of such that the degree of each node in is at least . The coreness of a vertex is if it belongs to the -core but not to the -core. The density of a graph with nodes and edges is : the ratio of the number of existing edges over all the possible edges.
Finally, we introduce some statistical notions that we use in Section 5 to analyze how science and conspiracy information is consumed. Let us define a random variable on the interval , indicaticating the time an event takes place (we will use it to represent the time elapsed from the time a post was posted till a given user liked it). The cumulative distribution function (CDF), , indicates the probability that the event takes place within a given time . The survival function, defined as the complementary CDF (CCDF)333We remind that the CCDF of a random variable is one minus the CDF, the function . of , gives the probability that an event lasts beyond a given time period . To estimate this probability we use the Kaplan–Meier estimate [44]. Let denote the number of posts being liked before a given time step , and let denote the number of posts stop being liked at . Then, the estimated survival probability after time is defined as . Then, if we have observations at times , assuming that the events at times are jointly independent, the Kaplan–Meier estimate of the survival function at time is defined as .
5 Users and Contents
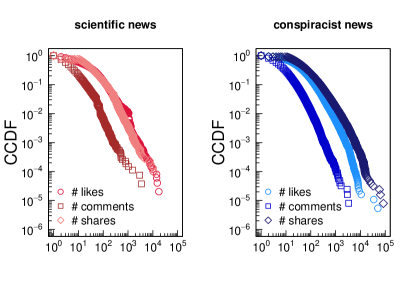
In this section, we study how users consume information from science and conspiracy pages. Figure 2 shows the empirical complementary cumulative distribution function (CCDF) of the number of likes, comments, and shares of posts in and .
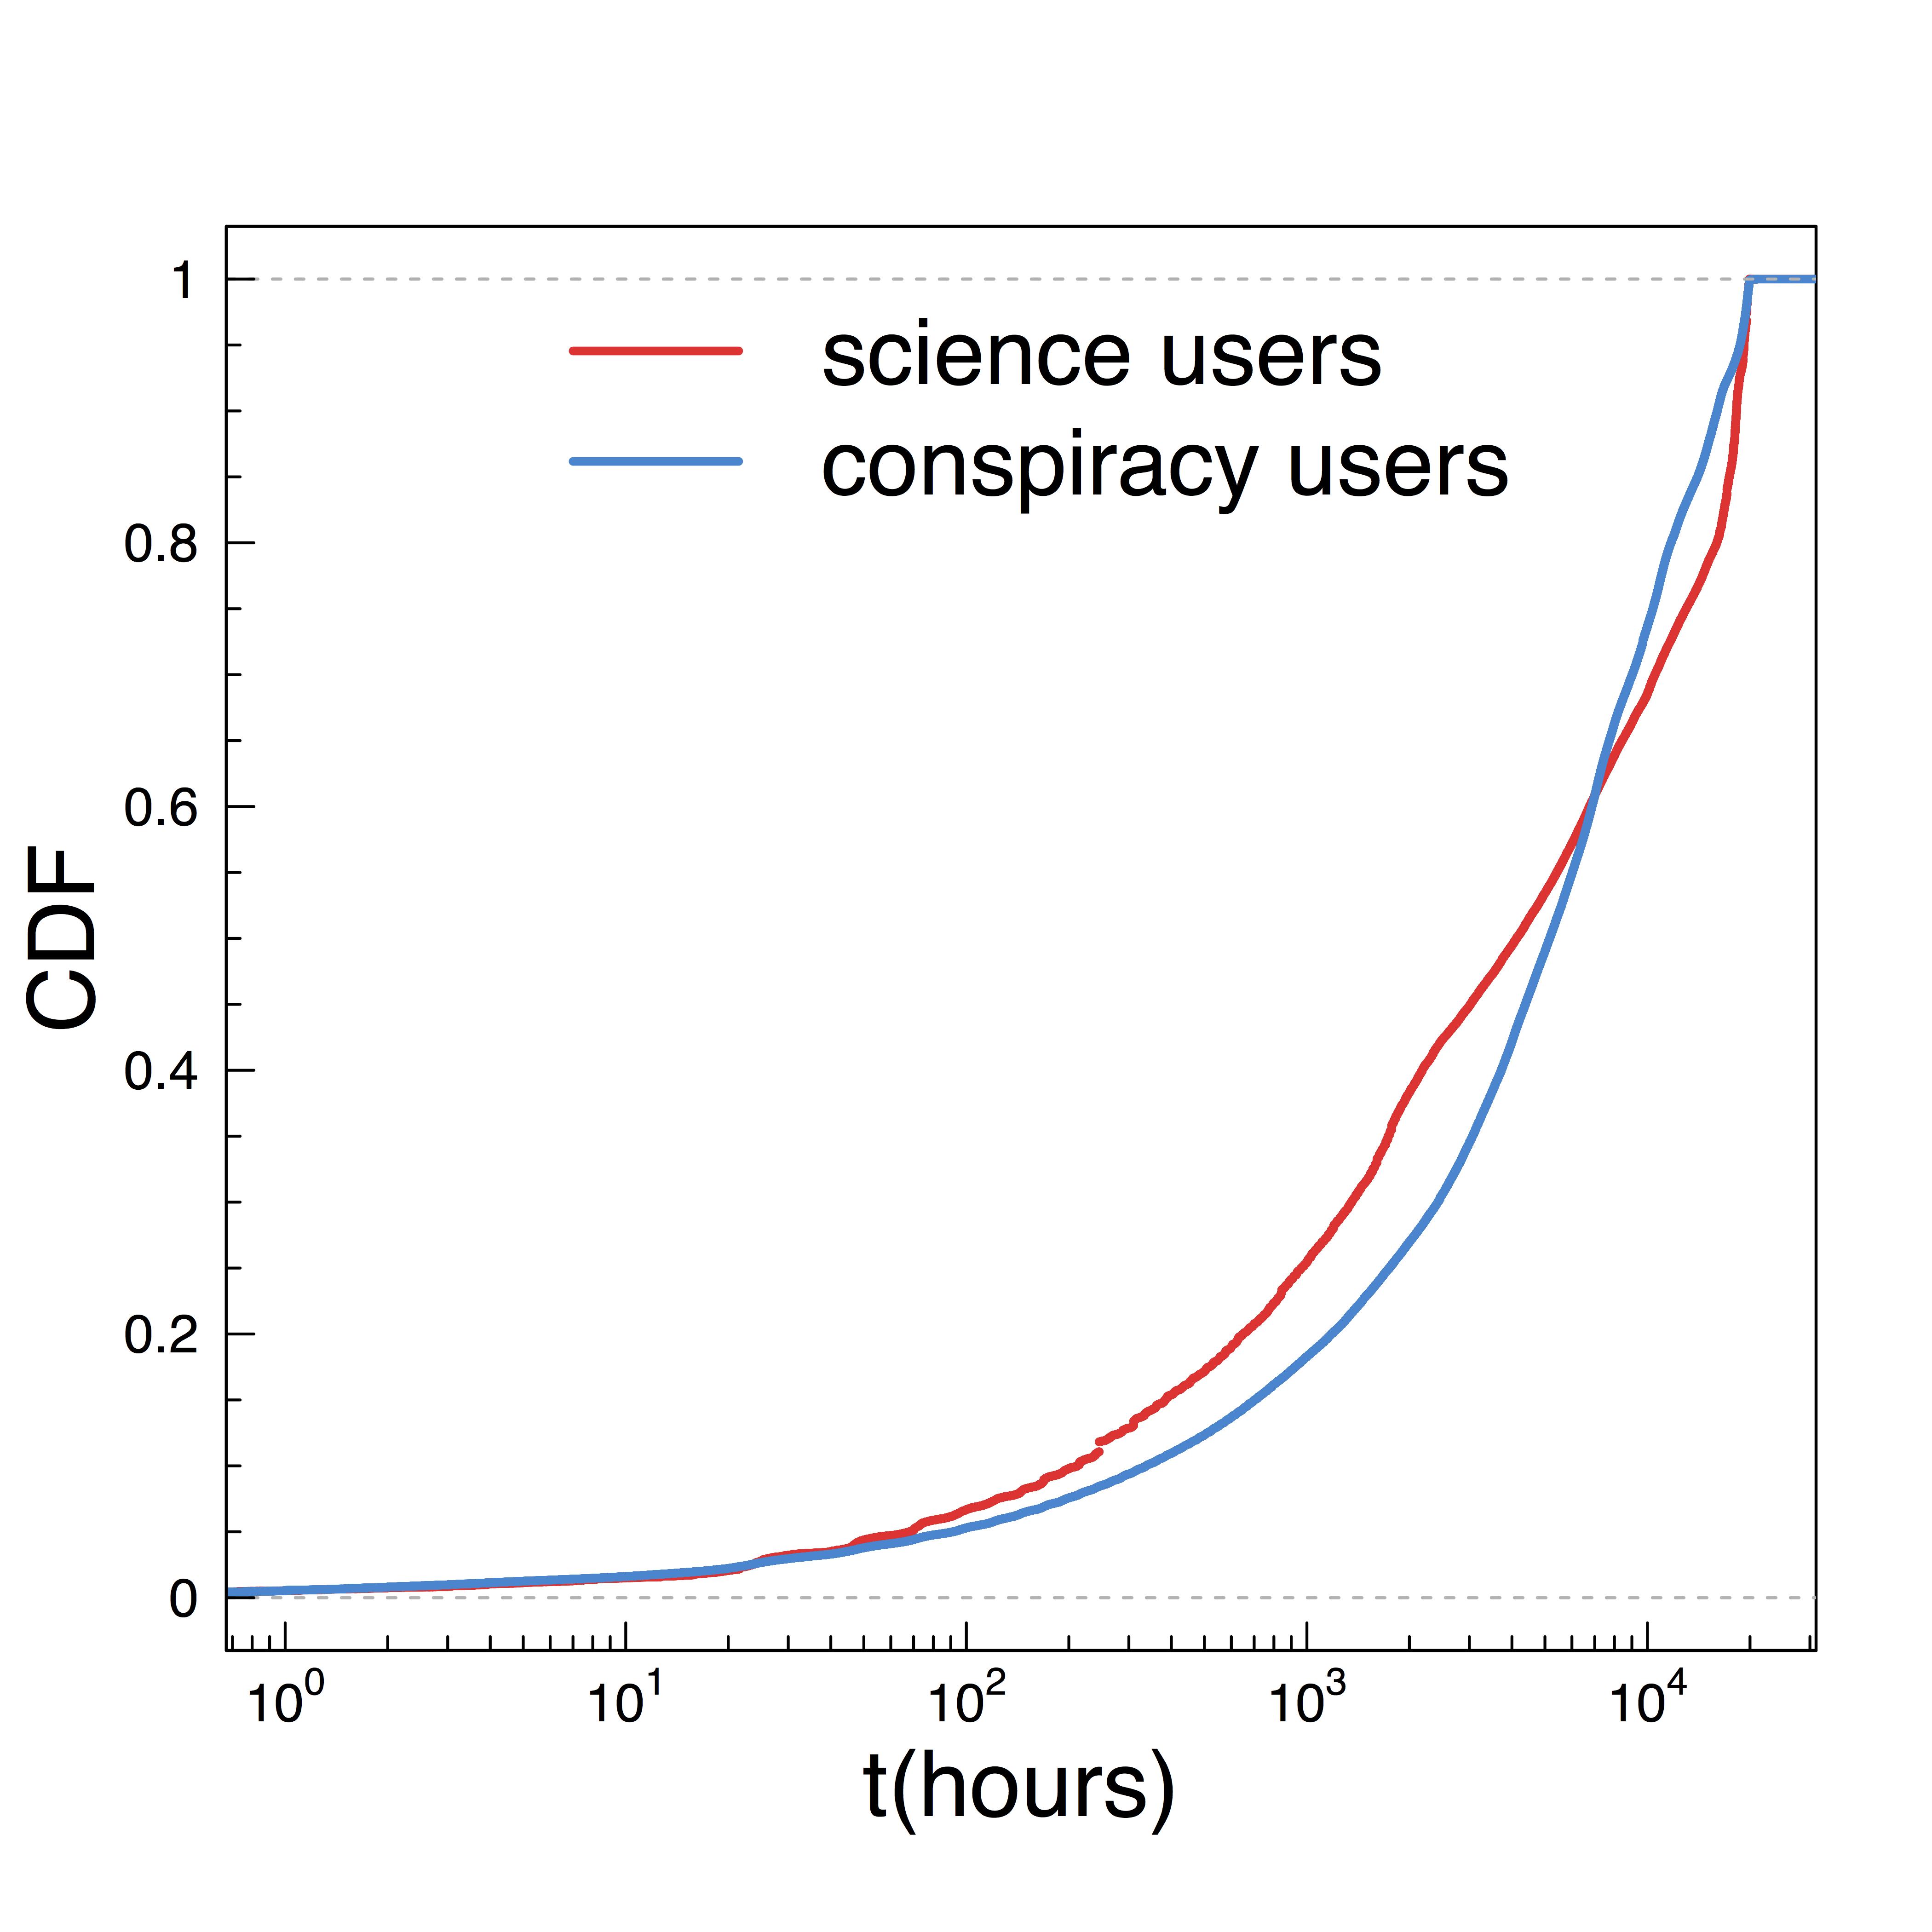
Now, we concentrate on the users and we measure how the science and conspiracy users (i.e., users in and ) keep on consuming information in and over time. Figure 3 shows the empirical cumulative distribution function (CDF) for the lifetime of and on posts in and , respectively. The lifetime of a user is the difference of the post time of the last and first post in that she liked, and similarly for the lifetime of users in .
Finally, we put our attention on the lifetime of and by computing their empirical Survival Function. Figure 4 shows the Kaplan–Meier estimate and 95% confidence intervals for the Survival Function of and .
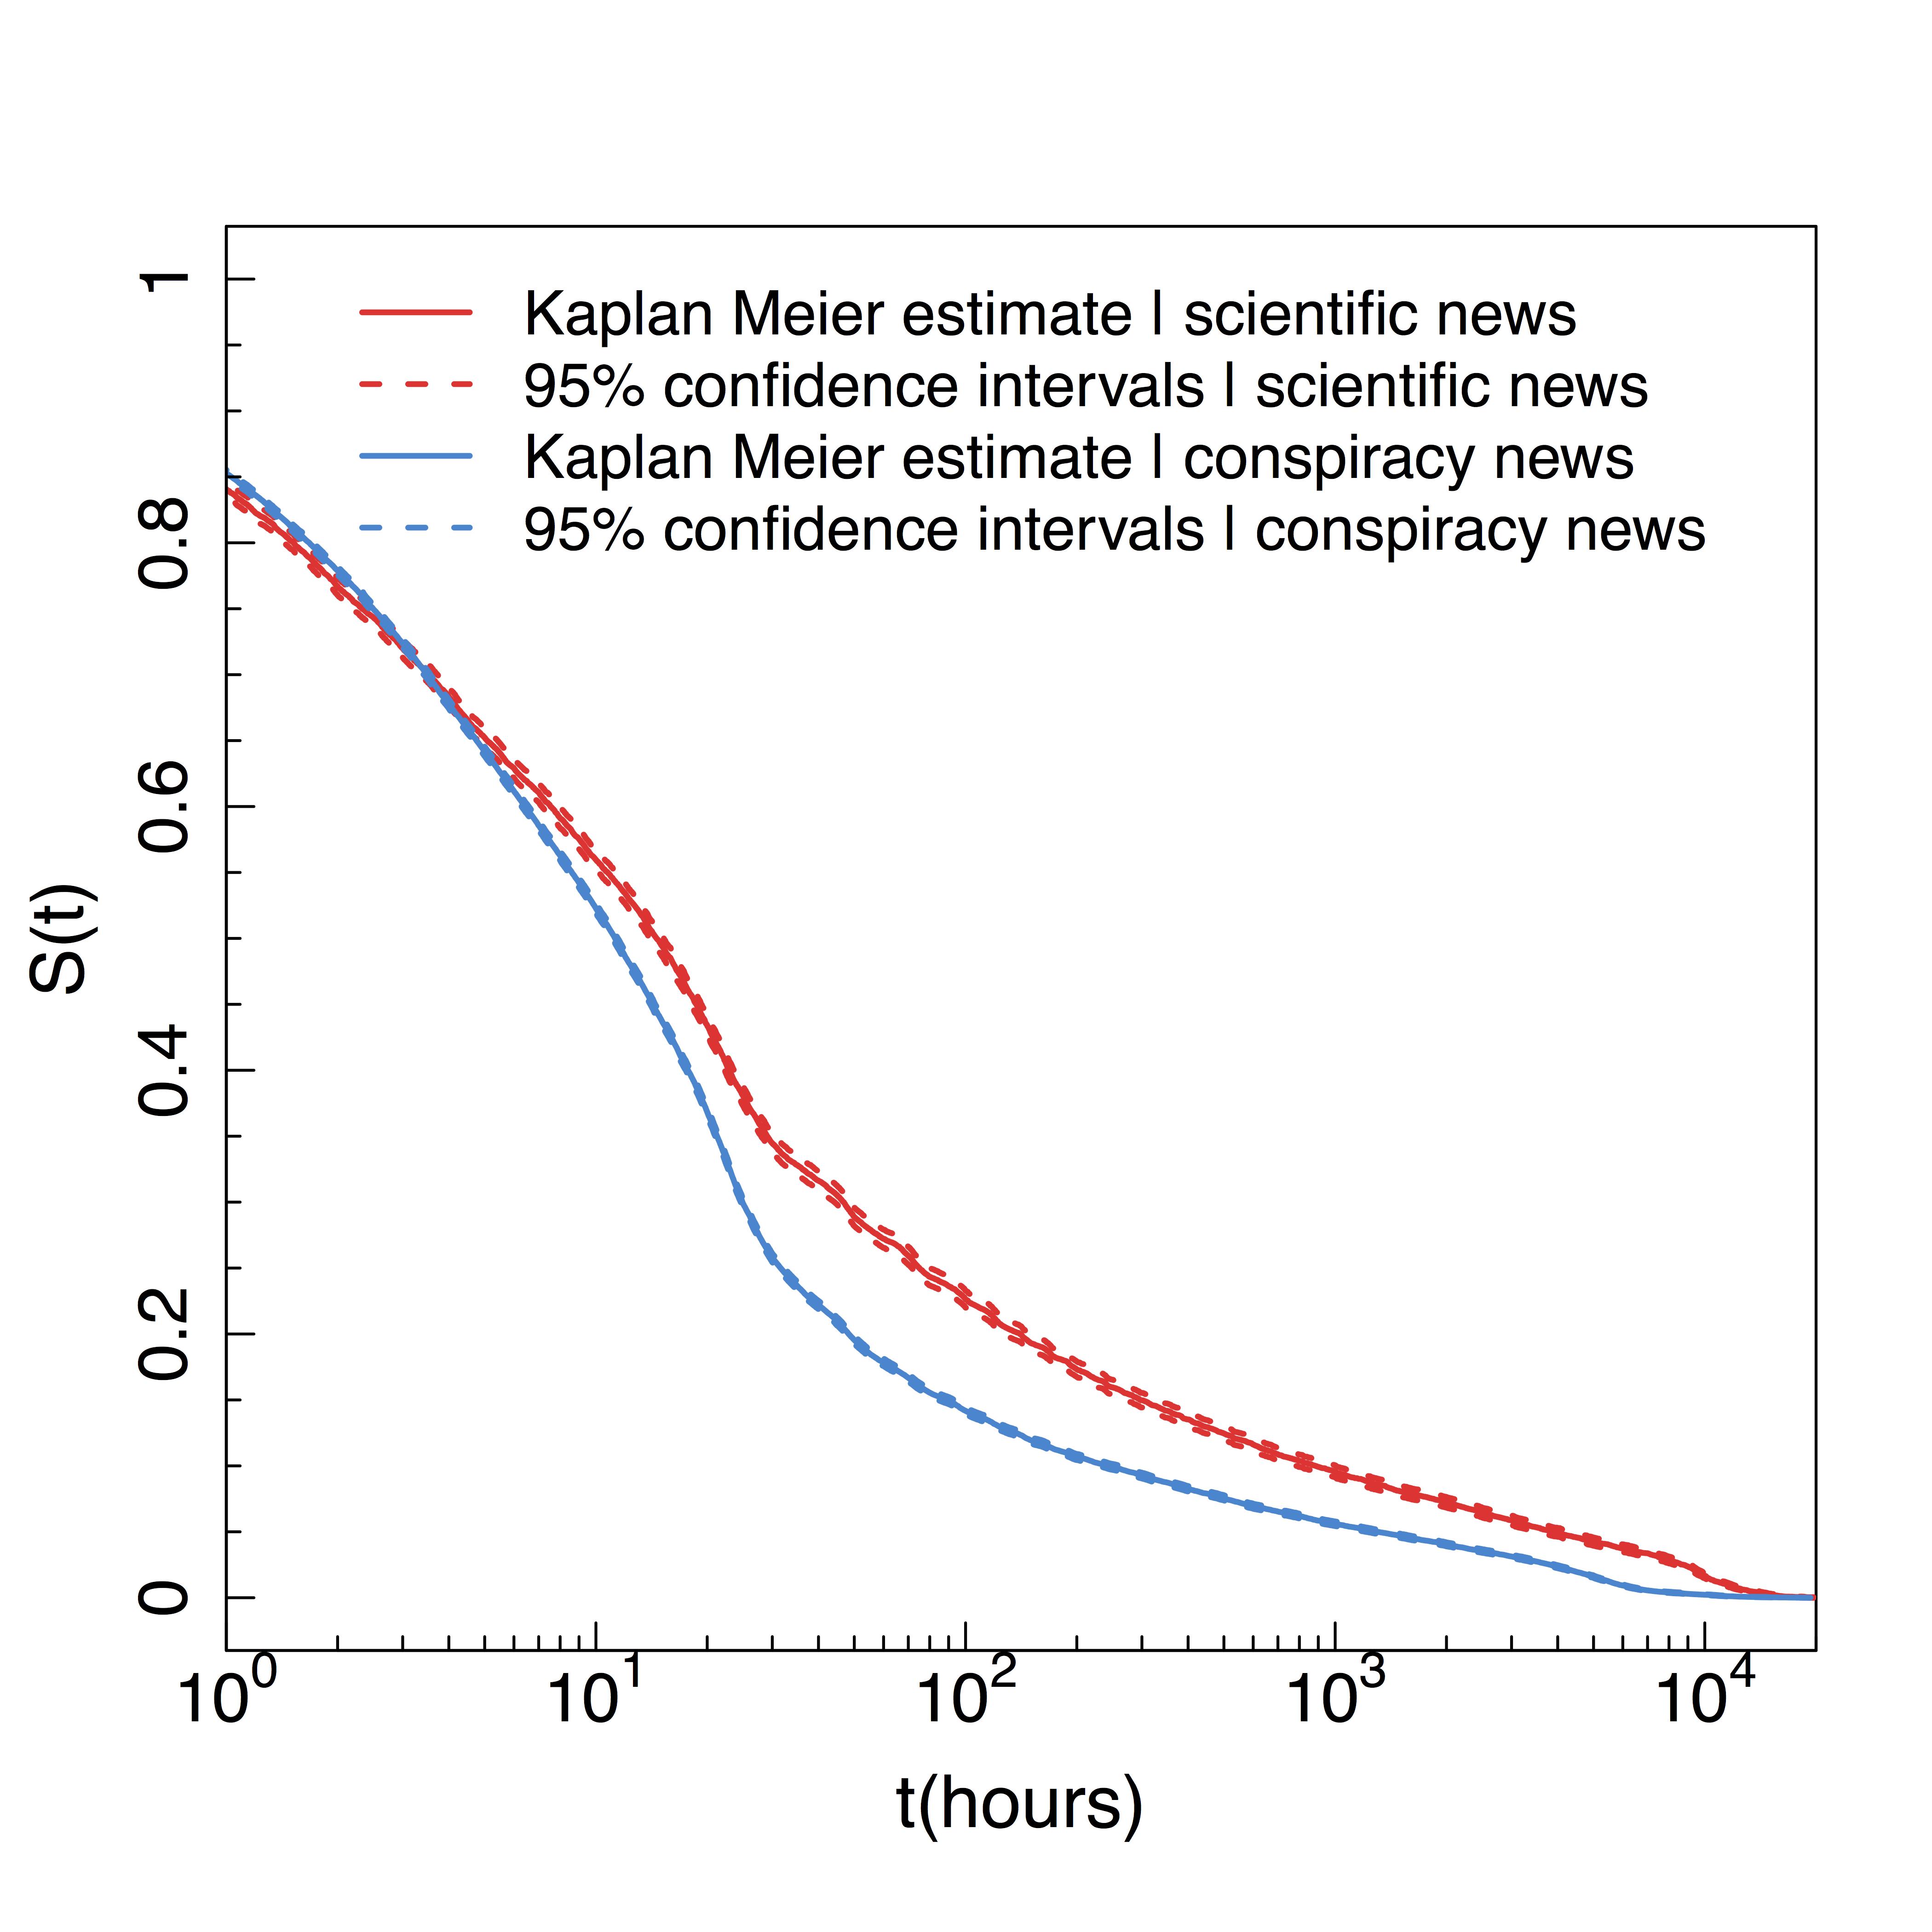
Despite the very different kind of content, the results indicate that consumption patterns (number of likes, comments, and shares), as well as persistence of users and posts over time, both categories have similar consumption patterns.
6 Contents and friends
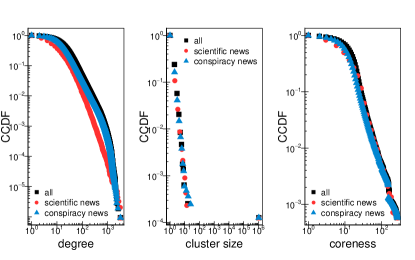
In this section, we analyze the topological features of the social networks by accounting for users’ information consumption patterns. As a first measure, in Figure 5, we show the complementary cumulative distribution function (CCDF) of the degree of each node, the size of the connected components, and the coreness of each node for the graphs , , and . All graphs present similar distributions.
Next we compare the network structure of the entire graph , and the subgraphs of the polarized users, and , when we restrict to different levels of engagement. In Figure 6 we show various topological metrics for subgraphs of the three aforementioned graphs. In the -axis we vary the engagement of nodes and consider the subgraphs of , , and induced by nodes with engagement . In the -axis we consider a variety of topological measures: size (number of nodes), density, clustering coefficient, number of connected components, size of the maximum connected component, and maximum coreness over all the nodes in the subgraph. The results show that the more we consider active users the more the connectivity patterns move towards a denser and clustered network.
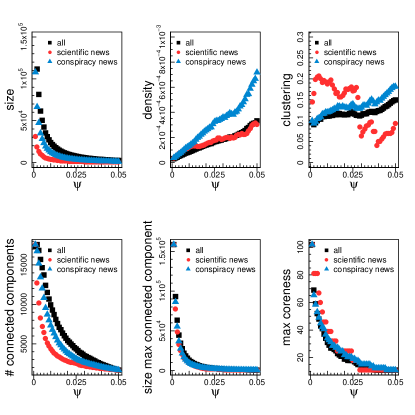
The liking activity is a good approximation to associate users with their preferred contents [35, 36, 34], so users’ liking activity across contents of the different categories may be intended as the preferential attitude towards the one or the other type of information. To see how consumers of different contents are distributed over the network, we measure how the polarization of the network changes along with the users’ engagement. In Figure 7, we show the average value of as a function of their : for each value of , we consider the subnetwork of induced by users with and we compute the average polarization among the users in the entire subnetwork, in the maximal -core, and in the maximal connected component.
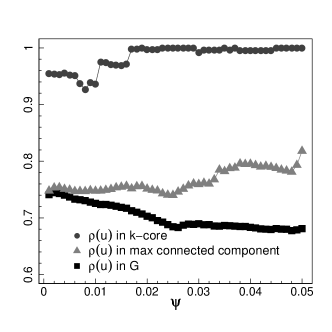
We can observe in Figure 7 that the lowest value of the polarization in the largest connected components is attained at . Given this observation, in Figure 8, we show the largest connected component of the subnetwork induced by the friendship network if we only consider nodes with , where the color of each node depends on (red nodes are science users and blue are conspiracy ones). We identify a main community of polarized users in conspiracy news.
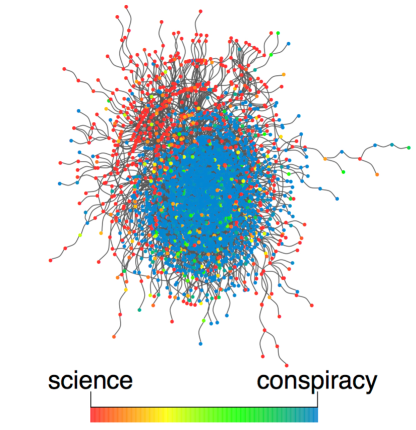
Figure 8 hints that there is a strong presence of homophily with respect to polarization, and we delve more into this issue. In Figure 9 we show the fraction of polarized friends as a function of the engagement degree . Specifically, in the left panel, we consider the set of each user with a given , we compute the fraction of ’s polarized neighbors in that are polarized towards science (i.e., they belong in ), and we show the average of these fractions for all of these users . In the right panel, we do the same, but considering the conspiracy users and their conspiracy friends.
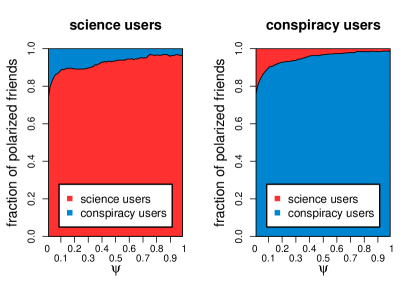
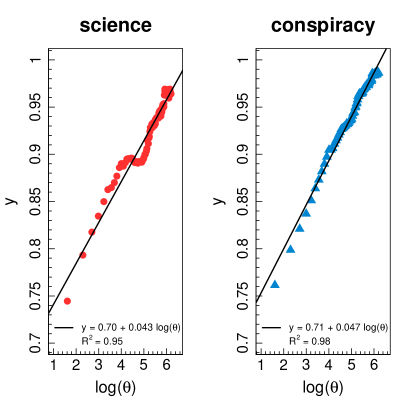
Figure 9 clearly indicates the presence of homophily in the friendship network with respect to news preference. This is an important phenomenon to understand viral processes, because the latter might diffuse among connected users having similar information consumption patterns; we study this question more in Section 7. To further confirm such point, we show that for a polarized user , the fraction of polarized friends in her category can be predicted by means of a linear regression model with intercept where the explanatory variable is a logarithmic transformation of the number of likes , that is, Coefficients are estimated using ordinary least squares and they are—with the corresponding standard errors inside the round brackets— and , with , for users polarized towards science, and and , with , for users polarized towards conspiracy. All the p-values are close to zero. In Figure 10, we show the fit of the model for users polarized in science and conspiracy.
Summarizing, we find very polarized communities around different contents. Such a polarization emerges in the friendship network where we identify homophily; indeed, the more a polarized user is active in her category the bigger the number of polarized friends she has in the same category. Thanks to such a characterization, we are able to identify areas of the social network where a given content is more likely to diffuse. This is the topic of the next section.
7 Virality and Polarization
In this section, we want to analyze the determinants behind viral phenomena related to false information. In particular, we focus on the role of structural features of the social network as well as on users’ consumption patterns.
7.1 Network Structure and Users’ Activity
For a better understanding of posts’ virality, we use the number of shares since they are a proxy of the number of people reached by a post. Hence, we pick two random samples of posts from each set and , and we compute structural as well as information-consumption metrics to be compared with the total number of shares. In particular, we concentrate on the degree and liking activity of each user who liked the posts in our samples. In figures 11 and 12 we show the number of shares versus, respectively, the average values of the degree and liking activity among the users who liked a given post from our samples. The results provide an outline of viral processes. They show that in viral posts (i.e., posts with high values of shares), very active users (in terms either of number of friends or liking activity) form a tiny fraction of the overall users. We have checked that similar results hold when accounting for commenting activity.
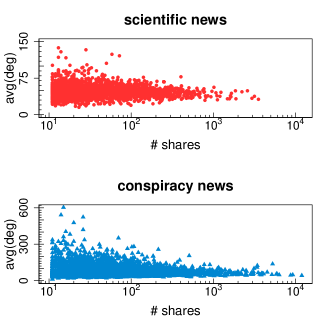
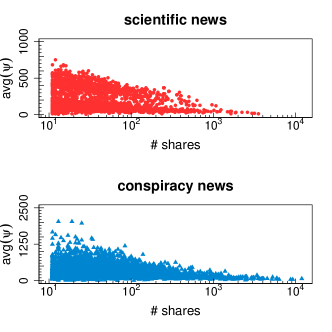
Since the distributions of both degree and liking activity are heavy tailed, large volumes of users that make a post viral are mainly composed of users with low degree and liking activity.
7.2 Viral Processes on False Information
Users’ preference towards information belonging to a particular kind of narrative might provide interesting insights with respect to the determinants of viral phenomena. Under the light of the findings in the previous section, we now focus on how false information can spread in Facebook. We use the set of troll posts described in Section 3 and we study the virality of each post with respect to the network structure and users’ liking activity. Notice that such a set of posts is disjoint from the one used to classify users as polarized towards science or conspiracy, thus we can obtain unbiased results regarding the effect of users’ polarization in the diffusion of false information. Figure 13 shows the same information of figures 11 and 12 but for troll posts. Again, in viral posts, very active users (in terms either of number of friends or liking activity) form a tiny fraction of the overall users.
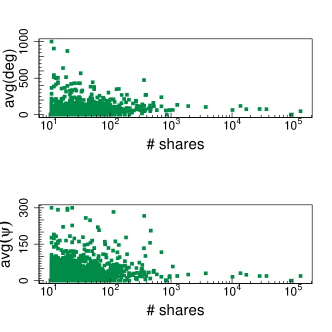
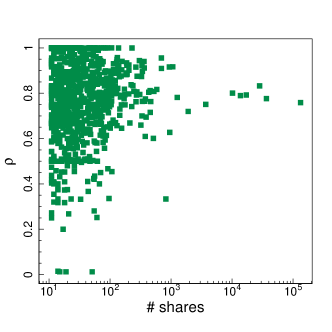
However, we found an interesting fact: in most of the viral posts users are highly polarized. In Figure 14, for each troll post, we show polarization of users who liked it against its number of shares. Whereas users’ both degree and liking activity become low as the number of shares increases, polarization is relevant for all levels of shares.
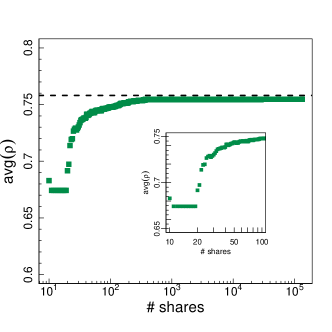
In Figure 15 we show the average value of the polarization for increasing levels of the number of shares. More precisely, for each level of virality , we compute the average polarization of all users who liked troll posts with number of shares at least . As we can see, the curve has an increasing trend that asymptotically stabilizes around . The plot indicates that for posts containing false claims with more than 100 shares, the average polarization of the users who liked it is high and remains constant with the increase (at different orders of magnitude) of the virality.
To better shape the role the polarization in viral phenomena around false information, we study how it changes by considering posts with increasing levels of virality. In Figure 16 we show the PDF of users’ average polarization for different levels of virality. We observe that for highly viral posts (with false information) the average polarization value of the users who like them peaks around .
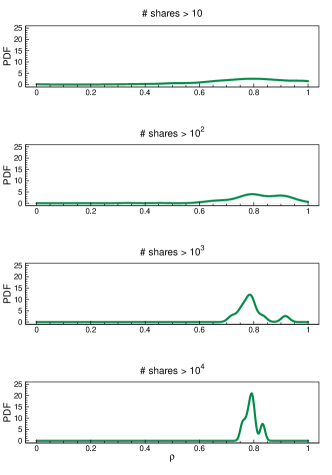
Observe that the pick increases with virality of posts. indication that high polarization is most of the times essential for a post becoming viral. The results indicate that a good indicator to detect viral phenomena around false information is the users’ polarization. The diffusion of false claims proliferates within (tightly clustered) users that are usually exposed to unsubstantiated rumors.
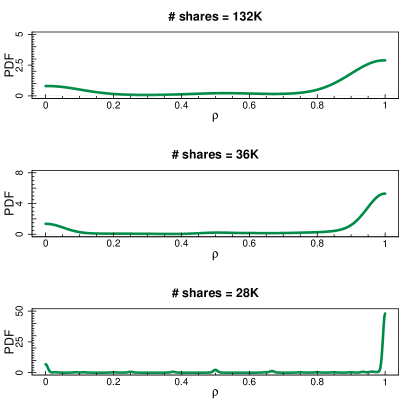
7.3 Case Study
Let us now obtain some more intuition by studying in more detail the most viral troll posts [45, 46, 47]. In Figure 17 we show the probability density function of the polarization of the users that liked each of the three troll posts. The most viral post with shares says that in the year of the post (2013), after years, the month of October has 5 Tuesdays, Wednesdays, and Thursdays, and that this is a very rare event so that Chinese people call it year of the glory shu tan tzu. The fact that October 2013 has 5 Tuesdays, Wednesdays, and Thursdays is true, however the rest is false: this happens around once every seven years and the phrase has no sense in Chinese. The second one is the popular case of Senator Cirenga mentioned in the introduction, which received more than shares. The third one has a more political taste by stating that the former Italian speaker of the house received a large sum of money after his resignation. This post was shared times. In Figure 17 we show the PDF of users’ polarization liking these three posts. We can see that in all three posts there is a significant proportion of conspiracy users, who have seen the post through a viral process (note that the total subscribers to the Facebook group pages are upper bounded by about only , and we expect a much smaller proportion to have seen the posts in their Facebook feeds). Interestingly, there is always a no-negligible number of science users who have also liked the posts, even though they are from four to ten times less.
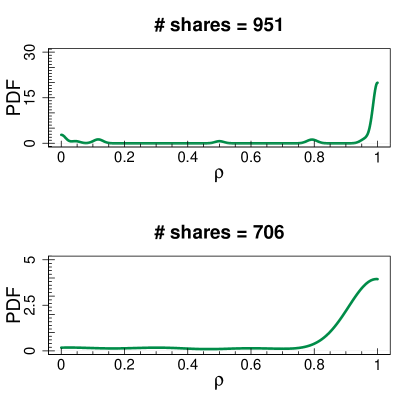
Actually, we can observe that the percentage of science users depends directly on the content of the post: the more towards conspiracy a post is, the less the ratio of science users. To provide a better outline of this phenomenon we also plot in Figure 18 the two most viral posts [48, 49] from the troll page that is more specific in teasing conspiracy stories (see Section 3). The first post mentions that a Chinese engineer discovered an eco-friendly (uranium-based) lamp that produces extremely bright light at an extremely low cost (order of pennies) while being able to several hundred years. The second one is a version of the chemtrail conspiracy theory, mentioning, among others, that one of the ingredients with which we are bing sprayed is sildenafil citrate—the active ingredient of Viagra. Note that in those ones the liking activity of science users is very close to zero.
8 Conclusions
Nowadays, understanding the determinants of viral phenomena occurring on socio-technical systems is a very interesting challenge. The free circulation of contents has changed the way people get informed, and the quality of information plays a fundamental role in collective debates. In this work, we addressed the relationships between the virality of false claims and the users information consumption patterns. To do this, we analyze a sample of Facebook Italian users consuming different (and opposite) types of information—science and conspiracy news. We found out that users engagement across different contents correlates with the number of friends having similar consumption patterns (homophily). Next, we studied the virality of posts of the two categories, finding that both present similar statistical signatures. Finally, we tested diffusion patterns on an external set of intentionally satirical false posts (troll posts) and we discovered that neither the presence of hubs (structural properties) nor the most active users (influencers) are prevalent in viral phenomena. The results of this work provide important insights towards the understanding of viral processes around false information on online social media. In particular, we provide a new metric—user polarization defined on the information consumption patterns—which along with users’ engagement and the number of friends helps in the discovery of where in the social network false claims are more likely to spread. In addition, we show that users’ aggregation around shared beliefs makes the frequent exposure to conspiracy stories (polarization) a determinant for the virality of false information.
9 Acknowledgments
Funding for this work was provided by EU FET project MULTIPLEX nr. 317532 and SIMPOL nr. 610704. The funders had no role in study design, data collection and analysis, decision to publish, or preparation of the manuscript. Special thanks for building the atlas of pages to Protesi di Protesi di Complotto, Che vuol dire reale, La menzogna diventa verita e passa alla storia, Simply Humans, Semplicemente me. Finally, we want to mention Salvatore Previti, Elio Gabalo, Titta, Morocho, and Sandro Forgione for interesting discussions.
References
- [1] G. Lotan, E. Graeff, M. Ananny, D. Gaffney, I. Pearce, and D. Boyd. The revolutions were tweeted: Information flows during the 2011 tunisian and egyptian revolutions. International Journal of Communications, 5:1375–1405, 2011.
- [2] K. Lewis, M. Gonzalez, and J. Kaufman. Social selection and peer influence in an online social network. Proceedings of the National Academy of Sciences, 109(1):68–72, January 2012.
- [3] J. Leskovec, D. Huttenlocher, and J. Kleinberg. Signed networks in social media. In Proceedings of the SIGCHI Conference on Human Factors in Computing Systems, CHI ’10, pages 1361–1370, New York, NY, USA, 2010. ACM.
- [4] J. Kleinberg. Analysis of large-scale social and information networks. Philosophical Transactions of the Royal Society A: Mathematical, Physical and Engineering Sciences, 371, 2013.
- [5] R. Kahn and D. Kellner. New media and internet activism: from the ‘battle of seattle’ to blogging. new media and society, 6(1):87–95, 2004.
- [6] P. N. Howard. The arab spring’s cascading effects. Miller-McCune, 2011.
- [7] S. Gonzalez-Bailon, J. Borge-Holthoefer, A. Rivero, and Y. Moreno. The dynamics of protest recruitment through an online network. Scientific Report, 2011.
- [8] R. Bond, J. Fariss, J. Jones, A. Kramer, C. Marlow, J. Settle, and J. Fowler. A 61-million-person experiment in social influence and political mobilization. Nature, 489(7415):295–298, 2012.
- [9] S. Buckingham Shum, K. Aberer, A. Schmidt, S. Bishop, P. Lukowicz, S. Anderson, Y. Charalabidis, J. Domingue, S. Freitas, I. Dunwell, B. Edmonds, F. Grey, M. Haklay, M. Jelasity, A. Karpištšenko, J. Kohlhammer, J. Lewis, J. Pitt, R. Sumner, and D. Helbing. Towards a global participatory platform. The European Physical Journal Special Topics, 214(1):109–152, 2012.
- [10] D. Centola. The spread of behavior in an online social network experiment. Science, 329(5996):1194–1197, 2010.
- [11] M. Paolucci, T. Eymann, W. Jager, J. Sabater-Mir, R. Conte, S. Marmo, S. Picascia, W. Quattrociocchi, T. Balke, S. Koenig, T. Broekhuizen, D. Trampe, M. Tuk, I. Brito, I. Pinyol, and D. Villatoro. Social Knowledge for e-Governance: Theory and Technology of Reputation. Roma: ISTC-CNR, 2009.
- [12] W. Quattrociocchi, R. Conte, and E. Lodi. Opinions manipulation: Media, power and gossip. Advances in Complex Systems, 14(4):567–586, 2011.
- [13] W. Quattrociocchi, M. Paolucci, and R. Conte. On the effects of informational cheating on social evaluations: image and reputation through gossip. International Journal of Knowledge and Learning, 5(5/6):457–471, 2009.
- [14] V. Bekkers, H. Beunders, A. Edwards, and R. Moody. New media, micromobilization, and political agenda setting: Crossover effects in political mobilization and media usage. The Information Society, 27(4):209–219, 2011.
- [15] W. Quattrociocchi, G. Caldarelli, and A. Scala. Opinion dynamics on interacting networks: media competition and social influence. Scientific Reports, 4, 2014.
- [16] L. Howell. Digital wildfires in a hyperconnected world. In WEF Report 2013. World Economic Forum, 2013.
- [17] S. Goel, D. J. Watts, and D. G. Goldstein. The structure of online diffusion networks. In Proceedings of the 13th ACM Conference on Electronic Commerce, EC ’12, pages 623–638, New York, NY, USA, 2012. ACM.
- [18] P. A. Dow, L.. Adamic, and A. Friggeri. The anatomy of large facebook cascades. In Emre Kiciman, Nicole B. Ellison, Bernie Hogan, Paul Resnick, and Ian Soboroff, editors, ICWSM. The AAAI Press, 2013.
- [19] R. Kumar, M. Mahdian, and M. McGlohon. Dynamics of conversations. In Proceedings of the 16th ACM SIGKDD International Conference on Knowledge Discovery and Data Mining, KDD ’10, pages 553–562, New York, NY, USA, 2010. ACM.
- [20] Z. Ma, A. Sun, and G. Cong. On predicting the popularity of newly emerging hashtags in twitter. JASIST, 64(7):1399–1410, 2013.
- [21] Study explains why your stupid facebook friends are so gullible, March 2014.
- [22] Facebook, trolls, and italian politics, March 2014.
- [23] Giulio Ambrosetti. I forconi: “il senato ha approvato una legge per i parlamentari in crisi”. chi non verrà rieletto, oltre alla buonuscita, si beccherà altri soldi. sarà vero? Website, 8 2013. last checked: 19.01.2014.
- [24] M.J. Salganik, P.S. Dodds, and D.J. Watts. Experimental Study of Inequality and Unpredictability in an Artificial Cultural Market. Science, 311(5762):854–856, 2006.
- [25] B Franks, A Bangerter, and MW Bauer. Conspiracy theories as quasi-religious mentality: an integrated account from cognitive science, social representations theory, and frame theory. Frontiers in psychology, 4:424, 2013.
- [26] C. R. Sunstein and A. Vermeule. Conspiracy theories: Causes and cures*. Journal of Political Philosophy, 17(2):202–227, 2009.
- [27] K. McKelvey and F. Menczer. Truthy: Enabling the study of online social networks. In Proceedings of CSCW ’13, 2013.
- [28] Ebola lessons: How social media gets infected, March 2014.
- [29] The ebola conspiracy theories, March 2014.
- [30] The inevitable rise of ebola conspiracy theories, March 2014.
- [31] M. L. Meade and H. L. Roediger. Explorations in the social contagion of memory. Memory and Cognition, 30(7):995–1009, 2002.
- [32] C. Mann and F. Stewart. Internet Communication and Qualitative Research: A Handbook for Researching Online (New Technologies for Social Research series). Sage Publications Ltd, September 2000.
- [33] R. K. Garrett and B. E. Weeks. The promise and peril of real-time corrections to political misperceptions. In Proceedings of the 2013 conference on Computer supported cooperative work, Proceedings of CSCW ’13, pages 1047–1058. ACM, 2013.
- [34] A. Bessi, G. Caldarelli, M. Del Vicario, A. Scala, and W. Quattrociocchi. Social determinants of content selection in the age of (mis)information. Proceedings of SOCINFO 2014, abs/1409.2651, 2014.
- [35] D. Mocanu, L. Rossi, Q. Zhang, M. Karsai, and W. Quattrociocchi. Collective attention in the age of (mis)information. Computers in Human Behavior, abs/1403.3344, submitted.
- [36] A. Bessi, M. Coletto, G.A. Davidescu, A. Scala, G. Caldarelli, and W. Quattrociocchi. Science vs conspiracy: collective narratives in the age of (mis)information. Plos ONE, submitted.
- [37] J. Ugander, Lars B., Cameron M., and J. Kleinberg. Structural diversity in social contagion. Proceedings of the National Academy of Sciences, 2012.
- [38] D. Centola and M. Macy. Complex contagion and the weakness of long ties. American Journal of Sociology, 113:702–734, 2007.
- [39] S. Aral and D. Walker. Identifying influential and susceptible members of social networks. Science, 337, 2012.
- [40] S. Aral, L. Muchnik, and A. Sundararajan. Distinguishing influence-based contagion from homophily-driven diffusion in dynamic networks. Pnas, 106, 2009.
- [41] E. Bakshy, I. Rosenn, C. Marlow, and L. Adamic. The role of social networks in information diffusion. WWW’12, 2012.
- [42] D. Centola. Homophily, cultural drift, and the co-evolution of cultural groups. Journal of Conflict Resolution, 51:905–929, 2007.
- [43] J. Cheng, L. Adamic, P. Dow, J. Kleinberg, and J. Leskovec. Can cascades be predicted? WWW’14, 2014.
- [44] E. L. Kaplan and Paul Meier. Nonparametric estimation from incomplete observations. Journal of the American Statistical Association, 53(282):457–481, 1958.
- [45] Semplicemente me, November 2014. https://www.facebook.com/286003974834081/photos/a.286013618166450.51339.286003974834081/403452636422547.
- [46] Semplicemente me, November 2014. https://www.facebook.com/286003974834081/photos/a.307604209340724.56105.286003974834081/335640103203801.
- [47] Semplicemente me, November 2014. https://www.facebook.com/286003974834081/photos/a.307604209340724.56105.286003974834081/306244606143351.
- [48] Simply humans, November 2014. https://www.facebook.com/photo.php?fbid=494359530660272.
- [49] Simply humans, November 2014. https://www.facebook.com/HumanlyHuman/photos/a.468232656606293.1073741826.466607330102159/532577473505144.