Localization of Gamma-Ray Bursts using the Fermi Gamma-Ray Burst Monitor
Abstract
The Fermi Gamma-ray Burst Monitor (GBM) has detected over 1400 Gamma-Ray Bursts (GRBs) since it began science operations in July, 2008. We use a subset of over 300 GRBs localized by instruments such as Swift, the Fermi Large Area Telescope, INTEGRAL, and MAXI, or through triangulations from the InterPlanetary Network (IPN), to analyze the accuracy of GBM GRB localizations. We find that the reported statistical uncertainties on GBM localizations, which can be as small as , underestimate the distance of the GBM positions to the true GRB locations and we attribute this to systematic uncertainties. The distribution of systematic uncertainties is well represented (68% confidence level) by a Gaussian with a non-Gaussian tail that contains about 10% of GBM-detected GRBs and extends to approximately . A more complex model suggests that there is a dependence of the systematic uncertainty on the position of the GRB in spacecraft coordinates, with GRBs in the quadrants on the Y-axis better localized than those on the X-axis.
1 Introduction
In four years of operation, the Fermi Gamma-ray Space Telescope has opened a new window to the world of Gamma-Ray Burst (GRB) spectroscopy. Observations by the Gamma-Ray Burst Monitor (GBM, Meegan et al. (2009)) between 8 keV and 40 MeV and the Large Area Telescope (LAT, Atwood et al. (2009)) from 20 MeV to hundreds of GeV have provided a high-energy view over an unprecedentedly broad energy baseline. Follow-up observations of LAT-detected GRBs have revealed the redshift of about a dozen GRBs detected above 100 MeV (Ackermann et al. (2013) and references therein; Ramírez et al. (2013); Levan et al. (2013); Leloudas et al. (2013); de Ugarte Postigo et al. (2013)). Determining the redshift of GRBs enables the study of the energetics and rest-frame properties of these events. Owing to the localization limitations of the GBM experiment, follow-up observations of GRBs localized at trigger time only by GBM were rare until we disseminated the results of the work presented here, in which uncertainties in GRB localizations are characterized. GRB 090902B (Abdo et al., 2009) was observed by ROTSE (Pandey et al., 2010) an hour after the trigger, with ROTSE tiling the GBM error circle hours before the burst was better localized using LAT and Swift data. A source was subsequently found in the ROTSE data at the position of the burst, providing the earliest measurements of the GRB afterglow. GRB 130702A was observed by the intermediate Palomar Transient Factory (iPTF), with the telescope tiling 72 square degrees in 10 separate pointings, and uncovering the afterglow of the GRB 4.2 hours after the GBM trigger (Singer et al., 2013). This was the first discovery of afterglow emission from observations that used only the GBM localization and did not require additional, more accurate, positions from the LAT or from Swift to find the source in the large observed sky region. Since then, regular observations by iPTF of GRBs localized by GBM revealed the afterglows for eight more GRBs in 35 attempts (L. Singer et al., in preparation). In general, however, the small fields-of-view of the most sensitive follow-up telescopes have deterred regular observations of the degrees-scale uncertainty regions resulting from GBM localizations. A further discouraging aspect of GBM localizations is that the total error is often larger than the reported statistical uncertainty. Using a Bayesian method similar to that reported here, Briggs et al. (2009) analyzed 36 GBM GRB localizations and found the 68% confidence level systematic uncertainty to be . Hurley et al. (2013) use a sample of 149 GRBs detected by GBM and by other instruments in the InterPlanetary Network (IPN) to infer a 90% confidence level systematic uncertainty of . We report here a study of systematic uncertainties using over 300 reference locations provided by other instruments and by the IPN. The technique we use is based on the work of Graziani & Lamb (1996) and Briggs et al. (1999), who developed a Bayesian approach to characterize systematic uncertainties for the GRBs detected by the Burst And Transient Source Experiment (BATSE) on the Compton Gamma-Ray Observatory.
GBM detects about 240 GRBs per year (Paciesas et al., 2012; von Kienlin et al., 2014), providing real-time locations for the follow-up community. Approximately 17% of Fermi GBM-detected GRBs are short in duration (von Kienlin et al., 2014). Unlike the short GRB population detected by Swift, which may contain weak collapsar events (Bromberg et al., 2013), it is likely that most GBM-detected short GRBs (SGRBs) are associated with the merger of compact binary systems. There are therefore 40 or so merger GRBs per year detected by GBM that could potentially be observed at other wavelengths. Mergers of compact binary systems are likely sources of gravitational waves (GW). No associations were found between 154 GRBs detected in 2009-2010 by various spacecraft, including GBM, and potential signals in the LIGO and Virgo GW experiments (Abadie et al., 2012). This was not unexpected given the detection horizon of about 20 Mpc for these experiments. Advanced configurations of both experiments will be deployed over the next few years, with horizons of 400 [1000] Mpc for NS-NS [NS-BH] mergers (Abadie et al., 2010). It is realistic to expect several joint detections of SGRBs by GBM and GW candidates by A-LIGO/Virgo per year (Connaughton et al., 2013). For the first years of A-LIGO/Virgo operation, localization uncertainties for GW candidates are estimated to be 1000 square degrees or more (Aasi et al., 2013), larger than the GBM uncertainty regions, consisting of annuli segments that may encompass non-contiguous sky regions. It is especially important to enable the optical community to observe SGRBs while the afterglow is still bright enough to be detected above the background in a large error box. For GBM-detected SGRBs, this may imply covering only a small part of the error box.
In Section 2 we describe the detection and localization of GRBs by GBM and in Section 3 their dissemination to the public over the GRB Coordinates Network. The sample of reference locations from detections by other instruments or by the InterPlanetary Network is introduced in Section 4, where reference point locations are compared to the GBM localizations and their reported statistical uncertainties. In section 5, we describe our method to assess the effect of systematic uncertainties on GRB localization. We report results for the models we tested. In section 6 we summarize our results and describe new data products that use these results to facilitate follow-up observations of GRBs localized by GBM.
2 Localization of GRBs by GBM
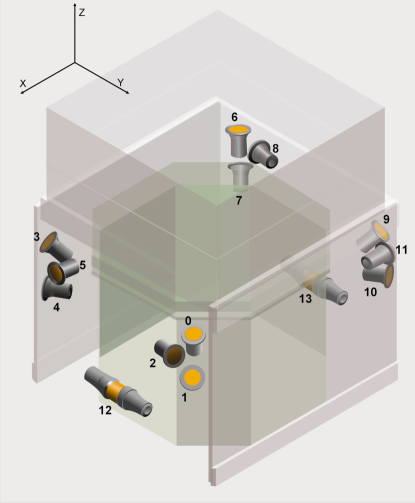
The GBM views the entire unocculted sky, over 7 steradians, using 12 sodium iodide (NaI) detectors, 1.27 cm thick and 12.7 cm in diameter, covering an energy range from 8 keV to 1 MeV, and two bismuth germanate (BGO) scintillators, 12.7 cm in diameter and thickness, placed on opposite sides of the spacecraft, with energy coverage from 200 keV to 40 MeV (Meegan et al., 2009). In a coordinate system centered on the spacecraft, the Z-axis is oriented along the boresight of the LAT, the X-axis joins the two BGO detectors, and the Y-axis joins the LAT radiators, as shown in Figure 1. The placement of the NaI detectors, which all have different orientations, in four clusters of three detectors gives maximum coverage along the positive Z-axis. This means GRBs in the LAT field-of-view are seen by more GBM detectors than those outside. If Fermi were pointed at the local zenith, the Earth would occupy the region in spacecraft coordinates viewed by the fewest detectors, along the negative Z-axis. In nominal sky-survey mode, Fermi views the whole sky every 3 hours (2 spacecraft orbits) by tilting alternately north and south of the zenith each orbit to obtain uniform sky survey coverage when the exposure is averaged over just a few orbits. The angle of the tilt, called the rocking angle, has changed from at the start of the Fermi mission to in October 2009, the change being necessary to place Fermi in a rocking profile that keeps the spacecraft battery cool.
The energy information from the GBM detectors is binned in 128 channels constructed using the 4096 channels in the Data Processing Unit that result from the digitzation of the analog output from the detector front-end electronics. Channel-to-energy conversion uses pre-launch exposures to radioactive sources between 14 keV and 4.4 MeV and a spline fit between and beyond the energies of the known sources covers the whole energy range. Details of the energy calibration are given in Bissaldi et al. (2009). The localization of sources is done with an 8-channel rebinning of the full-resolution 128-channel data into a quicklook data type that is downloaded in real-time when a trigger occurs.
Source localization uses the relative rates recorded in the 12 NaI detectors to estimate the most likely arrival direction given the angular and spectral response of the detectors. The detector response model was constructed from simulations incorporating the Fermi spacecraft mass model into GEANT4 (Kippen et al., 2007). Incident photons with energies between 5 keV and 50 MeV were injected from 272 directions in the spacecraft coordinate system to evaluate the geometry-dependent detector response.
A minimization process finds the direction on the sky from which the expected count rates from our detector response model most closely match the observed detector count rates in all 12 NaI detectors. The observed counts include a background component that is subtracted before modeling the source. The observed source counts are compared to expectation from evenly distributed points on a 1∘ resolution grid in spacecraft coordinates that linearly interpolates among the three closest of the native 272 sky directions giving 41168 grid points. The source rates contain three elements: direct flux from the source, flux scattered in the spacecraft, and flux scattered from the atmosphere. Contributions from each of these components depend on the observing geometry and on the spectrum of gamma rays from the source. We construct our instrument response matrices for a particular GRB by adding two model terms, the direct response, which depends only on the source-spacecraft geometry, and the atmospheric response, which depends on the source-spacecraft-Earth geometry. The direct response is calculated by interpolating among the three closest of 272 sky points in the native database compiled from the GEANT simulations. Our atmospheric response calculation is a simplification of the true geometry in which the Earth-spacecraft geometry has many solutions. We use the atmospheric response database established for BATSE (Pendleton et al., 1999). For each of the 41168 grid points we calculate the rates normal to each detector for the Earth-spacecraft geometry at the time of a trigger.
We construct three tables with the model count rates between 50 and 300 keV for each detector at each point on this grid, using three source spectra representing spectrally soft, medium, and hard GRBs. The source spectra are modeled using the Band function parametrization (Band et al., 1993), two power-law components, and , that are smoothly joined, and a peak in the power per decade of energy, :
The Band function parameters for these three spectra are , , = (-1.9, -3.7, 70 keV), (-1, -2.3, 230 keV), and (0, -1.5, 1 MeV). Thus, the direct response is fixed and depends only on the source position in spacecraft coordinates. To this we add an atmospheric component that is calculated during the execution of the localization code and that depends on the position of the Earth in spacecraft coordinates. A minimization of each of the three tables (soft, medium, hard) relative to the observed rates produces the most likely arrival direction in spacecraft coordinates for each of the three model spectra, and the lowest among the three minima is assumed to be from the spectrum that most closely resembles the burst. The position from the selected table is translated to equatorial coordinates using the spacecraft attitude at trigger time. The reported 68% statistical uncertainty is the average distance to the grid points that lie at = 2.3, assuming a circular uncertainty region. A lower limit to the reported statistical uncertainty of is imposed to match the grid resolution, though in practice the contours can be very steep within the grid points. A discussion of the distributions and the selection of the best model based on is given in Appendix A.
3 GBM Localization types
It is desirable to generate GRB localizations as soon as possible after the trigger. An automated process requiring no human intervention produces initial localizations from the on-board Flight Software algorithms (FSW locations) and on the ground (Ground-Auto locations), both within 10-30 s of the GRB trigger. Refined ground locations use more data and human judgment (Human in the Loop, or HitL locations) and are distributed on the order of an hour later.
When a GBM trigger occurs on-board Fermi, the GBM flight software (FSW) produces trigger data types that are downlinked to the ground upon summoning the Tracking and Data Relay Satellite System (TDRSS) link, a 5 second process. In addition to activating a TDRSS link, the GBM FSW communicates with the LAT via the spacecraft bus, informing the LAT FSW that a trigger has occurred, its nature (GRB, solar flare etc.), and sends a localization produced by the FSW. Because of memory limitations on-board, the FSW localization uses a coarser sky grid than previously described (5∘) and only one spectral model table, the Band function medium spectrum defined above, to which is added a pre-computed atmospheric scattering component that assumes the Earth is at the spacecraft nadir rather than calculating the atmospheric scattering component at trigger time. The first localization is produced by the FSW using the counts recorded in the most significant data accumulation on 17 time-scales ranging from 16 ms to 4.096 s, using data in the time interval leading to the trigger and an additional 1.5 s of data accumulated following the trigger time, to find a minimum in the on-board model rates table. The LAT uses this location as a seed to allow a less stringent on-board trigger level than its usual all-sky on-board science algorithm. The FSW produces further localizations if later data accumulations on time-scales from 16 ms to 4.096 s are more significant relative to the background level than the initial accumulation at 1.5 s post-trigger, with these later localizations communicated both to the LAT and to the ground.
In addition to the localizations produced by the FSW, TDRSS is also used to transmit the most significant count rates above background on the 16 ms to 4.096 s accumulation intervals, called MAXRATES, with MAXRATES transmission occurring only if the rates are more significant relative to the background level than previous MAXRATES calculations on any time-scale. Finally, a background count-rate record is transmitted that contains the average count rates in each detector over a 16 s period prior to the trigger time and separated from the trigger window by 3 s. After reception on the ground, MAXRATES and background packets, which also contain spacecraft position and attitude information, are ingested into the Burst Alert Processor (BAP) at NASA GSFC (or its backup at the GBM Instrument Operations Center in Hunstville). The FSW-determined background rates are subtracted from the MAXRATES to give source rates that are compared to the models. A Ground-Auto localization is generated using the full-resolution model rates tables including an atmospheric response component that uses the true Earth position rather than assuming a zenith-pointed Fermi spacecraft. Both FSW and Ground-Auto localizations are communicated as notices to the GRB Coordinates Network (GCN) if the statistical uncertainty is lower than previous FSW or Ground-Auto notices.
Over the next ten minutes, the FSW transmits via TDRSS a count rate time history covering from 200 s prior to 450 s following the trigger time, and the BAP alerts the GBM Burst Advocate (BA) to the presence of a trigger so that a HitL location can be generated when the real-time data set is complete. Both the FSW and the Ground-Auto locations use single accumulations in intervals from 16 ms to 4.096 s and can thus be considered peak-flux localizations. For the HitL localizations, the BA can select a source interval to produce a fluence localization that should in many cases yield a localization with a smaller statistical uncertainty. The BA selects time intervals before and after the burst emission to fit with a polynomial of order up to 4 as a background model that is subtracted from the observed counts in the source interval prior to the minimization.
The three types of localizations are distributed without delay via GCN notices using email and socket connections. FSW notices are sent out for all triggers and include a trigger classification (see Meegan et al. (2009) for a discussion of the FSW trigger classification procedure). Ground-Auto notices are distributed only if the FSW classified the trigger as a GRB at the time the MAXRATES packet was produced and the Ground-Auto localization passed an automated quality test (i.e., the localization appears consistent with a distant point source based on the relative rates in the detectors). HitL positions are sent as Final Position notices only if the BA classifies the event as a GRB and the GRB has not been localized more precisely by another instrument at the time of the HitL processing. Table 1 summarizes the types of locations, their reported statistical uncertainties, the typical latencies until the first GCN notice is issued, and the number of notices of each type issued for a trigger classified by the FSW as a GRB.
| Notice Type | Latency | Type | Error | Number | ||
|---|---|---|---|---|---|---|
| Minimum | Typical | Minimum | Typical | |||
| On-board (FSW) | 4 s1 | 15-30 s | Peak Flux | 3 ∘ | 8-15 ∘ | 1-3 |
| Ground-Auto (GA) | 12 s | |||||
| GA 2008-2010 | 30-60 s | Peak Flux | 1 ∘ | 5 ∘ | 1-5 | |
| GA 2011-2012 | 60-150 s | Peak Flux | 1 ∘ | 5 ∘ | 1-5 | |
| GA current | 30-40 s | Peak Flux | 1 ∘ | 5 ∘ | 1-3 | |
| Human-processed (HitL) | 19 min | 30-60 min | Fluence | 1 ∘ | 3 ∘ | 0-1 |
Latencies for the FSW notices have been stable since launch. An update to the ground localization software in 2011 resulted in longer latencies for the Ground-Auto notices owing to limitations of the BAP hardware and the processing in parallel of multiple MAXRATES packages. An upgrade of the BAP hardware occurred in 2012 and the BAP processing software was also modified to reduce latencies and send notices only if the reported localization uncertainty is smaller than previous notices for that trigger. These changes have resulted in fewer, but more useful, Ground-Auto notices that are distributed more quickly. In 2011, the BAs began distributing the HitL position as a GBM notice, with latencies depending on data availability and BA response time.
4 Comparison of GBM localizations with known GRB locations
Between July 2008 and May 2013, GBM triggered on 203 GRBs that were well-localized by other instruments or by the IPN, with location uncertainties (68 % confidence level) smaller than . These 203 reference locations are listed in Appendix B, Table 9 . The ground localization software has been changed several times during the mission. The current version of the code is 4.14g, for both the HitL and the Ground-Auto localizations, and this version is used for comparing the GBM locations with the 203 reference locations, so that the positions are recalculated using the current version rather than using the GRB positions distributed via GCN notices and circulars. It should also be noted that the HitL localizations used in this analysis were redone to ensure the background model and source selection were uninfluenced by the known reference positions. On-board localization software has not changed since 2008 October 1 and the FSW locations are assessed using the 192 reference locations from GRBs that occurred after this date.
The main purpose of the FSW locations is to alert the LAT to the occurrence of a GRB. This allows the LAT FSW to adjust its on-board algorithm parameters using the temporal and spatial information from GBM. If the GRB is bright or spectrally hard enough, as determined by the GBM FSW, the FSW location is also used to place the GRB near the center of the LAT Field-of-View (FoV) following an Automatic Repoint Recommendation (ARR) issued by the GBM FSW to the spacecraft. Because the FoV of the LAT is , the requirements on the FSW localization are loose, 20∘ uncertainty (68% CL) with a goal of 15∘. Figure 2 shows the fraction of FSW localizations within a given offset of the true location for the 192 reference locations. The top panel shows the quality of the initial location, calculated at 1.5 s post-trigger. This can be compared in the bottom panel with the final FSW locations sent out as a GCN notice, a set that includes the initial FSW localizations of GRBs for which only one FSW location was issued. The vertical lines show that 68% of the true positions are contained in a 14.9∘ [11.6∘] region for the initial [final] FSW locations, with 90% contained within 31.9∘ [25.1∘]. This is sufficiently accurate for the LAT and the ARR process, and perhaps useful for the follow-up observer on the ground as an alert to begin slewing the telescope a few seconds before the more accurate Ground-Auto locations become available.

Figure 3 shows the true offset from the known source position as a function of the reported statistical uncertainty for both HitL (top) and Ground-Auto (bottom) localizations. Where more than one possible Ground-Auto position exists, we use the last one produced by the BAP that would have been sent out as a notice. Figure 4 shows the fraction of GBM localizations within a given offset of the true location for HitL (top) and Ground-Auto locations. The vertical lines show that 68% of the true positions are contained in a 5.3∘ [7.6∘] region around the HitL [Ground-Auto] locations, with 90% contained within 10.1∘ [17.2∘]. Although the Ground-Auto positions appear significantly poorer, it can be seen from Figure 5 that when the offset to the true position is expressed as a multiple of the statistical uncertainty (68% CL), the quality is similar. This reflects the fact that the Ground-Auto locations are peak flux calculations that have fewer source counts than the fluence HitL localizations, resulting in larger statistical uncertainties. The horizontal solid and dashed lines show the fraction of localizations within 1 and 2. If the statistical uncertainties reflected the total error, the 1 circles should contain 68% of the true source positions but they actually contain 39% [38%] of the true source positions for the HitL and Ground-Auto locations, respectively, increasing to 70% [74%] for the regions. This indicates that there is, in addition to the statistical uncertainty, a systematic component to the localization error.


Figure 6 shows the fraction of precisely localized GRBs (statistical uncertainty equal to 1.0∘) lying within a given distance of a known position for both HitL and Ground-Auto localizations.
These distributions can serve as a guide to the follow-up observer wishing to concentrate on the brightest, best-localized events without worrying too much about covering the whole uncertainty region, but wanting to know how often they will succeed as a function of how much sky they are willing to tile. A more effective search strategy requires knowledge of the systematic uncertainty in order to probe the larger sky regions that contain most of the probability of the GRB arrival direction. This is of particular interest for archival searches by the multi-messenger community with instruments that do not require pointing a telescope to the source. The sensitivity of such searches, and of any upper limits obtained in the case of a null result, depends on defining a source region narrow enough to reduce the background but that is still wide enough to capture the source. In view of the connection between GRBs and core-collapse supernovae and the long time interval that can separate the events, it is also essential to define GRB directions in order to connect or reject GRB associations with observed SNe events, as was done, for example, by Soderberg et al. (2010) in the case of SN 2009bb. This will become increasingly important in the era of the Large Synoptic Survey Telescope (LSST) and the expected discovery of many more optical transients in search of counterparts at other wavelengths.
In the following section, we characterize the systematic uncertainty associated with GBM localizations in order to be able to calculate the probability that any region contains the actual source location. We concentrate on the ground localizations that are most useful to devising a follow-up strategy although, for completeness, we will briefly characterize the systematic uncertainty associated with the FSW localizations. The reference sample includes the point source locations discussed above and annuli obtained through triangulation by the IPN. For analysis convenience we use only reference locations that may be considered to be points and annuli that may be considered to be lines, with respect to the GBM localization. We include IPN annuli with half-widths narrower than 0.8∘. For some GRBs the IPN has multiple arcs that intersect to provide an accurate location, with an intersecting region that has a corner-to-corner dimension of less than ; in these cases we use the intersection closest to the GBM location as a point location. When the IPN has multiple arcs that do not provide an accurate location we use only the narrowest arc in order not to overweight that GRB in the sample. In addition to the 203 point locations described above, 134 GRBs from the IPN - GBM catalog (Hurley et al., 2013) between July 2008 and July 2010 provided 244 annuli, shown in Appendix B, Table 10. After removing annuli that were wider than and collapsing intersecting annuli to point sources, this IPN catalog supplied 100 annuli and 9 additional point sources (from 18 intersecting annuli). The acceptance limit for the IPN annuli ensures that only annuli with dimensions smaller than the smallest GBM localization uncertainty are used in the reference sample. Wider annuli would not influence the model fits because their contribution to the constraints on the model parameters would be weighted by the large uncertainty in the dimension (width) that is used to evaluate the best-fit parameters and the goodness-of-fit of the model, but the reference sample would appear larger than the true useful reference sample. These criteria then provide a reference sample with point locations and arcs.
In Figure 7, we compare the properties of our reference sample to the population of GRBs detected over the same period of time. Although the GRBs in our reference sample are, on average, brighter than other GRBs detected by GBM, with more source counts leading to smaller statistical localization errors, they are more representative of the overall population of GRBs detected by GBM than the reference sample in Briggs et al. (1999) is of the overall GRB population detected by BATSE. The reference GRB population in this work is drawn from experiments with higher fluence thresholds (IPN, Fermi-LAT) but also from experiments with equal or lower fluence sensitivity (Swift-BAT, INTEGRAL), whereas the reference sample in Briggs et al. (1999) comprised only GRBs bright enough for detection by the IPN.


5 Investigating the systematic uncertainty associated with GBM localizations
We use a Bayesian approach to find a model characterizing the systematic uncertainties in GBM localizations. This approach was used by Briggs et al. (1999) to show that the systematic uncertainties in BATSE GRB localizations were better fit using a model that contained most of the probability in a core distribution that peaked at 1.6∘, with a larger uncertainty in an extended tail, than by a single component.
The GBM localization program estimates a statistical location uncertainty, . The localization errors are larger due to systematic errors, so we represent the total location uncertainty as . The errors are assumed to be azimuthally symmetric. The models are based on the Fisher probability density function, which has been called the Gaussian distribution on the sphere (Fisher et al. 1987):
| (1) |
where is the angle between the measured and true location, is termed the concentration parameter and is solid angle. Considering to be the radius of the circle containing 68% of the total probability, integrating eq. 1 relates and in radians (Briggs et al., 1999):
| (2) |
We find equation 2 works well over a broad range of and use it for all values in our sample.
For comparison with point reference locations, we denote the separation between a GBM localization and the reference location as , while for an arc we denote the separation beween the GBM localization and the closest point on the center-line of the annulus as . Of course, the true separation might be larger than . Our aim is to develop and test models for the GBM localization probability density function . We assume the GBM localization probability is a Fisher function or the sum of two Fisher functions:
| (3) |
For these cases, the probability density function is known analytically (Briggs et al., 1999).
We use Bayesian model comparison to test models for the systematic error (Loredo, 1990; Sivia, 1996). Bayesian model comparison is based on the likelihood, which is the product of the probabilities of the observed offsets:
| (4) |
The equation shows the dependence of the likelihood on the offsets , and , ; also depends on the error model and is a function of the error model parameters through the functions and . The reference data are of two types, point locations and arcs, disparately testing the quality of the GBM localizations. The Bayesian model comparison naturally handles the difference in evidence since both types of reference data are included in the likelihood via probabilities.
A complicated model with many parameters may have improved likelihood because the model is better or because the additional parameters allow the model to conform to statistical fluctuations. The question is, is the improvement in likelihood sufficient that we should believe in the more complicated model? Bayesian model comparison handles this problem by penalizing models with additional parameters with Occam’s factors . Assuming that a reasonable range, or prior, for the parameter is from to , that the model fitting has estimated the parameter uncertainty as and that the likelihood function is approximately Gaussian, the Occam’s factor for parameter is (Sivia, 1996):
| (5) |
We consider all of the models equally plausible (i.e., identical priors), so that the Odds ratio by which one should favor model B over model A is
| (6) |
Instead of listing the Odds ratios for every combination of models and we calculate in Tables 2 to 8 the quantities
| (7) |
The base-10 logarithm of the Odds factor of two models may be obtained by differencing these values.
The following models were tested (where we use the term Gaussian to denote the Fisher function):
-
•
A single component fit by a Gaussian. This model has a single parameter, the peak position of the Gaussian.
-
•
A single component modeled by a Gaussian, split into 2 populations depending on the hemisphere containing the GRB position, in spacecraft coordinates. One model each for the X, Y and Z hemispheres splits the GRBs into positive and negative hemispheres. These models have two parameters: the peak of the Gaussian for bursts in each hemisphere.
-
•
To explore the effects of the symmetry of the Fermi spacecraft on the GBM localization accuracy, the samples were also divided according to quadrant, with GRB positions within the X quadrants separated from those localized within the Y quadrants. These models have two parameters: the peak of the Gaussian for bursts in each quadrant set.
-
•
A core-plus-tail modeled by two Gaussians. This model has three parameters: the peak position of each Gaussian and the fraction in the core.
-
•
A core-plus-tail modeled by two Gaussians, split into 2 populations depending on the hemisphere of the GRB position, in spacecraft coordinates (one model each for the X, Y, and Z hemispheres). Each model has six parameters: the peaks of the two Gaussians and the fraction in the core, for each hemisphere.
-
•
A core-plus-tail modeled by two Gaussians, split into two sets of quadrants, one containing the GRBs located within the X quadrants, the other within the Y quadrants. This model, like the hemisphere models, has six parameters.
| Single-Component Gaussian | ||||||
| Type | Number GRB | Peak | Error | Log10 | Log10 | |
| Point | Annuli | ∘ | ∘ | Likelihood | Odds Factor | |
| Ground-Auto | 208 | 100 | 6.62 | 0.29 | 155.2 | 154.3 |
| HitL 4.14g | 212 | 100 | 5.15 | 0.22 | 224.6 | 223.6 |
| HitL 4.13 | 211 | 100 | 6.23 | 0.26 | 192.6 | 191.7 |
| Core + Tail (2 Gaussians) | ||||||||||
| Type | Number GRB | Core | Error | Core | Error | Tail | Error | Log10 | Log10 | |
| Point | Annuli | ∘ | ∘ | % | % | ∘ | ∘ | Likelihood | Odds Factor | |
| Ground-Auto | 208 | 100 | 3.72 | 0.34 | 80.4 | 5.3 | 13.7 | 1.7 | 174.1 | 171.8 |
| HitL 4.14g | 212 | 100 | 3.71 | 0.24 | 90.0 | 3.5 | 14.3 | 2.5 | 241.3 | 238.9 |
| HitL 4.13 | 211 | 100 | 3.57 | 0.32 | 79.8 | 5.3 | 12.7 | 1.5 | 213.5 | 211.1 |
Tables 2 and 3 show the results for the most basic single-component and core-plus-tail fits to the systematic uncertainties on the Ground-Auto, and HitL localizations. In addition to the current version of the localization software, 4.14g, fits for version 4.13 of the HitL localization are included in order to characterize the localizations in the first pair of GRB catalogs and part of the second pair of GRB catalogs (Paciesas et al., 2012; Goldstein et al., 2012; von Kienlin et al., 2014; Gruber et al., 2014), which used this older version. The main change implemented in 4.14g was the selection of a model spectrum based on the values of the best-fit location using all three model spectra rather than a priori using three bands of hardness ratio values to classify the GRB as soft, medium, or hard and finding the minimum only in the single corresponding model rates table. Looking at the difference between the odds factors between the single-component fits in Table 2 and the core-plus-tail fits in Table 3, it can be seen that a core-plus-tail model is favored over a single component model by factors of , , and for the Ground-Auto, HitL 4.14g, and HitL 4.13, respectively. The fraction in the core for the HitL localizations is higher using the more recent code, consistent with Version 4.14g being more robust, although the core values agree within errors, and are in fact slightly lower using the older code.
Results for single-component models exploring the effects of GRB location in spacecraft coordinates on the systematic error are shown in Appendix C. Table 11 shows that parameter values are similar for the systematic errors of GRBs in each of the hemispheres. There is no consistent statistical preference among the three localization types for models based on GRB position in spacecraft coordinates although individual localization types show slight preferences for hemisphere- or quadrant- dependent models. Owing to the placement of the GBM NaI detectors, which maximizes sensitivity in the +Z hemisphere to optimize coverage of GRBs in the LAT FoV, GRBs in the +Z hemisphere are more plentiful, viewed by more detectors, and might be expected to have more accurate localizations. The weak sensitivity of the systematic error to GRB position along the Z-axis suggests that any such effect is encompassed with a larger statistical error for the bursts viewed with fewer detectors in the -Z hemisphere. If we look at the cumulative fraction of GRBs lying within a given offset of the true location, we find that for HitL 4.14g the 68% [90%] containment radius is 5.1∘ [9.9∘] for GRBs localized in the +Z hemisphere versus 5.3∘ [10.9∘] for those in the -Z hemisphere. This difference is larger for version 4.13: 6.1∘ [11.1∘] in the +Z hemisphere versus 6.8∘ [15.0∘] in the -Z hemisphere, consistent with the results shown in Table 11. These numbers also suggest the overall quality of the 4.14g locations is higher than the older version and fewer outliers are produced. The odds ratios for all of the single-component models are much lower than the core-plus-tail model in Table 3, which is thus greatly preferred over any of the single-component models.
Results for core-plus-tail models that explore the effect of GRB position in different spacecraft hemispheres are described in Appendix D. Table 12 shows that localizations using HitL 4.14g are fit with lower parameter values for GRBs in the +Z hemisphere, although this model is not preferred statistically over the simpler, all-sky core-plus-tail model in Table 3. Other hemisphere-dependent core-plus-tail models did not yield significantly different parameters in the two hemispheres, nor were they statistically favored.
| Core + Tail (2 Gaussians) with quadrant dependence | |||||||||||
| Type | Quadrants | Number GRB | Core | Error | Core | Error | Tail | Error | Log10 | Log10 | |
| Point | Annuli | ∘ | ∘ | % | % | ∘ | ∘ | Likelihood | Odds Factor | ||
| Ground-Auto | All-sky | 208 | 100 | 3.72 | 0.34 | 80.4 | 5.3 | 13.7 | 1.7 | 174.1 | 171.8 |
| Ground-Auto | X | 208 | 100 | 4.10 | 0.48 | 75.4 | 8.2 | 13.1 | 2.1 | ||
| Y | 3.06 | 0.61 | 80.6 | 8.9 | 12.9 | 2.9 | 175.0 | 171.7 | |||
| HitL 4.14g | All-sky | 212 | 100 | 3.71 | 0.24 | 90.0 | 3.5 | 14.3 | 2.5 | 241.3 | 238.9 |
| HitL 4.14g | X | 212 | 100 | 4.30 | 0.38 | 90.3 | 5.9 | 15.0 | 4.8 | ||
| Y | 3.34 | 0.26 | 92.0 | 3.5 | 14.5 | 3.5 | 242.6 | 238.7 | |||
| HitL 4.13 | All-sky | 211 | 100 | 3.57 | 0.32 | 79.8 | 5.3 | 12.7 | 1.5 | 213.5 | 211.1 |
| HitL 4.13 | X | 211 | 100 | 4.22 | 0.87 | 72.8 | 15.5 | 11.5 | 2.4 | ||
| Y | 3.24 | 0.35 | 89.4 | 5.1 | 16.8 | 3.3 | 216.2 | 213.0 | |||
Table 4 shows the model fit parameters for localizations grouped according to GRB position within the X and Y quadrants. Unlike the grouping into hemispheres, the differences in parameter values for quadrant-dependent models for all three types of localization cannot be explained by juggling events from the core to the tail. Instead, the Y quadrant GRBs are more likely to be localized with a systematic error in the core, and the value of the systematic error in the core is smaller than for events in the X quadrants. The odds factors for these models can be compared with the all-sky core-plus-tail model repeated in line 1 of the table. This 6-parameter model is favored only for HitL 4.13, which had a larger population of outliers in the tail than HitL 4.14, but the parameter values are suggestive that this 6-parameter model should be favored over the simpler 3-parameter core-plus-tail model with a larger sample or more judiciously chosen quadrants.
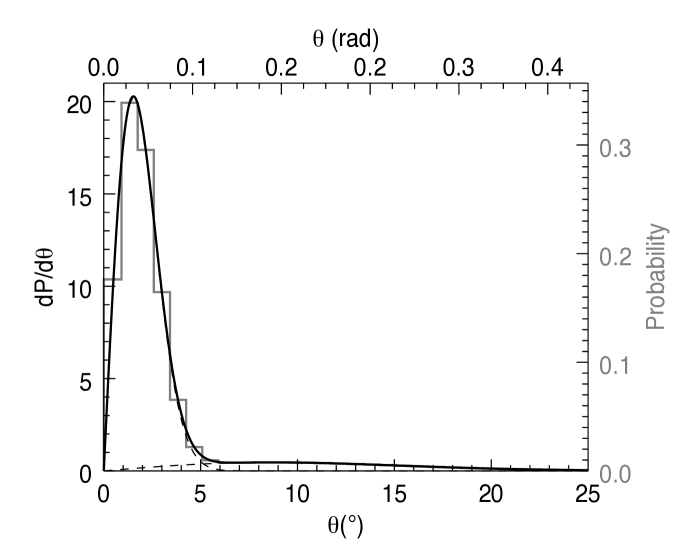
Table 5 displays the quadrant-dependent core-plus-tail model parameters and odds ratios with sliding quadrant azimuth ranges. A larger sample of reference locations will, in the future, allow the quadrant ranges to vary as free parameters but a model with these extra free parameters is too complicated to converge with the current sample. The core-plus-tail models are significantly preferred over single Gaussians so that optimizing the quadrant azimuth ranges with a single Gaussian model is not explored. Entry 1 is the standard all-sky core-plus-tail model, which was found to represent the data better than any of the single-component models we explored. Entry 2 has equal azimuth ranges in each quadrant. Entry 3 explores the effect of making the Y quadrant bigger. This provides no improvement and moves the quadrant core parameter values closer to each other. Narrowing the Y quadrant produces fits that increasingly differentiate between the quadrants, with increasingly favorable odds factors exceeding the simple 3-parameter model. When the Y quadrant becomes too small to contain enough events to constrain the parameters, the odds factor once more decreases. The model that maximizes the odds factor, entry 7, also differentiates the most between the quadrants, with small parameter errors and close to of GRBs in the core in each quadrant set. It is preferred over the all-sky core-plus-tail model by a factor of 16. This set of parameters defines Y quadrants with azimuth in each quadrant and lower systematic errors for GRBs localized in these quadrants than for those in the X quadrants. This quadrant definition also produces larger odds factors for the Ground-Auto localizations than the core-plus-tail model that has equal quadrants, with the Ground-Auto providing an independent data set from the same GRB sample. This quadrant-dependent core-plus-tail model for the systematic uncertainty associated with GBM GRB localizations is illustrated in Figure 8. The figure shows how the probability of the systematic uncertainty changes as a function of angular offset from a GBM GRB localization for GRBs localized in the quadrants.
| Core + Tail (2 Gaussians) varying the azimuth boundaries of the quadrants | ||||||||||
| Version 4.14g of the HitL code with 212 reference locations and 100 IPN annuli | ||||||||||
| # | Quadrants | Azimuth ranges | Core | Error | Core | Error | Tail | Error | Log10 | Log10 |
| ∘ | ∘ | % | % | ∘ | ∘ | Likeli- | Odds | |||
| hood | Factor | |||||||||
| 1 | All-sky | 0 - 360∘ | 3.71 | 0.24 | 90.0 | 3.5 | 14.3 | 2.5 | 241.3 | 238.9 |
| 2 | X | 315 - 45∘ and 135 - 225∘ | 4.30 | 0.38 | 90.3 | 5.9 | 15.0 | 4.8 | ||
| Y | 45 - 135∘ and 225 - 315∘ | 3.34 | 0.26 | 92.0 | 3.5 | 14.5 | 3.5 | 242.6 | 238.7 | |
| 3 | X | 320 - 40∘ and 140 - 220∘ | 4.23 | 0.52 | 87.2 | 7.7 | 14.1 | 4.8 | ||
| Y | 40 - 140∘ and 220 - 320∘ | 3.47 | 0.25 | 93.6 | 3.3 | 15.5 | 3.6 | 242.6 | 238.8 | |
| 4 | X | 305 - 55∘ and 125 - 235∘ | 4.25 | 0.32 | 92.6 | 4.6 | 15.9 | 4.7 | ||
| Y | 55 - 125∘ and 235 - 305∘ | 3.16 | 0.45 | 90.2 | 4.8 | 14.8 | 3.6 | 242.6 | 238.8 | |
| 5 | X | 300 - 60∘ and 120 - 240∘ | 4.32 | 0.29 | 93.4 | 4.0 | 16.2 | 4.9 | ||
| Y | 60 - 120∘ and 240 - 300∘ | 2.59 | 0.40 | 86.6 | 6.1 | 13.5 | 3.2 | 243.9 | 240.1 | |
| 6 | X | 295 - 65∘ and 115 - 245∘ | 4.17 | 0.28 | 91.3 | 3.9 | 15.5 | 3.6 | ||
| Y | 65 - 115∘ and 245 - 295∘ | 2.42 | 0.38 | 89.3 | 5.7 | 13.2 | 3.9 | 244.2 | 240.2 | |
| 7 | X | 292.5 - 67.5∘ and 112.5 - 247.5∘ | 4.17 | 0.28 | 91.8 | 3.9 | 15.3 | 3.6 | ||
| Y | 67.5 - 112.5∘ and 247.5 - 292.5∘ | 2.31 | 0.39 | 88.4 | 6.4 | 13.2 | 3.8 | 244.2 | 240.3 | |
| 8 | X | 290 - 70∘ and 110 - 250∘ | 4.12 | 0.28 | 91.7 | 3.9 | 14.9 | 3.6 | ||
| Y | 70 - 110∘ and 250 - 290∘ | 2.35 | 0.43 | 87.0 | 7.0 | 12.7 | 4.0 | 243.7 | 239.9 | |
| 9 | X | 285 - 75∘ and 105 - 255∘ | 3.96 | 0.26 | 89.9 | 3.8 | 15.3 | 2.9 | ||
| Y | 75 - 105∘ and 255 - 285∘ | 2.64 | 0.54 | 90.7 | 10.6 | 9.1 | 4.8 | 243.0 | 239.4 | |
5.1 Flight Software systematic localization uncertainties
Both the Initial and Final FSW locations had sufficiently distant outliers () that most single component fits did not converge. Removing the five worst localizations allowed the fitting of several single component models for the Initial locations, shown in Table 6. The IPN annuli were also removed as it could not be determined for these reference locations which were the worst outliers and the fits failed to converge when they were included. The single-component fits for the FSW Initial locations are presented because these were the only fits that converged, and the parameter values may be useful, but it should be noted that these fits omit the five worst localizations.
| FSW Initial Locations: Single Component models across hemispheres | ||||||
| Model | Number GRB | Peak | Error | Log10 | Log10 | |
| Point | Annuli | ∘ | ∘ | Likelihood | Odds Factor | |
| Single | 187 | 0 | 15.4 | 0.8 | 3.7 | 3.2 |
| Hemisphere +X | 187 | 0 | 12.2 | 1.2 | ||
| -X | 17.2 | 1.2 | 5.5 | 4.9 | ||
| Hemisphere +Y | 187 | 0 | 12.7 | 1.0 | ||
| -Y | 18.2 | 1.4 | 6.0 | 5.4 | ||
| Quadrants X | 187 | 0 | 19.7 | 1.6 | ||
| Y | 12.5 | 0.9 | 7.5 | 6.9 | ||
Fits using the more complex core-plus-tail models converged using the entire FSW Final location sample (omitting the IPN set). These fits and the single component fits with a Z hemisphere dependence for the FSW Final locations, the only single-component model that converged with the entire sample, are reported in Table 7.
| Core + Tail fits to the systematic uncertainty on the FSW Final locations | |||||||||||
| Type | Hemisphere | Number GRB | Core | Error | Core | Error | Tail | Error | Log10 | Log10 | |
| Point | Annuli | ∘ | ∘ | % | % | ∘ | ∘ | Likelihood | Odds Factor | ||
| All-sky | 192 | 0 | 7.52 | 0.76 | 89.7 | 2.9 | 55.6 | 9.0 | 39.6 | 38.1 | |
| Quadrant | X | 192 | 0 | 8.29 | 1.34 | 85.7 | 6.2 | 59.6 | 12.9 | ||
| Y | 7.35 | 1.03 | 92.9 | 3.7 | 62.6 | 18.5 | 40.1 | 38.5 | |||
| Hemi | +X | 192 | 0 | 5.99 | 1.12 | 86.3 | 4.6 | 47.2 | 9.0 | ||
| -X | 8.80 | 1.02 | 92.2 | 3.4 | 68.2 | 27.2 | 40.4 | 38.5 | |||
| Hemi | +Y | 192 | 0 | 7.84 | 1.16 | 92.4 | 4.9 | 35.6 | 12.3 | ||
| -Y | 6.66 | 1.17 | 84.3 | 4.8 | 62.2 | 13.2 | 41.3 | 39.5 | |||
| The Z-hemisphere model failed to converge. The Z-hemisphere-dependent single component is below. | |||||||||||
| Single | +Z | 192 | 0 | 12.18 | 0.7 | ||||||
| -Z | 34.09 | 2.71 | 13.0 | 12.6 | |||||||
In September 2009, the Fermi rocking angle changed from to . The rocking angle change was necessary to keep the spacecraft battery cool, but one unfortunate effect on GBM is that more GRBs are viewed with an unfavorable detector geometry and the GBM localization quality may have suffered. Because of on-board hardware limitations, the full atmospheric scattering calculation performed on the ground is replaced by a standard model table for the atmospheric scattering contribution that assumes a zenith-pointed spacecraft. This becomes increasingly unrealistic with the updated rocking angle but the on-board limitations do not permit multiple tables that would cover several possible Fermi pointings. In order to assess the effect of this change on the FSW localizations, the FSW Final location sample was split into the 43 GRBs occurring before the change and the 149 since then. Table 8 shows a comparison of the systematic errors on these localizations. Single-component fits were possible with the smaller sample and only core-plus-tail modeling was possible with the larger sample. It appears the worst outliers have been detected since the rocking angle change and the value of the systematic error for the core is higher than the single model that best fits the sample localized before the rocking angle change. This suggests there has been a deterioration in the quality of the FSW localizations since September 2009.
| Effect of rocking angle change on FSW localization systematic uncertainty | |||||||||
| Type | Hemisphere | Core | Error | Core | Error | Tail | Error | Log10 | Log10 |
| ∘ | ∘ | % | % | ∘ | ∘ | Likelihood | Odds Factor | ||
| FSW Final locations for 43 GRBs in initial rocking profile | |||||||||
| All-sky | 5.80 | 0.99 | 25.3 | 24.9 | |||||
| Hemi | +Y | 4.52 | 1.39 | ||||||
| -Y | 6.98 | 1.58 | 25.6 | 25.2 | |||||
| Quad | X | 8.10 | 1.79 | ||||||
| Y | 3.82 | 1.26 | 26.2 | 25.9 | |||||
| FSW Final locations for 149 GRBs since the rocking angle change | |||||||||
| All-sky | 8.32 | 1.01 | 87.0 | 3.8 | 56.6 | 9.8 | 17.1 | 15.9 | |
| Hemi | +X | 7.59 | 1.32 | 84.0 | 5.7 | 48.8 | 10.1 | ||
| -X | 9.14 | 1.26 | 89.9 | 4.6 | 67.7 | 27.0 | 17.3 | 15.9 | |
| Hemi | +Y | 10.21 | 1.46 | 95.1 | 5.4 | 48.2 | 29.6 | ||
| -Y | 6.18 | 1.77 | 79.9 | 6.3 | 60.1 | 12.6 | 19.0 | 18.0 | |
| Hemi | +Z | 7.52 | 1.42 | 93.1 | 5.4 | 42.4 | 15.9 | ||
| -Z | 10.40 | 2.32 | 67.3 | 9.9 | 63.0 | 14.8 | 21.0 | 20.1 | |
| Quad | X | 7.93 | 1.63 | 78.5 | 7.4 | 52.6 | 10.7 | ||
| Y | 9.26 | 1.09 | 93.3 | 3.8 | 71.9 | 51.7 | 17.8 | 16.8 | |
5.2 The special case for short GRBs
Short GRBs (SGRB, duration 2 s) are especially interesting to the follow-up community, both because they are rarer and because their putative association with the merger of a neutron star with either a neutron star (NS-NS) or a black-hole (NS-BH) is less well established than the connection between long GRBs and the collapse of massive stars. It is useful to characterize the systematic errors of the short GRB localizations in order to assess the regions with the maximum probability of containing the source or to calculate the probability that the GRB was in a region observed in another wavelength.
Only 22 of the 203 reference locations in our sample are for short GRBs, and an additional 13 SGRBs have narrow IPN annuli. The top panel of Figure 9 shows the reported 68% CL error on the GBM locations as a function of their offset from the real GRB position for the HitL localizations of the 22 SGRBs in our sample. The cumulative distribution of offsets from the true position appears in the bottom panel. Owing to the low fluences of SGRBs, they are typically localized with larger statistical uncertainties than long GRBs. The 68% and 90% containment radii of the true positions from the GBM positions are 8.7∘ and 16.1∘, respectively, but with large uncertainties owing to the small sample size. There is a steep rise in containment of the true source position at just under 6∘ from the GBM position after which it remains flat, though with 22 events this curve may also result from small statistics. Covering an area 6∘ around the reported position might be a good strategy, regardless of the reported error on the localization, which is only weakly correlated with the true source offset for these short events. Ground-automated localizations of SGRBs are displayed in the same way in Figure 10. It can be seen that although the containment radii are higher (10.5∘ and 26.5∘ for the 68% and 90% sample containment), there is a similar steep rise at just under 6∘ from the position reported by GBM so that with a limited FoV, observers would capture 50% of the true positions using a search radius of 6∘.


More short GRBs with known positions are required to characterize the systematic error on these events convincingly. A preliminary analysis of the HitL 4.14g locations for SGRBs using our Bayesian code, which uses 13 IPN annuli in addition to the 22 reference locations, suggests a single-component systematic uncertainty of . A core-plus-tail model with , a core fraction of and a tail component of is mildly preferred and suggests the short burst systematic uncertainties are compatible with those of the GRB population as a whole, with the exception that the fraction in the tail is higher. This could explain the larger systematic uncertainty obtained in the single-component model for the short bursts compared to the population as a whole (). Attempts to characterize the systematic uncertainty associated with the Ground-Auto localizations fail with this small sample. The sample of SGRBs with IPN annuli can be increased using the large number of SGRBs seen only by GBM and Konus-Wind (Pal’shin et al., 2013).
5.3 Applying the model to the data
Figure 5 showed that only 39% of the HitL localizations fell within the statistical uncertainty region of the true reference location, , with 70% within . If we convolve the statistical uncertainty, assuming circular uncertainty regions, with the best-fit quadrant-dependent core-plus-tail model of the systmatic uncertainty, , explored in Section 5, adding the functions in quadrature , then we find that 67.5% lie within the radius and 94.5% within . If instead of the circular assumption we make for we convolve the map with the model for the systematic uncertainty that was found to be the best fit of those we explored in Section 5, these numbers are 68.7% and 91.4%, respectively. Similar results are found for the Ground-auto localizations. Propagating the uncertainties on the model parameters produces a variation of 1-2% in these containment percentages.
6 Summary and future plans
Using a reference sample of 203 GRBs with known locations we have found that ground-automated GBM localizations distributed as Ground Position GCN notices between 30 s and about a minute after the trigger time lie within of the true location 68% of the time and within 90% of the time (Figure 4). These numbers are for the population as a whole and do not take into account the reported statistical uncertainty. For GRBs with small statistical localization uncertainties of this improves to for the 68% containment level, with the sample of GRBs with localization errors this small insufficient to determine the 90% containment level (Figure 6). The localizations produced with human intervention (HitL) that are distributed as Final Position GCN notices 30 min to hours after the trigger are within and of the true position for 68% and 90% of GRBs, respectively. For GRBs with statistical localization uncertainties of the 68% containment radius is with the sample again too small to determine the 90% containment radius.
An analysis of the systematic uncertainty on GBM localizations that takes into account the reported statistical uncertainty used, in addition to the 203 point locations, 100 IPN annuli and 9 IPN intersecting annuli that are treated as point locations, for a total of 312 reference locations. The model that best represents the systematic uncertainty for both the automated and HitL localizations includes a core component and a tail component. For the Ground-Auto, the core component is a Gaussian that peaks at and contains about 80% of the GRB locations, with a Gaussian tail peaked at . The HitL systematic uncertainty has similar values but 90% of the localizations are contained in the core (Table 3). Both localization types show evidence for a dependence of the error on the GRB position in spacecraft coordinates, with bursts incident near the Y-axes better localized than those near the X-axes (Table 4). With three extra parameters, the size of the reference sample is not large enough for this model to be preferred statistically. Modifying the azimuthal area covered in these X- and Y- axes produces a model for the HitL localizations that is preferred over the simpler core-plus-tail model described above (Table 5). Because the parameters in this model are well-constrained and the results are reproduced using the Ground-Auto localizations, we consider this a good model for the systematic uncertainty of GBM-localized GRBs.
Applying this model to the data, using either the circular approximation to that was input to the Bayesian model or the actual -grid values to define the statistical confidence levels, resulted in the containment percentages of the the reference locations within the expected total uncertainty regions.
The quality of our localization depends on the quality of the model rates that we compare with our observed rates. This in turn relies on our knowledge of the detector responses both to the direct flux and to the scattered flux from both the spacecraft and the atmosphere. Systematic effects owing to a poor choice of model spectrum may contribute to a poor localization, as can inaccuracies in our detector response, our mass model of the Fermi spacecraft, and our model of scattering from the atmosphere. The dependence of the systematic uncertainty in our localization on the position of the GRB in spacecraft coordinates may offer clues to the major sources of these systematic errors. A systematic error that was dominated by our detector responses or by inaccuracies in our atmospheric scattering modeling is unlikely to exhibit such a dependence on position in spacecraft coordinates, although both of these factors may play a part. The X sides of the spacecraft contain much of the wiring and electronics boxes, with the -X side also housing the star trackers. By contrast, the Y sides, housing the LAT radiators and solar panels, are clearer of material. The quadrant dependence of implies that the bursts incident on parts of the spacecraft with fewer electronics boxes and large cable bundles have better localizations than those arriving on a busier part of the spacecraft. This may imply inaccuracies in our mass model lead to a miscalculation of the observed rates that arise from scattering in the spacecraft. We will explore the possibilities of improving this model in future work.
The localization of short GRBs is poorer than long GRBs, with 68% localized within of the true position when humans are involved and in the automated process. The sample is small so these containment radii have large uncertainties. An analysis of the systematic uncertainty on the HitL locations of short bursts finds it is similar to long bursts, suggesting the difference is owed to the poorer statistics associated with fewer counts. Figures 9 and 10 show that the large values may be attributable to outliers and that 50% of both HitL and Ground-Auto localizations of short GRBs are contained within 6∘ of the true location.
Flight software locations suffer larger statistical and systematic uncertainties and are useful mainly to assist the LAT onboard science algorithms and to initiate repointings of the spacecraft in response to bright GRBs (Figure 2 and Tables 6 and 7). The quality of FSW localizations has significantly declined following the rocking profle change of Fermi in September 2009 (Table 8) and we will endeavor to mitigate this deterioration, with enhancements subject to the limitations of onboard processing.
Improving the Ground-Auto localization to approach the quality of the HitL localization is a priority, with the first goal to replace the peak flux localizations, which use MAXRATES packets, with fluence localizations using the entire count-rate time series as it arrives in real-time. This should reduce the statistical component to the localization uncertainty on the Ground-Auto positions. Identifying outliers in the automated process could also help, particularly for the short GRBs, which will not be significantly improved by the implementation of a fluence localization.
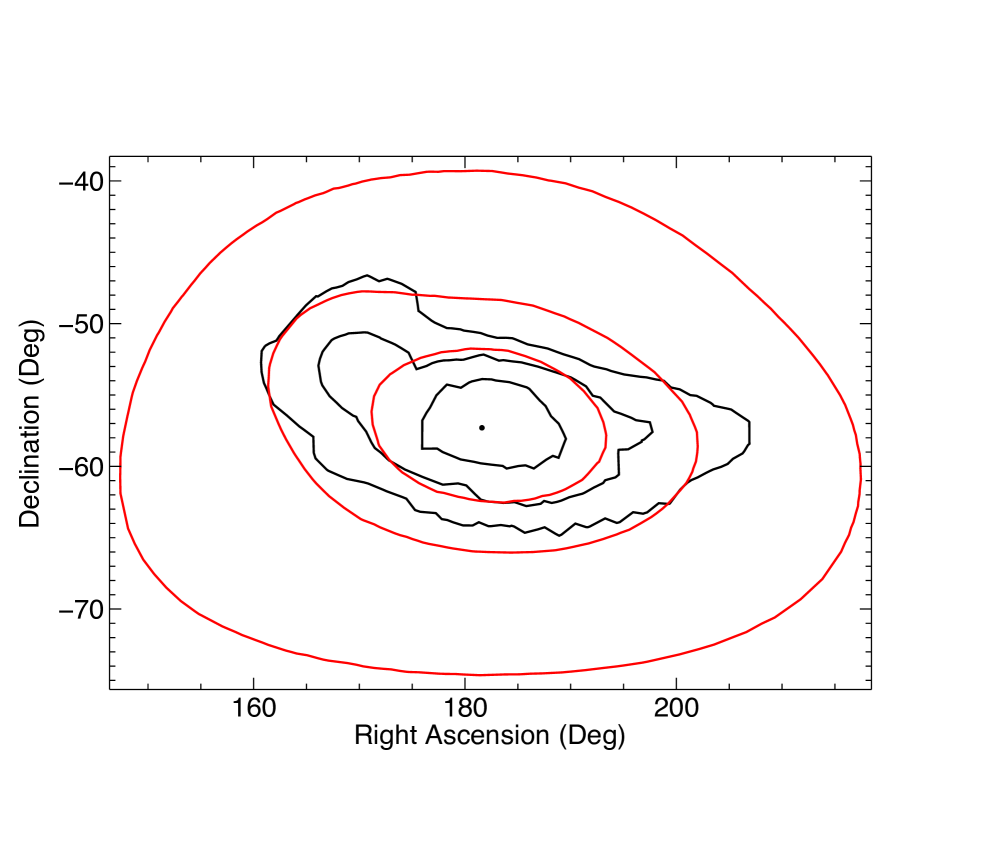
The GCN localization notices currently report a 68% confidence-level statistical uncertainty that assumes a circular region around the minimum position. In practice, the contours can be elliptical or irregular depending on the map returned in the minimization process. We have implemented an algorithm to convolve the map with an input systematic uncertainty model to return , , and contour maps for our localizations. An example is shown in Figure 11. The contours returned by the localization process can be ragged. They are overplotted on the smoothed contours with which the systematic uncertainty, modeled as the sum of two quadrant-dependent Fisher functions described above, has been convolved. As the systematic error is better characterized, and hopefully improved, the model parameters are easily modified to return the contours that best represent the current knowledge of the localization quality. We started delivering these contour maps to the community in January 2014. They are used regularly by the iPTF team in follow-up observations that have led to the discovery of seven GRB afterglows. The maps are available at the Fermi Science Support Center 111http://fermi.gsfc.nasa.gov/gbm in ascii, png, and FITS format. Because of the real-time delivery limitations of the GCN and processing and transfer latency to the FSSC, the contours are available at the Fermi Science Support Center from 30 minutes to a couple of hours after the GRB trigger.
Appendix A Distributions of for GBM GRB localizations
A grid of 41168 possible arrival directions in a spacecraft coordinate system, apart, contains the expected count rates in each of the 12 NaI detectors for a burst originating from that direction. The relative count rates in the 12 detectors depend not just on the arrival direction but also on the energy spectrum of the gamma-ray source. Minimizing on the grid of 41168 possible arrival directions based on the observed count rates from a GRB yields the best fit arrival direction for that assumed spectral shape.
For each of 41168 positions in the grid, i, we find
| (A1) |
where and are the total observed and background rates, respectively, observed between 50 and 300 keV in detector ; are the model rates in the same energy range for detector in row ; and is the normalization factor for row such that
| (A2) |
We try three different spectral models representing soft, medium, and hard GRB spectra, as described in section 2. The direction yielding the lowest may vary according to the spectral model, so we obtain up to three possible arrival directions, one for each model. The spectral model returning the lowest is assumed to be the better fit to the data and the code therefore selects the position yielding the lowest across all three models as the most likely arrival direction for the GRB.
In the reference sample that includes the 203 reference locations from other satellites and the 110 locations from the IPN, the location from the hard spectrum model table is selected 16% of the time, the medium 53% and the soft 31%. The medium and soft GRB spectral models produce the same burst arrival direction for 33% of the sample and only two GRBs are localized to the same grid point under all three spectral models. There are no cases where the hard and soft spectra produce the same minimum arrival direction but where those directions are different from those obtained under the assumption of the medium GRB spectrum. The use of three spectral models thus produces different optimal arrival directions for 2/3 of the GRB reference sample. The statistical preference for the soft or medium tables over the hard table or vice versa typically involves tens of units of whereas the selection of soft over medium or vice versa typically involves fewer than 20 units of . Using any of the three models individually for the whole sample results in poorer localizations overall, as determined by both a larger median distance to the true location for the whole sample and a larger value for the systematic error calculated as described in section 5. This suggests the assumed source spectrum does affect the quality of the localization. We have tried different spectral models, working from the distribution of measured catalog values for Band function parameters (Goldstein et al., 2012; Gruber et al., 2014) but have thus far not obtained a significant improvement relative to the methods and models currently being used that are described in this paper. This was somewhat surprising given that the assumed spectral shapes (particularly the hard spectrum) are extreme compared to the measured spectral shapes. We also expect that because of the scattering of high-energy photons off material in the spacecraft into the 50 - 300 keV energy range used for the localization process, systematic effects arising from inaccuracies in the spacecraft mass model in our simulations result in spectrally harder bursts being more poorly localized than bursts with a softer spectrum. Quantifying the effect by dividing the GRB sample, for example by hardness ratios or values, is complicated by the fact that short GRBs are spectrally harder, have lower fluences (and hence larger statistical uncertainties), and are underrepresented in the GRB sample with reference locations. The effects of spectral modeling on source localization are still being explored and will be reported in a future paper.
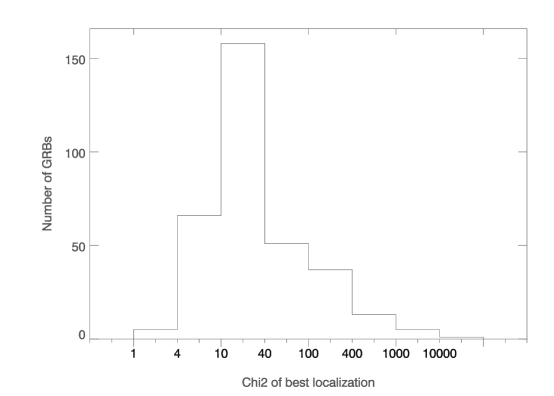
Localization uncertainties for dim GRBs are dominated by statistics. Bright bursts have low statistical uncertainties and their values become larger with increasing intensity as the goodness of fit is affected by systematics. Figure 12 shows the distribution of minimized values for the reference sample and the dependence of this value on the brightness of the GRB, represented by the significance above the background of the data used in the localization. Figure 13 shows the same quantities but with the minimum calculated after normalizing the observed data rates to those of a GRB of average intensity (1 photons/cm2/s between 50 and 300 keV). The dependence of the minimum on source intensity disappears for bright GRBs ( above background) but the weaker bursts now show higher normalized values, probably because the quality of the localization depends more on the quality of the fit to the background data than for brighter GRBs, and systematics due to poor background fitting are magnified by the normalization of the source rates upwards to a GRB of average intensity. In the localization process, we use the normalized to assess the goodness-of-fit of the localization, rejecting localizations with normalized values above 500 as bad fits. This threshold was found to be efficient in rejecting triggered events due to particle precipitation, which do not have relative detector rates consistent with a point on the sky, without rejecting GRBs with poor localizations. The normalization process does not affect either the determination of the arrival direction, the spectral model that is selected, or the reported localization uncertainty that is calculated based on observed rather than normalized count rates.


Appendix B Reference locations
| Burst Name | Common Name | Trigger Time | FSW for Ref. | FSW for Ref. | Ground Auto for Ref. | H.i.t.L for Ref. | Ref. Location | Reference | |||||||||
|---|---|---|---|---|---|---|---|---|---|---|---|---|---|---|---|---|---|
| (UT) | (RA | Dec | Err) | (RA | Dec | Err) | (RA | Dec | Err) | (RA | Dec | Err) | (RA | Dec) | |||
| 080714745 | GRB 080714A | 17:52:54.03 | - | - | - | - | - | - | 185.3 | -57.7 | 3.8 | 183.5 | -57.5 | 3.9 | 188.1 | -60.2 | Barthelmy et al., GCN 7979 |
| 080723557 | GRB 080723B | 13:22:21.38 | - | - | - | - | - | - | 177.6 | -58.8 | 1.2 | 175.1 | -60.7 | 1.0 | 176.8 | -60.2 | Gotz et al., GCN 8002 |
| 080725435 | GRB 080725A | 10:26:09.06 | - | - | - | - | - | - | 120.2 | -13.4 | 4.1 | 123.1 | -23.1 | 2.2 | 121.7 | -14.0 | Krimm et al., GCN 8014 |
| 080727964 | GRB 080727C | 23:07:46.22 | - | - | - | - | - | - | 43.5 | 59.8 | 4.2 | 40.0 | 62.2 | 2.7 | 32.6 | 64.1 | Fenimore et al., GCN 8044 |
| 080804972 | GRB 080804A | 23:20:14.88 | - | - | - | - | - | - | 324.1 | -52.7 | 3.9 | 320.8 | -52.7 | 2.4 | 328.7 | -53.2 | Markwardt et al., GCN 8067 |
| 080810549 | GRB 080810A | 13:10:12.59 | - | - | - | - | - | - | 358.3 | -5.7 | 5.0 | 355.8 | 5.5 | 2.2 | 356.8 | 0.3 | Sakamoto et al., GCN 8082 |
| 080905499 | GRB 080905A | 11:58:55.04 | - | - | - | - | - | - | 282.5 | -12.0 | 4.3 | 287.0 | -20.0 | 4.1 | 287.7 | -18.9 | Cummings et al., GCN 8187 |
| 080905705 | GRB 080905B | 16:55:46.85 | - | - | - | - | - | - | 291.7 | -56.2 | 6.1 | 307.7 | -62.1 | 5.8 | 301.7 | -62.6 | Barthelmy et al., GCN 8188 |
| 080916009 | GRB 080916C | 00:12:45.62 | - | - | - | - | - | - | 124.3 | -54.3 | 2.5 | 124.4 | -54.7 | 1.4 | 119.8 | -56.6 | Tajima et al., GCN 8246 |
| 080916406 | GRB 080916A | 09:45:18.94 | - | - | - | - | - | - | 334.3 | -57.1 | 3.2 | 335.3 | -56.4 | 2.2 | 336.3 | -57.0 | Baumgartner et al., GCN 8243 |
| 080928628 | GRB 080928A | 15:04:56.05 | - | - | - | - | - | - | 132.3 | -73.7 | 12.5 | 97.8 | -50.0 | 4.0 | 95.1 | -55.2 | Fenimore et al., GCN 8297 |
| 081008832 | GRB 081008A | 19:58:01.80 | 257.9 | -47.6 | 22.8 | 296.9 | -46.2 | 14.4 | 273.1 | -50.9 | 7.2 | 274.4 | -53.8 | 3.4 | 280.0 | -57.5 | Racusin et al., GCN 8344 |
| 081012549 | GRB 081012A | 13:10:23.04 | 22.3 | -32.5 | 17.6 | 28.9 | -25.4 | 11.6 | 36.7 | -12.8 | 7.1 | 27.2 | -11.2 | 5.6 | 30.2 | -17.6 | Sato et al., GCN 8363 |
| 081024245 | GRB 081024A | 05:53:09.01 | 38.4 | 55.2 | 25.3 | 38.4 | 55.2 | 25.3 | 34.3 | 62.5 | 6.2 | 34.3 | 62.5 | 12.8 | 27.9 | 61.3 | Barthelmy et al., GCN 8404 |
| 081024891 | GRB 081024B | 21:22:40.87 | 317.8 | 20.7 | 20.0 | 317.8 | 20.7 | 20.0 | 320.3 | 17.1 | 5.4 | 319.6 | 17.9 | 5.9 | 322.9 | 21.2 | Omodei, GCN 8407 |
| 081025349 | GRB 081025A | 08:23:05.30 | 225.1 | 57.5 | 15.4 | 241.3 | 55.3 | 7.2 | 240.6 | 56.3 | 2.2 | 245.9 | 56.8 | 3.2 | 245.3 | 60.5 | Copete et al., GCN 8409 |
| 081101491 | GRB 081101A | 11:46:32.06 | 93.6 | 10.9 | 14.3 | 93.6 | 10.9 | 14.3 | 89.9 | 0.9 | 13.7 | 80.8 | 11.6 | 10.1 | 95.8 | -0.1 | Barthelmy et al., GCN 8458 |
| 081102739 | GRB 081102A | 17:44:21.60 | 326.8 | 57.8 | 18.9 | 318.8 | 61.6 | 15.8 | 303.6 | 56.1 | 7.8 | 321.3 | 51.9 | 4.5 | 331.2 | 53.0 | Fenimore et al., GCN 8468 |
| 081109293 | GRB 081109A | 07:02:02.42 | 327.6 | -52.4 | 29.3 | 320.8 | -49.6 | 18.0 | 310.7 | -57.3 | 10.6 | 331.5 | -51.9 | 3.5 | 330.8 | -54.7 | Markwardt et al., GCN 8507 |
| 081121858 | GRB 081121A | 20:35:27.76 | 106.9 | -67.4 | 18.1 | 101.4 | -62.4 | 5.8 | 78.1 | -53.3 | 2.9 | 97.2 | -59.9 | 1.1 | 89.3 | -60.6 | Sakamoto et al., GCN 8539 |
| 081126899 | GRB 081126A | 21:34:09.07 | 331.7 | 43.0 | 6.4 | 331.9 | 43.0 | 6.5 | 327.3 | 47.8 | 1.5 | 326.9 | 50.3 | 2.7 | 323.5 | 48.7 | Sato et al., GCN 8557 |
| 081221681 | GRB 081221A | 16:21:12.22 | 21.7 | -19.6 | 11.9 | 18.3 | -21.7 | 4.2 | 14.6 | -23.9 | 1.6 | 14.1 | -25.2 | 1.2 | 15.8 | -24.5 | Cummings et al., GCN 8708 |
| 081222204 | GRB 081222A | 04:54:00.26 | 34.1 | -26.4 | 7.0 | 29.4 | -30.6 | 5.0 | 18.6 | -32.4 | 2.0 | 18.6 | -32.4 | 1.5 | 22.7 | -34.1 | Fenimore et al., GCN 8709 |
| 081226044 | GRB 081226A | 01:03:37.53 | 90.4 | -59.5 | 15.2 | 90.4 | -59.5 | 15.2 | 121.2 | -68.3 | 9.0 | 124.2 | -68.0 | 9.7 | 120.5 | -69.0 | Krimm et al., GCN 8735 |
| 081226509 | GRB 081226B | 12:13:10.71 | 49.4 | -46.2 | 18.5 | 49.4 | -46.2 | 18.5 | 26.4 | -53.3 | 6.9 | 13.5 | -51.6 | 7.8 | 25.5 | -47.4 | Mereghetti et al., GCN 8734 |
| 090102122 | GRB 090102A | 02:55:30.85 | 122.9 | 26.4 | 9.5 | 133.6 | 28.6 | 5.2 | 130.1 | 29.8 | 1.5 | 128.5 | 30.3 | 1.5 | 128.2 | 33.1 | Sakamoto et al., GCN 8769 |
| 090107681 | GRB 090107B | 16:20:42.77 | 161.0 | 86.0 | 26.1 | 288.8 | 47.1 | 9.0 | 287.9 | 51.3 | 6.8 | 285.9 | 53.3 | 11.4 | 284.8 | 59.6 | Gotz et al., GCN 8786 |
| 090113778 | GRB 090113A | 18:40:40.85 | 31.2 | 35.1 | 8.2 | 31.2 | 35.1 | 8.2 | 26.4 | 32.7 | 7.6 | 29.0 | 38.5 | 8.6 | 32.1 | 33.4 | Tueller et al., GCN 8808 |
| 090117640 | GRB 090117A | 15:22:01.06 | 173.9 | -62.7 | 9.1 | 173.9 | -62.7 | 9.1 | 175.0 | -65.3 | 8.0 | 165.1 | -63.2 | 7.0 | 164.0 | -58.2 | Donnarumma et al., GCN 8817 |
| 090129880 | GRB 090129A | 21:07:15.43 | 264.6 | -37.4 | 7.1 | 264.7 | -37.4 | 6.8 | 268.7 | -32.6 | 1.5 | 270.6 | -33.8 | 1.8 | 269.1 | -32.8 | Barthelmy et al., GCN 8862 |
| 090217206 | GRB 090217A | 04:56:42.56 | 210.3 | -2.6 | 8.2 | 207.5 | 1.1 | 4.8 | 207.8 | -5.3 | 1.6 | 211.3 | -11.6 | 1.0 | 204.9 | -8.4 | Ohno et al., GCN 8903 |
| 090323002 | GRB 090323A | 00:02:42.63 | 190.7 | 20.8 | 5.2 | 184.2 | 21.4 | 5.8 | 190.0 | 20.8 | 1.3 | 190.1 | 21.1 | 1.2 | 190.7 | 17.1 | Ohno et al., GCN 9021 |
| Burst Name | Common Name | Trigger Time | FSW for Ref. | FSW for Ref. | Ground Auto for Ref. | H.i.t.L for Ref. | Ref. Location | Reference | |||||||||
|---|---|---|---|---|---|---|---|---|---|---|---|---|---|---|---|---|---|
| (UT) | (RA | Dec | Err) | (RA | Dec | Err) | (RA | Dec | Err) | (RA | Dec | Err) | (RA | Dec) | |||
| 090328401 | GRB 090328A | 09:36:46.52 | 79.3 | -46.7 | 26.3 | 80.0 | -45.6 | 5.3 | 95.0 | -44.5 | 2.1 | 95.9 | -45.1 | 1.0 | 90.9 | -42.0 | McEnery et al., GCN 9044 |
| 090422150 | GRB 090422A | 03:35:17.07 | 296.9 | 36.1 | 18.4 | 296.9 | 36.1 | 18.4 | 297.7 | 42.1 | 8.5 | 296.3 | 33.2 | 10.3 | 294.7 | 40.4 | Markwardt et al., GCN 9195 |
| 090423330 | GRB 090423A | 07:55:25.40 | 151.3 | 11.0 | 31.9 | 151.3 | 11.0 | 31.9 | 144.5 | 9.1 | 50.0 | 154.9 | 13.5 | 11.2 | 148.9 | 18.2 | Palmer et al., GCN 9204 |
| 090424592 | GRB 090424A | 14:12:08.67 | 177.4 | 8.0 | 3.5 | 177.3 | 7.8 | 3.6 | 191.4 | 18.0 | 1.0 | 191.5 | 18.1 | 1.6 | 189.5 | 16.8 | Sakamoto et al., GCN 9231 |
| 090509215 | GRB 090509A | 05:10:05.72 | 220.2 | -36.7 | 26.0 | 241.9 | -28.8 | 15.5 | 237.5 | -27.7 | 10.1 | 230.1 | -27.7 | 5.7 | 241.4 | -28.4 | Tueller et al., GCN 9335 |
| 090510016 | GRB 090510A | 00:22:59.98 | 340.8 | -33.3 | 4.0 | 340.8 | -33.3 | 4.0 | 335.1 | -31.3 | 1.3 | 335.0 | -31.3 | 1.0 | 333.6 | -26.6 | Ukwatta et al., GCN 9337 |
| 090516353 | GRB 090516A | 08:27:58.35 | 139.4 | -10.7 | 24.9 | 139.5 | -0.5 | 15.0 | 141.6 | -12.8 | 7.9 | 138.5 | -14.8 | 1.1 | 138.2 | -11.9 | Baumgartner et al., GCN 9384 |
| 090518080 | GRB 090518A | 01:54:44.52 | 122.5 | 13.6 | 14.9 | 122.5 | 13.6 | 14.9 | 123.5 | 4.2 | 10.5 | 112.5 | 1.2 | 8.1 | 119.9 | 0.8 | Cummings et al., GCN 9393 |
| 090519881 | GRB 090519A | 21:08:45.88 | 142.2 | 3.1 | 20.6 | 142.2 | 3.1 | 20.6 | 140.3 | 0.9 | 8.5 | 139.8 | -5.4 | 5.2 | 142.3 | 0.2 | Krimm et al., GCN 9406 |
| 090531775 | GRB 090531B | 18:35:56.50 | 250.0 | -43.8 | 7.3 | 250.0 | -43.8 | 7.3 | 254.0 | -35.4 | 5.0 | 252.9 | -31.5 | 7.2 | 252.1 | -36.0 | Cummings et al., GCN 9461 |
| 090618353 | GRB 090618A | 08:28:26.66 | 304.6 | 52.9 | 7.0 | 296.2 | 77.1 | 3.5 | 295.1 | 80.8 | 1.0 | 288.4 | 80.0 | 1.0 | 294. | 78.4 | Baumgartner et al., GCN 9530 |
| 090621185 | GRB 090621A | 04:26:34.49 | 12.7 | 44.1 | 21.1 | 3.4 | 61.2 | 14.3 | 3.6 | 60.8 | 5.4 | 8.7 | 60.8 | 2.4 | 11.0 | 61.9 | Cummings et al., GCN 9546 |
| 090621922 | GRB 090621B | 22:07:25.71 | 341.4 | 63.9 | 14.7 | 341.4 | 63.9 | 14.7 | 348.1 | 67.9 | 7.9 | 320.7 | 68.9 | 9.1 | 313.4 | 69.0 | Krimm et al., GCN 9551 |
| 090625560 | GRB 090625B | 13:26:22.52 | 19.4 | -64.6 | 29.1 | 16.3 | -59.8 | 13.5 | 0.1 | -65.1 | 6.7 | 359.8 | -69.2 | 5.2 | 2.3 | -65.8 | Gotz et al., GCN 9572 |
| 090626189 | GRB 090626A | 04:32:08.89 | 170.0 | -36.6 | 4.8 | 170.6 | -35.5 | 3.9 | 169.9 | -35.3 | 1.0 | 169.6 | -35.8 | 1.0 | 170.0 | -33.5 | Piron et al., GCN 9584 |
| 090704242 | GRB 090704A | 05:47:48.19 | 211.4 | 4.5 | 22.9 | 214.8 | 17.7 | 11.9 | 213.6 | 25.3 | 6.7 | 207.9 | 25.3 | 2.7 | 208.2 | 22.8 | Mereghetti et al., GCN 9620 |
| 090708152 | GRB 090708A | 03:38:18.46 | 150.5 | 22.8 | 27.0 | 150.5 | 22.8 | 27.0 | 140.8 | 21.0 | 16.6 | 150.8 | 24.2 | 13.6 | 154.6 | 26.6 | Palmer et al., GCN 9623 |
| 090709630 | GRB 090709B | 15:07:41.14 | 76.6 | 64.3 | 19.4 | 65.4 | 66.8 | 9.9 | 60.4 | 65.7 | 4.8 | 88.5 | 63.8 | 6.6 | 93.5 | 64.1 | Ukwatta et al., GCN 9641 |
| 090712160 | GRB 090712A | 03:51:00.35 | 79.9 | 14.1 | 34.8 | 79.9 | 14.1 | 34.8 | 55.0 | 22.4 | 26.2 | 72.8 | 20.2 | 5.6 | 70.1 | 22.5 | Barthelmy et al., GCN 9660 |
| 090813174 | GRB 090813A | 04:10:42.60 | 247.2 | 82.7 | 4.7 | 246.9 | 82.7 | 6.3 | 91.4 | 84.7 | 2.1 | 40.2 | 86.0 | 5.1 | 225.1 | 88.6 | Cummings et al., GCN 9788 |
| 090817036 | GRB 090817A | 00:51:26.21 | 88.2 | 53.3 | 9.7 | 67.2 | 45.8 | 8.1 | 65.1 | 39.2 | 3.6 | 64.0 | 40.8 | 3.3 | 64.0 | 44.1 | Evans et al., GCN 9819 |
| 090902462 | GRB 090902B | 11:05:08.32 | 262.6 | 29.7 | 4.8 | 266.4 | 33.9 | 3.5 | 261.4 | 26.0 | 1.0 | 261.4 | 26.1 | 1.0 | 264.9 | 27.3 | De Palma et al., GCN 9867 |
| 090904058 | GRB 090904B | 01:24:13.94 | 257.4 | -24.1 | 26.4 | 266.8 | -17.9 | 10.1 | 266.6 | -27.5 | 4.1 | 265.9 | -30.1 | 1.9 | 264.2 | -25.2 | Sakamoto et al., GCN 9890 |
| 090912660 | GRB 090912A | 15:50:29.11 | 236.2 | 27.5 | 20.0 | 212.7 | 32.3 | 25.6 | 212.8 | 41.8 | 18.4 | 178.5 | 66.0 | 5.1 | 188.0 | 61.5 | Ukwatta et al., GCN 9909 |
| 090915650 | GRB 090915A | 15:35:35.66 | 237.7 | 33.1 | 15.4 | 237.7 | 33.1 | 15.4 | 250.1 | 23.8 | 6.5 | 243.7 | 9.9 | 3.7 | 238.0 | 15.5 | Cummings et al., GCN 9912 |
| 090926181 | GRB 090926A | 04:20:26.99 | 1.3 | -66.1 | 6.2 | 350.0 | -63.3 | 3.5 | 354.4 | -64.3 | 1.0 | 350.1 | -63.5 | 1.0 | 353.4 | -66.3 | Uehara et al., GCN 9934 |
| 090926914 | GRB 090926B | 21:55:28.53 | 38.2 | -31.0 | 30.7 | 26.2 | -31.7 | 9.5 | 28.2 | -32.5 | 3.5 | 44.3 | -43.9 | 2.4 | 46.3 | -39.0 | Grupe et al., GCN 9935 |
| 090927422 | GRB 090927A | 10:07:17.22 | 61.7 | -68.2 | 18.7 | 61.7 | -68.2 | 18.7 | 60.5 | -65.9 | 12.3 | 67.6 | -67.6 | 12.1 | 344.0 | -71.0 | Grupe et al., GCN 9945 |
| 091003191 | GRB 091003A | 04:35:45.59 | 253.1 | 39.6 | 5.1 | 247.7 | 38.2 | 3.7 | 251.6 | 37.3 | 1.0 | 251.2 | 37.3 | 1.0 | 251.5 | 36.6 | McEnery et al., GCN 9985 |
| 091010113 | GRB 091010A | 02:43:09.33 | 299.9 | -21.2 | 3.6 | 300.0 | -21.3 | 3.5 | 291.1 | -23.9 | 1.1 | 293.4 | -23.8 | 1.2 | 298.7 | -22.5 | Donnarumma et al., GCN 10004 |
| 091020900 | GRB 091020A | 21:36:43.82 | 138.1 | 67.2 | 14.8 | 149.6 | 75.7 | 5.8 | 172.3 | 63.7 | 3.4 | 174.4 | 52.7 | 3.1 | 175.7 | 51.0 | Palmer et al., GCN 10051 |
| 091024372 | GRB 091024A | 08:55:58.48 | 337.8 | 27.9 | 25.0 | 78.8 | 46.0 | 8.3 | 356.9 | 56.7 | 10.2 | 340.5 | 55.1 | 2.0 | 339.2 | 56.9 | Sakamoto et al., GCN 10072 |
| 091024380 | GRB 091024A | 09:06:29.36 | 338.8 | 55.5 | 19.8 | 28.7 | 70.5 | 14.6 | 346.7 | 53.8 | 3.4 | 336.4 | 55.9 | 1.0 | 339.2 | 56.9 | Sakamoto et al., GCN 10072 |
| 091026550 | GRB 091026A | 13:11:33.02 | 34.8 | -83.7 | 17.7 | 34.8 | -83.7 | 17.7 | 26.3 | -84.7 | 6.3 | 116.3 | -88.3 | 7.4 | 276.6 | -86.1 | Ukwatta et al., GCN 10089 |
| 091031500 | GRB 091031A | 12:00:28.85 | 71.2 | -56.2 | 10.7 | 76.3 | -63.3 | 5.6 | 69.7 | -57.6 | 1.6 | 70.5 | -59.0 | 1.1 | 71.7 | -57.5 | de Palma et al., GCN 10163 |
| 091102607 | GRB 091102A | 14:34:38.37 | 349.9 | -68.7 | 16.8 | 49.7 | -63.8 | 15.0 | 62.7 | -68.3 | 5.5 | 67.0 | -73.4 | 1.5 | 72.6 | -72.5 | Baumgartner et al., GCN 10121 |
| 091112737 | GRB 091112A | 17:41:15.83 | 249.7 | -42.5 | 21.1 | 252.7 | -47.8 | 10.0 | 258.3 | -41.3 | 6.5 | 258.3 | -36.7 | 3.2 | 257.7 | -36.7 | Palmer et al., GCN 10165 |
| 091120191 | GRB 091120A | 04:34:40.23 | 225.1 | -19.9 | 11.4 | 225.1 | -19.9 | 11.4 | 224.3 | -26.9 | 2.9 | 225.4 | -26.1 | 1.2 | 226.8 | -21.8 | Nakajima et al., GCN 10188 |
| 091127976 | GRB 091127A | 23:25:45.49 | 41.4 | -27.6 | 3.8 | 36.8 | -32.2 | 4.6 | 36.0 | -21.9 | 1.2 | 38.1 | -21.0 | 1.1 | 36.6 | -19.0 | Stamatikos et al., GCN 10197 |
| 091208410 | GRB 091208B | 09:49:57.96 | 28.6 | 24.9 | 8.7 | 28.5 | 25.2 | 4.7 | 29.3 | 14.2 | 2.7 | 30.1 | 13.5 | 2.6 | 29.4 | 16.9 | Baumgartner et al., GCN 10265 |
| 091221870 | GRB 091221A | 20:52:57.22 | 39.1 | 26.6 | 30.6 | 39.8 | 20.6 | 7.4 | 60.8 | 20.4 | 2.1 | 54.5 | 27.3 | 1.2 | 55.8 | 23.2 | Cummings et al., GCN 10291 |
| 100111176 | GRB 100111A | 04:12:49.70 | 239.7 | 12.3 | 12.3 | 239.7 | 12.3 | 12.3 | 239.9 | 12.0 | 4.3 | 246.0 | 16.0 | 3.9 | 247. | 15.5 | Krimm et al., GCN 10322 |
| Burst Name | Common Name | Trigger Time | FSW for Ref. | FSW for Ref. | Ground Auto for Ref. | H.i.t.L for Ref. | Ref. Location | Reference | |||||||||
|---|---|---|---|---|---|---|---|---|---|---|---|---|---|---|---|---|---|
| (UT) | (RA | Dec | Err) | (RA | Dec | Err) | (RA | Dec | Err) | (RA | Dec | Err) | (RA | Dec) | |||
| 100116897 | GRB 100116A | 21:31:00.25 | 300.0 | 12.3 | 13.5 | 300.0 | 12.3 | 13.5 | 307.0 | 26.0 | 3.1 | 308.4 | 22.7 | 1.2 | 305.0 | 14.5 | McEnery et al., GCN 10333 |
| 100117879 | GRB 100117A | 21:06:19.67 | 6.1 | -6.2 | 11.9 | 6.1 | -6.2 | 11.9 | 9.9 | 8.3 | 5.7 | 11.2 | 9.0 | 5.8 | 11.3 | -1.6 | Markwardt et al., GCN 10338 |
| 100206563 | GRB 100206A | 13:30:05.40 | 44.7 | 17.6 | 11.5 | 44.7 | 17.6 | 11.5 | 74.6 | 22.7 | 3.0 | 63.9 | 13.9 | 4.5 | 47.2 | 13.2 | Sakamoto et al., GCN 10379 |
| 100212588 | GRB 100212A | 14:07:22.30 | 7.3 | 48.7 | 10.6 | 7.3 | 48.7 | 10.6 | 4.7 | 45.5 | 4.8 | 2.9 | 44.8 | 4.3 | 356.4 | 49.5 | Ukwatta et al., GCN 10404 |
| 100216422 | GRB 100216A | 10:07:00.19 | 148.9 | 46.4 | 17.0 | 148.9 | 46.4 | 17.0 | 157.7 | 49.0 | 7.6 | 155.5 | 47.4 | 8.7 | 154.3 | 35.5 | Cummings et al., GCN 10428 |
| 100225115 | GRB 100225A | 02:45:31.15 | 310.2 | -60.7 | 21.3 | 302.3 | -67.9 | 10.4 | 319.8 | -56.3 | 4.5 | 312.4 | -54.7 | 3.3 | 310.3 | -59.4 | Piron et al., GCN 10450 |
| 100325275 | GRB 100325A | 06:36:08.03 | 327.2 | -23.9 | 6.5 | 327.2 | -23.9 | 6.9 | 329.1 | -27.3 | 1.7 | 331.3 | -28.1 | 2.0 | 330.2 | -26.5 | de Palma et al., GCN 10548 |
| 100401297 | GRB 100401A | 07:07:32.25 | 284.6 | -25.8 | 19.0 | 284.6 | -25.8 | 19.0 | 282.8 | -26.9 | 9.5 | 290.0 | -16.3 | 7.9 | 290.8 | -8.3 | Cummings et al., GCN 10567 |
| 100413732 | GRB 100413A | 17:33:31.93 | 237.9 | -7.6 | 25.6 | 237.9 | -7.6 | 25.6 | 245.9 | -1.4 | 18.0 | 273.3 | 17.2 | 5.4 | 266.2 | 15.8 | Stamatikos et al., GCN 10585 |
| 100414097 | GRB 100414A | 02:20:21.99 | 183.6 | 20.5 | 11.2 | 186.2 | 15.4 | 4.2 | 194.0 | 9.8 | 1.1 | 185.7 | 15.7 | 1.0 | 192.1 | 8.7 | Page et al., GCN 10601 |
| 100427356 | GRB 100427A | 08:32:08.71 | 95.3 | -4.0 | 10.2 | 95.4 | -3.9 | 7.8 | 94.5 | -3.5 | 3.4 | 91.0 | -1.4 | 2.6 | 89.2 | -3.5 | Cummings et al., GCN 10699 |
| 100504806 | GRB 100504A | 19:20:55.54 | 250.4 | -18.3 | 28.0 | 250.9 | -33.6 | 20.3 | 246.2 | -31.7 | 10.4 | 254.8 | -34.7 | 5.1 | 255.6 | -35.6 | Palmer et al., GCN 10716 |
| 100510810 | GRB 100510A | 19:27:06.97 | 74.5 | -35.8 | 15.6 | 345.1 | -20.0 | 18.4 | 30.1 | -28.6 | 20.6 | 347.1 | -21.1 | 4.2 | 355.8 | -35.6 | Morii et al., GCN 10739 |
| 100522157 | GRB 100522A | 03:45:52.30 | 10.2 | 10.2 | 5.6 | 10.2 | 10.2 | 5.6 | 13.1 | 11.5 | 1.8 | 8.0 | 10.5 | 3.9 | 7.0 | 9.4 | Barthelmy et al., GCN 10788 |
| 100528075 | GRB 100528A | 01:48:01.11 | 315.5 | 37.8 | 15.5 | 307.1 | 30.1 | 5.4 | 326.8 | 34.3 | 1.0 | 310.7 | 26.8 | 1.2 | 311.1 | 27.8 | Del Monte et al., GCN 10810 |
| 100615083 | GRB 100615A | 01:59:04.38 | 165.4 | -23.7 | 7.4 | 165.5 | -23.7 | 7.6 | 176.7 | -20.6 | 3.8 | 175.6 | -21.1 | 2.4 | 177.2 | -19.5 | Palmer et al., GCN 10850 |
| 100619015 | GRB 100619A | 00:21:07.03 | 81.3 | -20.2 | 16.5 | 86.6 | -22.3 | 9.9 | 86.3 | -25.3 | 4.2 | 84.0 | -25.5 | 6.6 | 84.6 | -27.0 | Stamatikos et al., GCN 10864 |
| 100625773 | GRB 100625A | 18:32:28.48 | 16.3 | -50.0 | 4.8 | 16.3 | -50.0 | 4.8 | 21.9 | -38.1 | 2.6 | 21.9 | -38.1 | 3.9 | 15.8 | -39.1 | Barthelmy et al., GCN 10891 |
| 100701490 | GRB 100701B | 11:45:23.07 | 13.4 | -35.3 | 4.9 | 19.1 | -33.1 | 3.8 | 45.1 | 2.6 | 2.3 | 47.2 | -3.5 | 1.1 | 43.1 | -2.2 | Golenetskii et al., GCN 10938 |
| 100704149 | GRB 100704A | 03:35:06.11 | 139.6 | -23.5 | 11.2 | 152.4 | -12.2 | 6.4 | 136.6 | -19.7 | 2.2 | 133.2 | -23.6 | 1.6 | 133.6 | -24.2 | Cummings et al., GCN 10932 |
| 100724029 | GRB 100724A | 00:42:06.00 | 154.4 | 84.5 | 16.2 | 131.6 | 85.0 | 4.4 | 128.8 | 70.9 | 1.2 | 116.8 | 73.5 | 1.0 | 120.0 | 76.7 | Tanaka et al., GCN 10978 |
| 100725475 | GRB 100725B | 11:24:34.90 | 297.1 | 74.3 | 17.0 | 248.4 | 76.2 | 10.0 | 285.4 | 77.6 | 2.3 | 280.5 | 73.5 | 2.2 | 290.0 | 77.0 | Sakamoto et al., GCN 10993 |
| 100727238 | GRB 100727A | 05:42:22.00 | 142.6 | -10.1 | 34.6 | 142.6 | -10.1 | 34.6 | 142.6 | -8.2 | 12.2 | 154.6 | -9.8 | 11.1 | 154.2 | -21.4 | Stamatikos et al., GCN 11001 |
| 100728095 | GRB 100728A | 02:17:30.62 | 77.1 | -14.3 | 35.1 | 78.1 | -23.4 | 8.6 | 91.3 | -16.9 | 1.7 | 88.3 | -13.7 | 1.0 | 88.8 | -15.3 | Ukwatta et al., GCN 11018 |
| 100728439 | GRB 100728B | 10:31:54.98 | 55.3 | 0.3 | 12.9 | 51.6 | 3.2 | 9.5 | 42.5 | 2.1 | 4.9 | 41.5 | 0.2 | 4.2 | 44.1 | 0.3 | Barthelmy et al., GCN 11023 |
| 100802240 | GRB 100802A | 05:45:35.68 | 5.2 | 43.0 | 18.0 | 5.2 | 43.0 | 18.0 | 0.7 | 44.9 | 7.8 | 4.6 | 43.9 | 6.8 | 2.5 | 47.8 | Baumgartner et al., GCN 11035 |
| 100814160 | GRB 100814A | 03:50:08.81 | 25.1 | -1.2 | 12.0 | 19.1 | -10.4 | 7.5 | 20.0 | -16.4 | 3.4 | 19.8 | -15.4 | 2.5 | 22.5 | -18.0 | Krimm et al., GCN 11094 |
| 100816026 | GRB 100816A | 00:37:50.95 | - | - | - | 90.3 | -23.0 | 11.1 | 347.5 | 25.4 | 2.2 | 346.4 | 25.5 | 1.9 | 351.7 | 26.6 | Markwardt et al., GCN 11111 |
| 100906576 | GRB 100906A | 13:49:27.63 | 129.7 | 53.3 | 4.2 | 30.3 | 51.9 | 5.6 | 27.3 | 57.1 | 1.6 | 28.0 | 55.2 | 1.1 | 28.7 | 55.6 | Barthelmy et al., GCN 11233 |
| 100915243 | GRB 100915B | 05:49:39.62 | 84.7 | 22.9 | 25.4 | 84.7 | 22.9 | 25.4 | 86.8 | 18.3 | 16.4 | 86.8 | 18.3 | 12.7 | 85.4 | 25.1 | Mereghetti et al., GCN 11278 |
| 100924165 | GRB 100924A | 03:58:08.32 | 3.5 | 28.2 | 9.9 | 3.5 | 28.2 | 9.9 | 7.2 | 8.7 | 4.0 | 6.9 | 9.7 | 4.0 | 0.7 | 7.0 | Barthelmy et al., GCN 11295 |
| 101008697 | GRB 101008A | 16:43:15.61 | 324.8 | 34.0 | 13.2 | 324.8 | 34.0 | 13.2 | 335.0 | 31.7 | 8.6 | 326.9 | 36.7 | 8.5 | 328.9 | 37.1 | Barthelmy et al., GCN 11327 |
| 101011707 | GRB 101011A | 16:58:36.54 | 17.7 | -78.2 | 9.7 | 17.7 | -78.2 | 9.7 | 31.1 | -61.7 | 11.3 | 33.4 | -75.9 | 6.4 | 48.3 | -66.0 | Markwardt et al., GCN 11332 |
| 101023951 | GRB 101023A | 22:50:04.73 | 15.5 | -67.7 | 22.4 | 354.7 | -60.6 | 3.7 | 320.6 | -67.3 | 1.0 | 315.5 | -66.5 | 1.0 | 318.0 | -65.4 | Stamatikos et al., GCN 11367 |
| 101024486 | GRB 101024A | 11:39:33.61 | 157.5 | -70.9 | 19.2 | 157.5 | -70.9 | 19.2 | 144.5 | -84.0 | 6.5 | 147.1 | -77.2 | 9.6 | 66.5 | -77.3 | Ukwatta et al., GCN 11374 |
| 101030664 | GRB 101030A | 15:56:30.72 | 177.1 | -35.3 | 31.3 | 177.1 | -35.3 | 31.3 | 166.9 | -23.1 | 21.7 | 169.5 | -16.0 | 7.4 | 166.4 | -16.4 | Barthelmy et al., GCN 11388 |
| 101112924 | GRB 101112A | 22:10:32.45 | 299.7 | 42.8 | 8.2 | 299.7 | 42.8 | 8.2 | 300.5 | 39.8 | 3.5 | 299.3 | 39.4 | 4.2 | 292.2 | 39.3 | Gotz et al., GCN 11396 |
| 101201418 | GRB 101201A | 10:01:49.75 | 1.6 | -2.4 | 14.4 | 358.2 | -6.2 | 7.2 | 0.3 | -15.3 | 2.7 | 3.9 | -14.7 | 1.6 | 1.9 | -16.1 | Cummings et al., GCN 11429 |
| 101213451 | GRB 101213A | 10:49:20.80 | 246.9 | 10.9 | 19.6 | 237.7 | 19.3 | 11.1 | 238.7 | 16.8 | 6.1 | 247.3 | 21.2 | 3.6 | 241.3 | 21.9 | Cummings et al., GCN 11453 |
| 101219686 | GRB 101219B | 16:28:13.13 | 9.3 | -39.2 | 23.8 | 9.3 | -39.2 | 23.8 | 17.2 | -31.0 | 8.4 | 11.1 | -31.1 | 3.4 | 12.3 | -34.6 | Cummings et al., GCN 11475 |
| 101224227 | GRB 101224A | 05:27:13.87 | 303.9 | 1.6 | 21.6 | 303.9 | 1.6 | 21.6 | 306.8 | 27.2 | 18.7 | 300.3 | 40.4 | 13.5 | 285.9 | 45.7 | Markwardt et al., GCN 11486 |
| 110102788 | GRB 110102A | 18:54:36.01 | 249.3 | -3.5 | 10.1 | 249.2 | -3.7 | 5.6 | 245.2 | 5.5 | 1.7 | 246.2 | 6.0 | 2.0 | 245.9 | 7.6 | Sakamoto et al., GCN 11511 |
| 110106893 | GRB 110106B | 21:26:16.08 | 197.9 | 31.8 | 27.3 | 197.9 | 31.8 | 27.3 | 171.3 | 37.7 | 10.0 | 155.3 | 38.6 | 9.3 | 134.2 | 47.0 | Ukwatta et al., GCN 11533 |
| Burst Name | Common Name | Trigger Time | FSW for Ref. | FSW for Ref. | Ground Auto for Ref. | H.i.t.L for Ref. | Ref. Location | Reference | |||||||||
|---|---|---|---|---|---|---|---|---|---|---|---|---|---|---|---|---|---|
| (UT) | (RA | Dec | Err) | (RA | Dec | Err) | (RA | Dec | Err) | (RA | Dec | Err) | (RA | Dec) | |||
| 110112934 | GRB 110112B | 22:24:55.30 | 21.6 | 44.5 | 9.7 | 21.6 | 44.5 | 9.7 | 25.8 | 42.8 | 5.8 | 25.9 | 44.0 | 4.7 | 10.6 | 64.4 | Mereghetti et al., GCN 11562 |
| 110119931 | GRB 110119A | 22:21:00.17 | - | - | - | 359.6 | -1.6 | 9.8 | 349.6 | 6.0 | 4.4 | 345.4 | 8.0 | 2.5 | 348.6 | 6.0 | Baumgartner et al., GCN 11584 |
| 110120666 | GRB 110120A | 15:59:39.23 | 65.1 | -22.6 | 5.3 | 65.6 | -23.0 | 4.9 | 65.7 | -18.3 | 1.0 | 64.8 | -16.8 | 1.1 | 61.6 | -12.0 | Omodei et al., GCN 11597 |
| 110128073 | GRB 110128A | 01:44:36.44 | 207.5 | 7.3 | 27.5 | 207.5 | 7.3 | 27.5 | 202.7 | 22.3 | 14.0 | 204.4 | 19.7 | 11.4 | 193.9 | 28.1 | Cummings et al., GCN 11614 |
| 110201399 | GRB 110201A | 09:35:10.26 | 177.3 | 59.8 | 11.3 | 177.3 | 59.8 | 11.3 | 164.8 | 84.4 | 6.5 | 166.3 | 87.4 | 4.6 | 137.6 | 88.6 | Krimm et al., GCN 11624 |
| 110207470 | GRB 110207A | 11:17:20.29 | 14.3 | -12.3 | 13.4 | 14.3 | -12.3 | 13.4 | 359.5 | 4.7 | 13.4 | 15.7 | -10.0 | 5.5 | 12.5 | -10.8 | Palmer et al., GCN 11664 |
| 110213220 | GRB 110213A | 05:17:11.28 | 46.0 | 49.3 | 28.9 | 39.2 | 39.3 | 7.2 | 49.2 | 52.5 | 2.6 | 49.0 | 52.8 | 2.3 | 43.0 | 49.3 | Barthelmy et al., GCN 11714 |
| 110318552 | GRB 110318A | 13:14:16.71 | 327.6 | -35.1 | 30.0 | 343.7 | -27.8 | 5.9 | 336.3 | -16.4 | 2.6 | 335.9 | -14.9 | 1.9 | 338.3 | -15.3 | Barthelmy et al., GCN 11802 |
| 110402009 | GRB 110402A | 00:12:58.55 | 189.0 | 65.0 | 19.8 | 182.1 | 54.5 | 4.5 | 190.2 | 57.2 | 4.1 | 187.7 | 58.7 | 2.2 | 197.4 | 61.3 | Stamatikos et al., GCN 11866 |
| 110412315 | GRB 110412A | 07:33:35.71 | 110.5 | 21.3 | 28.4 | 130.4 | 14.4 | 14.6 | 114.6 | 16.6 | 7.9 | 135.9 | 11.4 | 3.8 | 133.5 | 13.5 | Baumgartner et al., GCN 11929 |
| 110420946 | GRB 110420B | 22:42:11.74 | 311.3 | -44.9 | 16.6 | 311.3 | -44.9 | 16.6 | 350.0 | -28.8 | 26.7 | 326.4 | -39.3 | 12.2 | 320.1 | -41.3 | Markwardt et al., GCN 11946 |
| 110428388 | GRB 110428A | 09:18:30.41 | - | - | - | 128.9 | 12.8 | 6.1 | 0.5 | 62.4 | 1.0 | 2.1 | 61.7 | 1.0 | 5.3 | 64.8 | Vasileiou et al., GCN 11982 |
| 110610640 | GRB 110610A | 15:21:32.55 | 313.8 | 76.6 | 17.4 | 317.2 | 78.9 | 6.4 | 310.0 | 77.6 | 2.3 | 306.5 | 75.9 | 2.6 | 308.2 | 74.8 | Marshall et al., GCN 12065 |
| 110625881 | GRB 110625A | 21:08:18.24 | 298.0 | 6.7 | 14.1 | 348.4 | 54.6 | 3.4 | 287.8 | 6.9 | 1.0 | 287.7 | 6.7 | 1.0 | 286.8 | 6.8 | Page et al., GCN 12088 |
| 110709642 | GRB 110709A | 15:24:27.37 | 239.9 | 44.6 | 5.4 | 239.9 | 44.6 | 5.2 | 240.4 | 39.9 | 1.5 | 241.2 | 41.8 | 1.1 | 238.9 | 40.9 | Holland et al., GCN 12118 |
| 110721200 | GRB 110721A | 04:47:43.77 | 327.6 | -37.9 | 3.9 | 323.6 | -33.4 | 3.8 | 331.4 | -36.6 | 1.0 | 331.4 | -36.6 | 1.0 | 333.4 | -39.0 | Vasileiou et al., GCN 12188 |
| 110731465 | GRB 110731A | 11:09:29.96 | 281.8 | -38.9 | 4.3 | 282.0 | -39.0 | 4.4 | 281.1 | -26.6 | 3.4 | 283.1 | -34.0 | 1.0 | 280.5 | -28.5 | Oates et al., GCN 12215 |
| 110818860 | GRB 110818A | 20:37:54.23 | 140.4 | -73.3 | 28.4 | 140.4 | -73.3 | 28.4 | 338.4 | -55.7 | 10.0 | 329.6 | -54.1 | 4.1 | 317.4 | -64.0 | Markwardt et al., GCN 12279 |
| 110825102 | GRB 110825A | 02:26:50.94 | 42.4 | 6.5 | 26.9 | 48.8 | 17.3 | 3.7 | 47.1 | 14.6 | 1.0 | 47.1 | 14.6 | 1.0 | 44.8 | 15.4 | Zhang et al., GCN 12308 |
| 110903111 | GRB 110903A | 02:39:34.43 | 195.7 | 63.3 | 8.8 | 208.1 | 65.5 | 6.5 | 199.1 | 52.7 | 3.8 | 196.0 | 51.8 | 2.6 | 197.1 | 59.0 | Mereghetti et al., GCN 12322 |
| 110921577 | GRB 110921A | 13:51:22.58 | 296.6 | 47.9 | 18.5 | 296.6 | 47.9 | 18.5 | 297.1 | 41.9 | 6.2 | 297.9 | 33.7 | 3.9 | 294.1 | 36.4 | Baumgartner et al., GCN 12373 |
| 111103441 | GRB 111103A | 10:35:13.40 | 330.7 | -3.6 | 9.1 | 330.7 | -3.6 | 9.1 | 331.2 | -9.7 | 4.1 | 327.0 | -10.0 | 1.8 | 327.1 | -10.5 | Stroh et al., GCN 12518 |
| 111107035 | GRB 111107A | 00:50:25.49 | 152.3 | -63.3 | 17.9 | 152.3 | -63.3 | 17.9 | 141.6 | -65.3 | 5.7 | 149.0 | -66.0 | 6.0 | 129.5 | -66.5 | Siegel et al., GCN 12534 |
| 111117510 | GRB 111117A | 12:13:42.03 | 13.2 | 26.8 | 4.8 | 13.2 | 26.8 | 4.8 | 14.4 | 24.0 | 3.1 | 13.8 | 26.0 | 3.1 | 12.7 | 23.0 | Mangano et al., GCN 12559 |
| 111222619 | GRB 111222A | 14:51:55.03 | 207.6 | 59.1 | 3.4 | 207.6 | 59.1 | 3.4 | 189.6 | 65.8 | 3.1 | 173.4 | 65.2 | 1.7 | 179.2 | 69.0 | Hurley et al., GCN 12714 |
| 111228657 | GRB 111228A | 15:45:30.81 | 148.5 | 22.2 | 6.7 | 148.5 | 22.2 | 6.7 | 147.3 | 15.2 | 2.4 | 146.6 | 14.6 | 2.4 | 150.1 | 18.3 | Guver, GCN 12741 |
| 120102095 | GRB 120102A | 02:16:23.24 | 281.8 | 19.6 | 12.4 | 286.4 | 16.5 | 5.2 | 272.6 | 17.4 | 5.3 | 277.1 | 20.4 | 2.0 | 276.2 | 24.7 | Marshall et al., GCN 12794 |
| 120114681 | GRB 120114A | 16:20:05.68 | 307.7 | 58.3 | 14.3 | 307.7 | 58.3 | 14.3 | 311.7 | 49.6 | 7.9 | 311.0 | 52.1 | 5.4 | 317.9 | 57.0 | Sakamoto et al., GCN 12833 |
| 120118709 | GRB 120118B | 17:00:22.95 | 115.3 | -24.9 | 29.4 | 115.3 | -24.9 | 29.4 | 128.6 | -13.9 | 13.3 | 131.2 | -9.6 | 8.2 | 124.9 | -7.2 | Littlejohns et al., GCN 12852 |
| 120119170 | GRB 120119A | 04:04:25.07 | 113.6 | -4.9 | 5.9 | 113.5 | -4.8 | 4.5 | 119.2 | -7.0 | 1.3 | 119.0 | -9.0 | 1.1 | 120.0 | -9.1 | Beardmore et al., GCN 859 |
| 120212383 | GRB 120212A | 09:11:23.50 | 40.8 | -13.2 | 21.8 | 40.8 | -13.2 | 21.8 | 26.9 | -22.5 | 10.3 | 32.9 | -15.1 | 10.0 | 43.1 | -18.0 | Sonbas et al., GCN 12930 |
| 120302080 | GRB 120302A | 01:55:34.01 | 146.8 | 31.1 | 26.1 | 146.8 | 31.1 | 26.1 | 148.3 | 22.4 | 18.0 | 147.0 | 25.2 | 7.7 | 122.5 | 29.7 | Sakamoto et al., GCN 13000 |
| 120312671 | GRB 120312A | 16:06:29.67 | 261.9 | -6.4 | 18.8 | 261.9 | -6.4 | 18.8 | 259.4 | -2.3 | 8.7 | 254.3 | 11.5 | 7.8 | 251.8 | 23.9 | Stamatikos et al., GCN 13049 |
| 120323507 | GRB 120323A | 12:10:19.73 | 335.3 | 35.6 | 3.3 | 335.3 | 35.6 | 3.3 | 345.8 | 26.5 | 1.0 | 345.8 | 26.5 | 1.0 | 340.4 | 29.7 | Golenetskii et al., GCN 13102 |
| 120326056 | GRB 120326A | 01:20:31.52 | 255.8 | 68.0 | 11.9 | 243.6 | 70.7 | 8.8 | 274.1 | 64.8 | 5.3 | 262.2 | 62.1 | 4.2 | 273.9 | 69.3 | Siegel et al., GCN 13105 |
| 120403857 | GRB 120403B | 20:33:58.50 | 291.5 | -82.9 | 21.3 | 291.5 | -82.9 | 21.3 | 268.8 | -76.9 | 11.2 | 241.5 | -80.4 | 12.5 | 55.3 | -89.0 | Goad et al., GCN 13205 |
| 120512112 | GRB 120512A | 02:41:44.34 | 324.4 | 17.1 | 14.0 | 327.5 | 11.8 | 6.6 | 326.3 | 13.3 | 1.2 | 324.7 | 14.7 | 1.8 | 325.6 | 13.6 | Mereghetti et al., GCN 13300 |
| 120521380 | GRB 120521B | 09:07:52.39 | 167.1 | -45.7 | 21.0 | 216.0 | -48.2 | 25.9 | 192.7 | -38.8 | 10.9 | 208.1 | -47.1 | 5.2 | 197.0 | -52.7 | Cummings et al., GCN 13305 |
| 120624309 | GRB 120624A | 07:24:25.34 | 314.0 | 60.3 | 3.3 | 314.0 | 60.3 | 3.3 | 0.7 | -6.3 | 1.2 | 0.7 | -6.3 | 1.2 | 4.8 | 7.2 | Golenetskii et al., GCN 13376 |
| 120624933 | GRB 120624B | 22:23:54.94 | 178.2 | 47.1 | 22.0 | 174.3 | 22.5 | 4.2 | 171.9 | 5.7 | 1.2 | 171.8 | 5.6 | 1.0 | 170.9 | 8.9 | Sakamoto et al., GCN 13384 |
| 120703726 | GRB 120703A | 17:25:17.04 | 325.3 | -32.6 | 17.6 | 345.2 | -27.8 | 4.4 | 340.2 | -29.1 | 1.6 | 339.8 | -29.5 | 1.7 | 339.4 | -29.7 | Stamatikos et al., GCN 13414 |
| 120709883 | GRB 120709A | 21:11:40.37 | 338.5 | -57.8 | 6.0 | 319.8 | -68.0 | 5.0 | 327.0 | -52.2 | 1.1 | 319.9 | -50.0 | 1.6 | 318.4 | -50.0 | Kocevski et al., GCN 13423 |
| 120711115 | GRB 120711A | 02:44:53.30 | 69.6 | -62.9 | 8.5 | 56.5 | -63.7 | 5.7 | 77.2 | -66.3 | 1.0 | 79.4 | -66.6 | 1.0 | 94.7 | -71.0 | Gotz et al., GCN 13434 |
| Burst Name | Common Name | Trigger Time | FSW for Ref. | FSW for Ref. | Ground Auto for Ref. | H.i.t.L for Ref. | Ref. Location | Reference | |||||||||
|---|---|---|---|---|---|---|---|---|---|---|---|---|---|---|---|---|---|
| (UT) | (RA | Dec | Err) | (RA | Dec | Err) | (RA | Dec | Err) | (RA | Dec | Err) | (RA | Dec) | |||
| 120712571 | GRB 120712A | 13:42:25.61 | 175.4 | -23.2 | 11.8 | 165.7 | -28.0 | 8.6 | 172.0 | -20.8 | 3.7 | 175.2 | -19.8 | 1.9 | 169.6 | -20.1 | Barthelmy et al., GCN 13455 |
| 120728934 | GRB 120728A | 22:25:12.74 | 167.1 | -45.7 | 21.0 | 167.1 | -45.7 | 21.0 | 131.5 | -57.0 | 6.8 | 138.2 | -54.0 | 6.2 | 137.1 | -54.4 | Cummings et al., GCN 13525 |
| 120729456 | GRB 120729A | 10:56:12.67 | - | - | - | 16.5 | 51.5 | 10.8 | 17.5 | 60.2 | 2.4 | 17.0 | 49.2 | 3.0 | 13.1 | 49.9 | Ukwatta et al., GCN 13530 |
| 120811649 | GRB 120811C | 15:34:55.09 | 215.3 | 56.6 | 20.4 | 215.3 | 56.4 | 17.2 | 225.9 | 50.1 | 10.8 | 214.4 | 55.8 | 5.3 | 199.7 | 62.3 | Barlow et al., GCN 13622 |
| 120817168 | GRB 120817B | 04:02:29.72 | - | - | - | 233.5 | -38.2 | 3.3 | 12.5 | -21.6 | 4.6 | 12.3 | -23.8 | 3.9 | 8.3 | -26.5 | Golenetskii et al., GCN 13670 |
| 120907017 | GRB 120907A | 00:24:24.51 | 80.9 | 0.6 | 14.6 | 80.9 | 0.6 | 14.6 | 77.3 | -2.5 | 12.0 | 74.1 | -8.5 | 11.7 | 74.7 | -9.3 | Racusin et al., GCN 13716 |
| 120908938 | GRB 120908A | 22:31:00.02 | 238.5 | -26.3 | 12.0 | 231.6 | -28.7 | 26.5 | 239.4 | -17.3 | 7.5 | 233.3 | -21.1 | 4.0 | 230.6 | -25.8 | Morii et al., GCN 13731 |
| 120909070 | GRB 120909A | 01:41:22.40 | 281.1 | -51.3 | 15.4 | 284.7 | -56.5 | 11.7 | 275.2 | -64.7 | 5.1 | 280.0 | -59.4 | 3.3 | 275.7 | -59.4 | Osborne et al., GCN 13732 |
| 120911298 | GRB 120911A | 07:08:33.99 | 336.9 | 61.6 | 19.7 | 336.9 | 61.6 | 19.7 | 355.1 | 62.6 | 6.8 | 351.8 | 61.5 | 4.3 | 358.0 | 63.1 | Cannizzo et al., GCN 13744 |
| 120913846 | GRB 120913A | 20:18:22.89 | 140.0 | 21.0 | 33.6 | 140.0 | 21.0 | 33.6 | 142.0 | 20.7 | 11.8 | 132.6 | 31.7 | 10.7 | 146.4 | 27.0 | Helder et al., GCN 13762 |
| 120913997 | GRB 120913B | 23:55:58.77 | 234.7 | -7.0 | 19.8 | 218.9 | 24.6 | 13.5 | 215.4 | -14.2 | 4.4 | 214.8 | -16.6 | 1.5 | 213.6 | -14.5 | Helder et al., GCN 13763 |
| 120916173 | GRB 120916A | 04:08:40.75 | 201.7 | 34.3 | 13.4 | 201.7 | 34.3 | 13.4 | 196.0 | 32.9 | 6.0 | 209.7 | 39.6 | 1.7 | 205.8 | 36.7 | Vianello et al., GCN 13777 |
| 120922939 | GRB 120922A | 22:32:09.47 | 308.3 | -41.7 | 21.0 | 308.3 | -41.7 | 21.0 | 231.1 | -20.6 | 10.8 | 235.1 | -23.9 | 7.1 | 234.8 | -20.2 | Yershov et al., GCN 13793 |
| 121011469 | GRB 121011A | 11:15:25.70 | 215.5 | 73.1 | 25.8 | 277.3 | 45.9 | 11.4 | 261.2 | 44.2 | 5.7 | 261.1 | 39.5 | 3.6 | 260.2 | 41.1 | Racusin et al., GCN 13845 |
| 121031949 | GRB 121031A | 22:47:15.27 | 184.0 | -6.8 | 26.2 | 176.4 | 6.3 | 11.7 | 162.9 | -10.3 | 5.7 | 173.1 | -1.9 | 3.4 | 170.8 | -3.5 | D’Elia et al., GCN 13934 |
| 121123421 | GRB 121123A | 10:06:00.59 | 316.9 | -27.7 | 25.0 | 307.3 | -8.9 | 8.8 | 306.7 | -14.0 | 5.2 | 307.8 | -14.5 | 1.7 | 307.4 | -11.9 | Helder et al., GCN 13982 |
| 121125356 | GRB 121125A | 08:32:29.63 | 203.7 | 43.0 | 19.6 | 209.9 | 53.4 | 13.2 | 235.7 | 57.1 | 3.4 | 229.1 | 55.0 | 1.9 | 228.5 | 55.3 | Barlow et al., GCN 13993 |
| 121128212 | GRB 121128A | 05:05:50.96 | 278.7 | 28.7 | 16.7 | 278.3 | 33.6 | 5.7 | 272.6 | 38.9 | 2.2 | 278.8 | 41.6 | 1.5 | 300.6 | 54.3 | Oates et al., GCN 14007 |
| 121202181 | GRB 121202A | 04:20:09.17 | 257.9 | 30.4 | 34.9 | 257.9 | 30.4 | 34.9 | 249.7 | 41.8 | 11.6 | 246.5 | 24.4 | 5.8 | 256.8 | 24.0 | Oates et al., GCN 14032 |
| 121211574 | GRB 121211A | 13:47:03.59 | 190.0 | 46.7 | 15.7 | 190.0 | 46.7 | 15.7 | 208.4 | 35.6 | 10.6 | 206.2 | 30.0 | 11.7 | 195.5 | 30.2 | Mangano et al., GCN 14057 |
| 121217313 | GRB 121217A | 07:30:01.58 | 178.1 | -75.3 | 17.6 | 157.6 | -70.8 | 15.9 | 149.5 | -51.5 | 19.6 | 160.1 | -68.7 | 5.2 | 153.7 | -62.3 | Siegel et al., GCN 14089 |
| 130206817 | GRB 130206A | 19:36:30.45 | 149.4 | -58.5 | 17.6 | 149.4 | -58.5 | 17.6 | 0.9 | 20.4 | 50.5 | 140.4 | -60.5 | 4.5 | 140.4 | -58.2 | De Pasquale et al., GCN 14181 |
| 130215063 | GRB 130215A | 01:31:26.02 | 37.7 | 35.9 | 14.3 | 37.7 | 35.9 | 14.3 | 37.6 | 18.7 | 4.7 | 38.5 | 17.0 | 2.1 | 43.5 | 13.4 | D’Elia et al., GCN 14204 |
| 130216790 | GRB 130216B | 18:58:11.70 | 66.1 | -2.2 | 9.4 | 64.0 | 7.7 | 6.8 | 60.4 | 4.0 | 3.0 | 61.7 | 3.5 | 2.3 | 58.9 | 2.0 | Cummings et al., GCN 14232 |
| 130216927 | GRB 130216A | 22:15:21.42 | 68.1 | 16.1 | 8.5 | 64.8 | 20.2 | 7.2 | 69.4 | 16.3 | 1.7 | 69.4 | 16.3 | 1.5 | 67.9 | 14.7 | Melandri et al., GCN 14223 |
| 130305486 | GRB 130305A | 11:39:11.37 | 110.0 | 48.1 | 4.2 | 110.6 | 48.0 | 10.0 | 120.1 | 50.1 | 1.0 | 119.7 | 49.0 | 1.0 | 116.8 | 52.0 | Cummings et al., GCN 14257 |
| 130306991 | GRB 130306A | 23:47:25.57 | 279.0 | -12.6 | 50.0 | 279.0 | -12.6 | 50.0 | 278.0 | -12.6 | 1.0 | 276.9 | -11.5 | 1.0 | 279.5 | -11.7 | Barthelmy et al., GCN 14279 |
| 130310840 | GRB 130310A | 20:09:41.50 | 154.8 | -21.4 | 26.8 | 127.3 | 1.4 | 3.4 | 158.2 | -25.2 | 14.3 | 142.0 | -22.0 | 1.6 | 142.3 | -17.2 | Guiriec et al., GCN 14282 |
| 130325203 | GRB 130325A | 04:51:54.30 | 133.8 | -18.4 | 10.4 | 127.7 | -19.5 | 5.6 | 130.9 | -19.7 | 1.6 | 130.7 | -21.0 | 1.5 | 122.8 | -18.9 | Vianello et al., GCN 14332 |
| 130327350 | GRB 130327B | 08:24:04.05 | 218.9 | -67.2 | 7.2 | 219.4 | -67.1 | 4.8 | 208.0 | -74.8 | 2.1 | 207.6 | -72.3 | 1.0 | 218.1 | -69.5 | Ohno et al., GCN 14347 |
| 130420313 | GRB 130420A | 07:30:19.92 | 188.0 | 55.2 | 15.9 | 188.0 | 55.2 | 15.9 | 202.4 | 54.7 | 4.7 | 205.7 | 58.8 | 4.4 | 196.1 | 59.4 | Page et al., GCN 14406 |
| 130420539 | GRB 130420B | 12:56:32.99 | 176.4 | 56.5 | 28.9 | 176.4 | 56.5 | 28.9 | 184.1 | 53.0 | 15.0 | 184.8 | 51.0 | 6.2 | 183.1 | 54.4 | Oates et al., GCN 14411 |
| 130427324 | GRB 130427A | 07:47:06.42 | 170.6 | 47.7 | 3.4 | 170.7 | 48.1 | 3.2 | 169.9 | 24.3 | 1.0 | 172.5 | 25.5 | 1.0 | 173.1 | 27.7 | Maselli et al., GCN 14448 |
| 130502327 | GRB 130502B | 07:51:11.76 | 57.8 | 59.8 | 14.9 | 52.7 | 64.7 | 4.0 | 72.5 | 69.8 | 1.0 | 77.0 | 70.3 | 1.0 | 66.8 | 71.1 | Kocevski et al., GCN 14532 |
| 130502743 | GRB 130502A | 17:50:30.74 | 130.9 | 14.3 | 12.3 | 130.9 | 14.3 | 12.3 | 134.1 | 7.8 | 8.5 | 133.7 | -0.5 | 11.6 | 138.6 | -0.1 | Troja et al., GCN 14527 |
| 130504978 | GRB 130504C | 23:28:57.52 | 93.3 | 0.9 | 27.1 | 87.4 | 9.3 | 3.9 | 90.3 | 4.1 | 1.0 | 90.7 | 4.3 | 1.0 | 91.6 | 3.8 | Kocevski et al., GCN 14574 |
| 130515056 | GRB 130515A | 01:21:17.88 | 296.7 | -51.8 | 11.1 | 296.7 | -51.8 | 11.1 | 297.7 | -48.4 | 2.1 | 291.5 | -51.8 | 3.7 | 283.4 | -54.3 | Malesani et al., GCN 14650 |
| 130518580 | GRB 130518A | 13:54:37.53 | 354.7 | 43.7 | 10.3 | 354.5 | 44.2 | 3.8 | 356.3 | 47.1 | 1.0 | 356.3 | 47.0 | 1.0 | 355.7 | 47.5 | Cummings et al., GCN 14676 |
| 130528695 | GRB 130528A | 16:41:24.41 | 245.5 | 83.0 | 11.1 | 197.1 | 86.2 | 6.7 | 84.2 | 81.6 | 2.1 | 68.1 | 82.6 | 1.9 | 139.5 | 87.3 | D’Elia et al., GCN 14711 |
| 130606497 | GRB 130606B | 11:55:33.63 | 203.2 | 45.9 | 7.3 | 197.0 | 50.0 | 3.5 | 222.3 | -18.8 | 1.0 | 222.3 | -18.8 | 1.0 | 218.5 | -22.1 | Vianello et al., GCN 14795 |
| 130609129 | GRB 130609A | 03:05:10.69 | 146.4 | 15.2 | 16.0 | 146.4 | 15.2 | 16.0 | 150.3 | 28.3 | 12.7 | 148.3 | 26.7 | 8.0 | 152.7 | 24.1 | Cummings et al., GCN 14828 |
| 130609902 | GRB 130609B | 21:38:35.61 | 95.5 | -67.0 | 10.3 | 105.9 | -64.5 | 4.0 | 55.5 | -33.0 | 1.8 | 51.9 | -42.9 | 1.0 | 53.8 | -40.2 | Krimm et al., GCN 14841 |
| 130610133 | GRB 130610A | 03:12:10.50 | 217.8 | 29.0 | 23.9 | 223.4 | 27.0 | 11.9 | 216.7 | 28.0 | 5.8 | 226.5 | 29.3 | 3.5 | 224.4 | 28.2 | Cummings et al., GCN 14842 |
| Burst Name | Common Name | Trigger Time | IPN Annulus | FSW for IPN | FSW for IPN | Ground Auto for IPN | H.i.t.L. for IPN | |||||||||||
|---|---|---|---|---|---|---|---|---|---|---|---|---|---|---|---|---|---|---|
| (UT) | (RA | Dec | Err | Width)1 | (RA | Dec | Err) | (RA | Dec | Err) | (RA | Dec | Err) | (RA | Dec | Err) | ||
| 080715950 | GRB 080715A | 22:48:40.17 | 148.6 | 14.5 | 60.5 | 0.3 | - | - | - | - | - | - | 210.6 | 12.8 | 3.3 | 213.3 | 12.2 | 2.5 |
| 080723985 | GRB 080723D | 23:37:42.71 | 158.4 | 10.2 | 70.9 | 0.1 | - | - | - | - | - | - | 57.7 | 78.7 | 1.3 | 52.9 | 79.1 | 1.0 |
| 080724401 | GRB 080724A | 09:37:40.61 | - | - | - | - | - | - | - | - | - | - | 356.2 | 32.6 | 1.6 | 357.1 | 32.0 | 1.1 |
| 080730520 | GRB 080730A | 12:29:15.41 | - | - | - | - | - | - | - | - | - | - | 246.3 | 5.5 | 4.1 | 246.3 | 5.5 | 2.5 |
| 080730786 | GRB 080730B | 18:51:38.19 | 165.9 | 6.5 | 79.0 | 0.1 | - | - | - | - | - | - | 246.6 | 27.7 | 2.0 | 246.6 | 27.7 | 1.9 |
| 080802386 | GRB 080802A | 09:15:10.53 | - | - | - | - | - | - | - | - | - | - | 185.9 | 22.0 | 7.9 | 157.5 | 40.4 | 14.2 |
| 080803772 | GRB 080803A | 18:31:22.05 | 169.9 | 4.4 | 84.5 | 0.5 | - | - | - | - | - | - | 145.8 | 75.5 | 8.1 | 322.6 | 65.6 | 6.4 |
| 080806896 | GRB 080806B | 21:29:40.83 | 173.0 | 2.8 | 74.1 | 0.3 | - | - | - | - | - | - | 239.2 | 43.5 | 2.7 | 243.1 | 47.3 | 2.0 |
| 080807993 | GRB 080807A | 23:50:32.64 | - | - | - | - | - | - | - | - | - | - | 100.9 | -14.2 | 3.6 | 101.6 | -16.0 | 2.7 |
| 080816503 | GRB 080816A | 12:04:18.18 | 181.3 | -1.9 | 56.1 | 0.2 | - | - | - | - | - | - | 152.8 | 43.0 | 4.2 | 155.2 | 42.0 | 2.6 |
| 080816989 | GRB 080816B | 23:43:54.70 | 2.1 | 2.4 | 82.4 | 0.3 | - | - | - | - | - | - | 290.8 | -6.0 | 8.5 | 290.7 | -6.0 | 5.0 |
| 080817161 | GRB 080817A | 03:52:10.54 | 182.2 | -2.4 | 38.9 | 0.2 | - | - | - | - | - | - | 150.7 | -17.7 | 2.1 | 149.0 | -17.8 | 1.3 |
| 080817720 | GRB 080817B | 17:17:07.52 | 2.3 | 2.6 | 83.6 | 0.2 | - | - | - | - | - | - | 80.8 | -30.5 | 9.5 | 85.8 | -28.0 | 6.9 |
| 080821332 | GRB 080821A | 07:57:26.48 | 185.7 | -4.3 | 73.2 | 0.3 | - | - | - | - | - | - | 233.8 | 33.2 | 3.0 | 238.5 | 33.5 | 3.9 |
| 080824909 | GRB 080824A | 21:48:54.73 | - | - | - | - | - | - | - | - | - | - | 122.7 | -1.2 | 1.3 | 122.4 | -2.7 | 1.3 |
| 080825593 | GRB 080825C | 14:13:48.11 | 189.1 | -6.2 | 45.7 | 0.1 | - | - | - | - | - | - | 231.0 | -2.1 | 1.1 | 231.3 | -3.1 | 1.0 |
| 080830368 | GRB 080830A | 08:50:16.34 | 192.7 | -8.2 | 50.6 | 0.2 | - | - | - | - | - | - | 158.0 | 31.9 | 4.3 | 158.7 | 30.4 | 2.6 |
| 080906212 | GRB 080906B | 05:05:11.55 | 197.3 | -10.8 | 13.7 | 0.4 | - | - | - | - | - | - | 187.7 | -7.4 | 2.3 | 190.6 | -8.5 | 2.2 |
| 080925775 | GRB 080925A | 18:35:56.00 | 21.9 | 13.7 | 71.3 | 0.2 | - | - | - | - | - | - | 95.1 | 18.7 | 1.6 | 95.1 | 17.6 | 1.2 |
| 081003644 | GRB 081003C | 15:27:17.94 | - | - | - | - | - | - | - | - | - | - | 267.2 | 26.1 | 5.2 | 254.5 | 40.3 | 5.6 |
| 081009140 | GRB 081009A | 03:20:58.07 | 189.3 | -5.2 | 65.9 | 0.5 | 252.2 | 19.8 | 5.1 | 252.2 | 14.7 | 3.7 | 250.4 | 20.6 | 1.0 | 250.4 | 20.6 | 1.0 |
| 081009690 | GRB 081009B | 16:33:37.34 | 8.8 | 4.9 | 58.8 | 0.6 | 53.0 | 24.8 | 9.2 | 71.5 | 16.4 | 6.8 | 67.5 | 13.6 | 2.8 | 65.2 | 14.5 | 1.7 |
| 081021398 | GRB 081021A | 09:33:28.02 | 189.7 | -2.0 | 23.7 | 0.5 | 212.9 | -16.3 | 13.8 | 203.6 | -26.0 | 8.8 | 197.2 | -28.2 | 4.0 | 197.1 | -26.2 | 3.3 |
| 081101532 | GRB 081101B | 12:45:24.09 | 202.0 | -6.8 | 24.7 | 0.3 | 219.5 | -29.5 | 10.5 | 220.2 | -29.5 | 5.2 | 212.3 | -28.0 | 2.3 | 211.0 | -28.0 | 1.8 |
| 081102365 | GRB 081102B | 08:45:00.51 | 203.3 | -7.4 | 38.6 | 0.1 | 247.1 | 35.8 | 13.6 | 247.1 | 35.8 | 13.6 | 242.8 | 31.0 | 8.6 | 212.4 | 31.2 | 8.4 |
| 081110601 | GRB 081110A | 14:25:43.04 | 33.5 | 11.8 | 74.3 | 0.2 | 116.9 | 24.9 | 4.9 | 116.9 | 24.9 | 5.2 | 112.6 | 21.8 | 2.1 | 111.7 | 21.5 | 2.2 |
| 081122520 | GRB 081122A | 12:28:12.22 | - | - | - | - | 339.2 | 33.9 | 4.2 | 339.3 | 33.9 | 5.9 | 336.9 | 40.1 | 1.0 | 338.3 | 39.8 | 1.0 |
| 081125496 | GRB 081125A | 11:53:39.01 | 64.5 | 21.8 | 46.1 | 0.1 | 45.8 | -24.6 | 6.8 | 41.0 | -22.7 | 4.3 | 45.5 | -20.1 | 1.1 | 45.5 | -20.1 | 1.0 |
| 081129161 | GRB 081129A | 03:52:04.27 | - | - | - | - | 58.0 | -64.7 | 4.3 | 58.0 | -64.7 | 4.3 | 59.8 | -60.3 | 2.6 | 60.9 | -56.3 | 3.4 |
| 081207680 | GRB 081207A | 16:18:46.94 | - | - | - | - | 106.4 | 75.0 | 12.9 | 123.4 | 66.0 | 6.5 | 110.2 | 70.2 | 1.9 | 114.0 | 69.6 | 1.6 |
| 081215784 | GRB 081215A | 18:48:36.85 | 78.7 | 17.7 | 51.6 | 0.5 | 10.6 | 44.1 | 3.4 | 10.6 | 44.1 | 3.4 | 124.0 | 50.7 | 1.3 | 137.4 | 50.1 | 1.0 |
| 081215880 | GRB 081215B | 21:06:53.04 | - | - | - | - | 235.5 | -51.2 | 19.0 | 227.8 | -52.6 | 14.8 | 231.4 | -49.7 | 6.1 | 232.9 | -49.2 | 6.8 |
| 081224887 | GRB 081224A | 21:17:55.42 | - | - | - | - | 214.2 | 77.3 | 4.2 | 212.5 | 72.2 | 3.9 | 201.7 | 75.2 | 1.0 | 202.1 | 75.1 | 1.0 |
| 081231140 | GRB 081231A | 03:21:01.94 | 273.1 | -24.1 | 54.2 | 0.1 | 214.3 | -35.4 | 9.3 | 215.2 | -36.6 | 4.7 | 212.3 | -39.7 | 2.1 | 211.8 | -37.3 | 1.1 |
| Burst Name | Common Name | Trigger Time | IPN Annulus | FSW for IPN | FSW for IPN | Ground Auto for IPN | H.i.t.L. for IPN | |||||||||||
|---|---|---|---|---|---|---|---|---|---|---|---|---|---|---|---|---|---|---|
| (UT) | (RA | Dec | Err | Width) | (RA | Dec | Err) | (RA | Dec | Err) | (RA | Dec | Err) | (RA | Dec | Err) | ||
| 090108020 | GRB 090108A | 00:29:02.37 | 268.1 | -20.2 | 70.7 | 0.5 | 258.6 | 53.9 | 5.5 | 258.6 | 53.9 | 5.5 | 259.8 | 44.9 | 4.2 | 257.4 | 44.0 | 4.0 |
| 090112729 | GRB 090112B | 17:30:15.46 | 103.5 | 23.7 | 86.5 | 0.1 | 194.1 | 19.3 | 8.4 | 194.1 | 19.3 | 8.4 | 193.8 | 24.9 | 2.1 | 193.3 | 25.9 | 1.2 |
| 0901310901 | GRB 090131A | 02:09:21.15 | 349.211 | 18.471 | 0.02451 | 0.06121 | 33.4 | 28.1 | 29.4 | 353.3 | 16.1 | 3.9 | 352.9 | 20.5 | 1.6 | 352.4 | 20.9 | 1.2 |
| 090202347 | GRB 090202A | 08:19:30.41 | 332.2 | -12.3 | 56.9 | 0.4 | 260.3 | -15.9 | 22.4 | 260.4 | -15.9 | 7.4 | 280.7 | -9.6 | 4.7 | 276.4 | -4.8 | 3.3 |
| 090207777 | GRB 090207A | 18:39:10.84 | 158.7 | 8.7 | 78.3 | 0.2 | 244.5 | 14.7 | 9.8 | 243.5 | 34.9 | 9.8 | 242.3 | 38.0 | 4.2 | 243.5 | 36.9 | 4.2 |
| 090227310 | GRB 090227A | 07:25:57.01 | 320.3 | -16.6 | 46.8 | 0.2 | 9.1 | -42.5 | 9.2 | 4.2 | -45.9 | 7.3 | 2.5 | -42.2 | 2.2 | 2.5 | -42.1 | 1.2 |
| 0902282041 | GRB 090228A | 04:53:20.92 | 98.521 | -28.611 | 0.11581 | 0.00741 | 108.8 | -36.1 | 3.3 | 108.8 | -36.1 | 3.3 | 103.3 | -26.7 | 1.6 | 103.3 | -26.7 | 1.4 |
| 090304216 | GRB 090304A | 05:10:48.16 | 332.5 | -6.4 | 82.7 | 0.2 | 276.8 | -77.9 | 25.3 | 204.5 | -73.3 | 21.0 | 223.4 | -71.9 | 9.1 | 244.2 | -77.7 | 22.2 |
| 090305052 | GRB 090305B | 01:14:35.73 | 151.6 | 6.7 | 63.5 | 0.2 | 168.5 | 77.5 | 7.0 | 168.5 | 77.5 | 7.0 | 144.6 | 65.9 | 3.3 | 141.5 | 62.4 | 6.8 |
| 090308734 | GRB 090308B | 17:36:24.70 | 329.3 | -8.0 | 62.1 | 0.3 | 22.4 | -58.1 | 5.1 | 22.4 | -58.1 | 5.1 | 32.3 | -54.0 | 2.1 | 18.6 | -55.1 | 3.2 |
| 090328713 | GRB 090328B | 17:07:04.94 | 207.5 | -7.8 | 64.6 | 0.5 | 157.4 | 52.8 | 8.2 | 157.4 | 52.8 | 8.2 | 162.7 | 34.0 | 5.3 | 155.5 | 29.2 | 9.7 |
| 090330279 | GRB 090330A | 06:42:22.10 | 154.3 | 11.1 | 21.9 | 0.6 | 142.0 | -4.6 | 29.7 | 142.0 | -4.6 | 29.7 | 159.9 | -8.8 | 2.5 | 158.9 | -8.4 | 2.6 |
| 090411838 | GRB 090411A | 20:06:36.89 | 164.7 | 9.1 | 79.1 | 0.2 | 159.9 | -63.8 | 6.9 | 162.8 | -64.8 | 6.5 | 152.8 | -68.3 | 2.4 | 159.2 | -67.2 | 3.9 |
| 090411991 | GRB 090411B | 23:47:44.88 | 352.8 | -4.3 | 53.4 | 0.1 | 9.4 | -28.2 | 30.8 | 47.1 | 7.7 | 8.9 | 30.9 | -0.8 | 6.9 | 38.8 | 4.9 | 2.4 |
| 090413122 | GRB 090413A | 02:55:57.25 | 346.7 | -8.3 | 77.0 | 0.3 | - | - | - | - | - | - | 253.2 | -25.1 | 10.0 | 285.3 | -4.1 | 6.5 |
| 090425377 | GRB 090425A | 09:03:30.57 | - | - | - | - | 127.3 | 58.1 | 14.7 | 109.1 | 68.8 | 6.9 | 100.3 | 71.7 | 2.2 | 103.7 | 71.2 | 1.4 |
| 090429753 | GRB 090429D | 18:03:57.52 | - | - | - | - | 128.2 | 13.8 | 8.3 | 128.2 | 13.8 | 8.3 | 124.6 | 6.7 | 8.5 | 124.4 | 7.9 | 4.9 |
| 090514006 | GRB 090514A | 00:08:39.16 | 25.9 | 7.4 | 19.2 | 0.3 | 8.9 | -14.3 | 5.8 | 8.7 | -14.3 | 6.7 | 8.8 | -12.3 | 5.3 | 8.8 | -12.3 | 3.6 |
| 090514726 | GRB 090514B | 17:26:07.34 | 26.7 | 7.6 | 74.7 | 0.2 | 304.3 | -24.4 | 5.5 | 304.3 | -24.4 | 5.5 | 304.5 | -22.3 | 1.9 | 303.2 | -23.1 | 2.6 |
| 090516137 | GRB 090516B | 03:17:20.17 | 208.9 | -8.5 | 85.1 | 0.8 | 122.3 | -67.7 | 34.3 | 133.7 | -55.5 | 25.9 | 105.2 | -68.8 | 5.9 | 104.7 | -70.3 | 2.5 |
| 090516853 | GRB 090516C | 20:28:40.05 | 30.0 | 9.1 | 27.8 | 0.6 | 16.9 | -14.4 | 6.5 | 16.9 | -14.4 | 6.3 | 23.8 | -18.9 | 3.9 | 24.0 | -19.0 | 3.7 |
| 090518244 | GRB 090518B | 05:51:04.67 | - | - | - | - | 210.4 | -18.6 | 8.7 | 210.4 | -18.6 | 8.7 | 206.7 | -16.8 | 5.1 | 210.4 | -15.9 | 4.5 |
| 090520850 | GRB 090520C | 20:23:19.31 | 37.0 | 12.1 | 82.4 | 0.3 | 110.2 | -19.4 | 7.0 | 110.5 | -19.0 | 6.8 | 118.5 | -17.6 | 2.5 | 117.2 | -17.9 | 1.6 |
| 090524346 | GRB 090524A | 08:17:56.24 | 223.2 | -14.4 | 83.4 | 0.1 | 309.7 | -64.4 | 10.9 | 319.2 | -68.0 | 5.3 | 332.4 | -67.5 | 1.9 | 329.2 | -67.7 | 1.9 |
| 090528516 | GRB 090528B | 12:22:31.29 | 51.2 | 17.3 | 90.0 | 0.1 | 301.4 | 39.4 | 14.1 | 313.1 | 33.1 | 4.9 | 311.5 | 31.0 | 1.0 | 312.7 | 30.8 | 1.0 |
| 090529564 | GRB 090529C | 13:32:00.49 | 206.3 | -9.7 | 69.3 | 0.1 | 168.0 | 40.8 | 4.4 | 164.2 | 36.8 | 3.9 | 162.0 | 45.5 | 2.1 | 162.4 | 47.4 | 2.1 |
| 090530760 | GRB 090530B | 18:14:24.44 | 56.0 | 18.9 | 14.6 | 0.6 | 75.4 | 8.8 | 12.1 | 77.3 | 13.4 | 4.9 | 73.5 | 14.8 | 1.2 | 72.1 | 14.3 | 1.3 |
| 090606471 | GRB 090606A | 11:18:08.01 | 251.4 | -22.7 | 73.1 | 0.3 | 5.4 | -77.4 | 15.5 | 85.4 | -77.4 | 15.5 | 150.2 | -71.7 | 8.6 | 135.4 | -74.2 | 5.7 |
| 090610648 | GRB 090610A | 15:33:25.94 | 81.6 | 24.4 | 17.4 | 0.3 | 82.6 | 32.9 | 13.5 | 82.6 | 32.9 | 13.5 | 87.7 | 36.1 | 11.0 | 86.6 | 36.6 | 11.7 |
| 090612619 | GRB 090612A | 14:50:50.50 | 86.4 | 24.8 | 19.3 | 0.3 | 80.3 | 14.4 | 7.8 | 76.4 | 17.5 | 7.3 | 71.9 | 13.3 | 5.0 | 67.8 | 11.1 | 3.5 |
| 090617208 | GRB 090617A | 04:59:58.58 | 97.4 | 25.2 | 12.5 | 0.3 | 86.8 | 53.0 | 11.3 | 86.8 | 53.0 | 11.3 | 79.6 | 26.8 | 7.0 | 79.4 | 22.7 | 7.6 |
| 0906204001 | GRB 090620A | 09:36:23.47 | 234.251 | 64.701 | 0.03381 | 0.04221 | 228.6 | 60.9 | 6.9 | 243.1 | 68.0 | 4.6 | 238.6 | 61.8 | 1.4 | 237.4 | 61.2 | 1.1 |
| 090623107 | GRB 090623A | 02:34:17.57 | 223.9 | -15.8 | 77.9 | 0.1 | 312.3 | -52.0 | 7.3 | 313.2 | -47.6 | 6.6 | 307.3 | -47.6 | 3.4 | 312.0 | -44.9 | 1.5 |
| 090717034 | GRB 090717A | 00:49:32.11 | 61.3 | 20.3 | 87.3 | 0.1 | 95.0 | -66.3 | 9.2 | 97.2 | -62.0 | 4.8 | 92.0 | -63.7 | 3.0 | 87.1 | -63.7 | 1.2 |
| Burst Name | Common Name | Trigger Time | IPN Annulus | FSW for IPN | FSW for IPN | Ground Auto for IPN | H.i.t.L. for IPN | |||||||||||
|---|---|---|---|---|---|---|---|---|---|---|---|---|---|---|---|---|---|---|
| (UT) | (RA | Dec | Err | Width) | (RA | Dec | Err) | (RA | Dec | Err) | (RA | Dec | Err) | (RA | Dec | Err) | ||
| 090718762 | GRB 090718B | 18:17:42.85 | 242.5 | -20.5 | 32.5 | 0.1 | 267.5 | -43.5 | 16.5 | 273.5 | -37.3 | 4.3 | 271.9 | -35.9 | 1.6 | 273.9 | -35.0 | 1.1 |
| 090719063 | GRB 090719A | 01:31:26.62 | 242.7 | -20.5 | 74.6 | 0.1 | 200.8 | -41.0 | 4.3 | 0.6 | -52.3 | 3.8 | 340.4 | -70.0 | 1.0 | 338.1 | -69.4 | 1.0 |
| 090720710 | GRB 090720B | 17:02:56.91 | 274.5 | -23.9 | 61.1 | 0.7 | 204.5 | -55.4 | 4.5 | 204.5 | -55.4 | 4.5 | 203.7 | -57.5 | 1.8 | 224.2 | -56.2 | 4.7 |
| 090802235 | GRB 090802A | 05:39:03.09 | - | - | - | - | 84.1 | 30.9 | 5.1 | 84.1 | 30.9 | 5.1 | 84.3 | 34.1 | 3.6 | 84.3 | 34.1 | 4.2 |
| 090804940 | GRB 090804A | 22:33:20.02 | 170.6 | 2.4 | 44.3 | 0.1 | 127.2 | -9.4 | 4.3 | 129.5 | -14.0 | 4.2 | 129.5 | -11.8 | 1.0 | 128.6 | -12.2 | 1.0 |
| 090809978 | GRB 090809B | 23:28:14.62 | 175.0 | -0.2 | 76.2 | 0.3 | 87.9 | 8.8 | 9.3 | 88.0 | 8.7 | 4.2 | 97.1 | 0.1 | 1.1 | 97.7 | -0.7 | 1.0 |
| 090811696 | GRB 090811A | 16:41:50.04 | 355.9 | 1.0 | 85.8 | 0.1 | 278.4 | 22.3 | 10.1 | 278.4 | 22.3 | 10.1 | 278.1 | 19.7 | 7.7 | 285.7 | 30.7 | 8.9 |
| 090814368 | GRB 090814C | 08:49:41.23 | 358.4 | 2.4 | 70.5 | 0.1 | 303.8 | 74.8 | 8.6 | 303.8 | 74.8 | 8.6 | 348.6 | 66.1 | 11.3 | 349.7 | 67.0 | 9.9 |
| 090814950 | GRB 090814D | 22:47:28.78 | 358.8 | 2.7 | 61.5 | 0.3 | 330.0 | 42.2 | 31.7 | 326.4 | 37.9 | 8.6 | 309.0 | 45.7 | 4.0 | 299.6 | 43.1 | 2.7 |
| 090820027 | GRB 090820A | 00:38:16.19 | - | - | - | - | 84.6 | 47.1 | 23.2 | 86.0 | 17.4 | 3.4 | 89.8 | 25.8 | 1.0 | 90.0 | 26.9 | 1.0 |
| 090828099 | GRB 090828A | 02:22:48.20 | 185.9 | -7.4 | 57.9 | 0.3 | 129.0 | -35.3 | 23.8 | 124.5 | -26.1 | 5.4 | 123.5 | -25.5 | 3.4 | 124.3 | -26.2 | 1.0 |
| 0908296721 | GRB 090829A | 16:07:38.87 | 323.061 | -37.461 | 0.01701 | 0.03751 | 326.1 | -47.7 | 23.3 | 323.8 | -41.2 | 4.5 | 327.3 | -33.1 | 1.1 | 327.2 | -33.1 | 1.0 |
| 090829702 | GRB 090829B | 16:50:40.14 | - | - | - | - | 7.1 | -15.7 | 21.9 | 354.1 | -17.5 | 9.3 | 351.6 | -11.8 | 4.9 | 354.7 | -4.3 | 2.4 |
| 090831317 | GRB 090831A | 07:36:36.59 | - | - | - | - | 87.8 | 55.9 | 9.7 | 87.8 | 55.9 | 9.7 | 148.0 | 50.2 | 6.3 | 145.3 | 49.5 | 2.2 |
| 090907808 | GRB 090907B | 19:23:47.48 | - | - | - | - | 88.8 | 16.3 | 6.1 | 88.8 | 16.3 | 6.1 | 80.7 | 16.5 | 5.2 | 84.3 | 23.2 | 4.8 |
| 090908341 | GRB 090908B | 08:10:39.82 | 185.8 | -8.1 | 31.0 | 0.3 | 163.1 | -12.8 | 30.3 | 165.0 | -23.8 | 21.9 | 168.3 | -26.6 | 9.2 | 161.8 | -22.1 | 6.5 |
| 090910812 | GRB 090910A | 19:29:48.81 | 4.9 | 7.7 | 74.8 | 0.2 | 23.7 | 56.4 | 9.8 | 7.3 | 53.9 | 7.9 | 284.1 | 67.3 | 2.9 | 284.9 | 70.6 | 1.1 |
| 090922539 | GRB 090922A | 12:56:42.14 | 355.2 | 0.7 | 75.1 | 0.2 | 354.3 | 75.5 | 4.5 | 354.2 | 75.6 | 4.9 | 17.1 | 74.2 | 1.2 | 17.1 | 74.4 | 1.0 |
| 090922605 | GRB 090922B | 14:30:41.53 | 355.1 | 0.7 | 55.6 | 0.2 | 22.9 | -22.8 | 21.0 | 52.4 | -75.7 | 6.5 | 33.5 | -35.5 | 8.7 | 16.4 | -24.4 | 5.3 |
| 090925389 | GRB 090925A | 09:20:33.68 | - | - | - | - | 315.7 | 24.6 | 11.7 | 313.7 | 19.9 | 8.6 | 326.2 | 16.8 | 3.6 | 334.0 | 13.6 | 3.9 |
| 090928646 | GRB 090928A | 15:29:44.67 | 172.2 | 3.0 | 78.5 | 0.2 | 98.2 | -54.2 | 10.2 | 98.1 | -59.4 | 9.4 | 92.7 | -53.8 | 9.9 | 94.4 | -53.6 | 8.2 |
| 091012783 | GRB 091012A | 18:47:02.77 | 41.4 | 15.7 | 68.7 | 0.4 | 239.4 | 58.0 | 4.4 | 239.4 | 58.0 | 4.4 | 131.3 | 87.4 | 1.5 | 131.5 | 87.4 | 1.4 |
| 091020977 | GRB 091020B | 23:26:34.45 | 124.6 | 21.0 | 75.3 | 0.1 | 176.3 | 28.4 | 5.7 | 173.4 | 2.2 | 6.6 | 190.3 | 0.2 | 3.3 | 191.3 | -4.7 | 2.9 |
| 091030828 | GRB 091030A | 19:52:26.87 | - | - | - | - | 40.8 | 22.1 | 6.2 | 40.9 | 22.4 | 4.7 | 42.1 | 24.1 | 1.8 | 42.1 | 23.9 | 1.6 |
| 091101143 | GRB 091101A | 03:26:32.49 | 56.2 | 16.4 | 55.9 | 0.6 | 31.6 | -26.8 | 9.5 | 26.8 | -35.2 | 6.0 | 24.7 | -33.8 | 4.1 | 30.2 | -33.4 | 3.3 |
| 091120191 | GRB 091120A | 04:34:40.23 | 316.9 | -18.6 | 83.3 | 0.1 | 225.1 | -19.9 | 11.4 | 225.1 | -19.9 | 11.4 | 224.3 | -26.9 | 2.9 | 224.3 | -26.9 | 1.3 |
| 091126333 | GRB 091126A | 07:59:24.77 | 65.9 | 16.0 | 41.7 | 0.7 | 53.6 | -80.0 | 5.9 | 53.6 | -80.0 | 5.9 | 82.7 | -16.1 | 4.8 | 82.1 | -17.0 | 4.9 |
| 091128285 | GRB 091128A | 06:50:34.65 | - | - | - | - | 135.9 | -11.9 | 18.0 | 131.3 | -3.0 | 5.1 | 128.1 | 4.4 | 1.4 | 128.1 | 1.9 | 1.4 |
| 091227294 | GRB 091227A | 07:03:13.39 | 294.5 | -23.9 | 23.7 | 0.4 | 305.0 | 10.0 | 15.8 | 305.4 | 9.9 | 9.8 | 298.3 | 1.9 | 4.2 | 297.0 | 3.4 | 3.3 |
| 091231206 | GRB 091231A | 04:56:33.49 | 300.2 | -22.7 | 80.4 | 0.2 | 196.3 | -64.1 | 15.0 | 187.5 | -54.3 | 8.0 | 196.9 | -57.9 | 2.6 | 195.6 | -54.0 | 2.1 |
| 100101988 | GRB 100101B | 23:42:15.19 | 142.2 | 18.9 | 46.7 | 0.2 | 65.2 | 17.1 | 19.6 | 65.2 | 17.1 | 19.6 | 83.0 | 9.2 | 12.9 | 81.8 | 19.5 | 23.7 |
| 100118100 | GRB 100118A | 02:23:33.70 | 313.8 | -15.7 | 57.4 | 0.1 | 71.5 | -81.3 | 14.4 | 71.4 | -81.3 | 11.4 | 359.6 | -60.6 | 13.3 | 359.2 | -63.7 | 3.0 |
| 100122616 | GRB 100122A | 14:47:37.32 | 135.9 | 21.5 | 65.8 | 0.2 | 49.0 | 0.2 | 20.7 | 76.7 | -11.0 | 4.2 | 88.7 | -6.8 | 2.1 | 78.5 | -2.1 | 1.6 |
| 100130777 | GRB 100130B | 18:38:35.47 | - | - | - | - | 144.7 | 31.2 | 16.0 | 69.0 | 25.1 | 17.8 | 78.0 | 19.0 | 5.6 | 79.7 | 23.2 | 2.5 |
| Burst Name | Common Name | Trigger Time | IPN Annulus | FSW for IPN | FSW for IPN | Ground Auto for IPN | H.i.t.L. for IPN | |||||||||||
|---|---|---|---|---|---|---|---|---|---|---|---|---|---|---|---|---|---|---|
| (UT) | (RA | Dec | Err | Width) | (RA | Dec | Err) | (RA | Dec | Err) | (RA | Dec | Err) | (RA | Dec | Err) | ||
| 100131730 | GRB 100131A | 17:30:57.68 | 132.4 | 22.5 | 16.4 | 0.3 | 117.0 | 26.2 | 3.9 | 117.0 | 26.2 | 3.9 | 131.2 | 24.8 | 1.3 | 117.5 | 13.8 | 1.5 |
| 100205490 | GRB 100205B | 11:45:38.26 | 115.9 | 18.2 | 41.0 | 0.6 | 126.6 | -33.4 | 21.3 | 134.7 | -20.0 | 19.2 | 133.3 | -21.4 | 8.6 | 132.6 | -22.2 | 7.1 |
| 100211440 | GRB 100211A | 10:33:35.17 | - | - | - | - | 120.9 | 31.8 | 5.4 | 120.9 | 31.8 | 5.4 | 138.4 | 30.2 | 3.8 | 133.3 | 29.0 | 2.3 |
| 100212550 | GRB 100212B | 13:11:45.47 | 117.1 | 19.3 | 21.6 | 0.3 | 138.7 | 33.9 | 7.3 | 131.4 | 34.1 | 6.6 | 136.0 | 33.8 | 2.0 | 134.3 | 32.3 | 1.9 |
| 100223110 | GRB 100223A | 02:38:09.31 | 125.4 | 23.8 | 25.0 | 0.1 | 105.9 | -7.5 | 5.3 | 105.9 | -7.5 | 5.3 | 94.2 | 3.0 | 6.0 | 102.1 | 5.6 | 7.7 |
| 100224112 | GRB 100224B | 02:40:55.48 | 306.0 | -19.3 | 38.2 | 0.2 | 269.8 | -28.6 | 15.3 | 266.2 | -9.5 | 6.2 | 271.2 | -20.8 | 1.9 | 270.0 | -18.7 | 2.2 |
| 100225580 | GRB 100225C | 13:55:31.35 | 307.5 | -19.2 | 21.3 | 0.3 | 312.8 | -0.5 | 19.0 | 312.8 | -0.5 | 4.8 | 317.0 | 6.3 | 4.1 | 311.7 | 3.4 | 1.2 |
| 100225703 | GRB 100225D | 16:52:18.12 | 127.9 | 19.2 | 26.1 | 0.3 | 94.5 | -61.6 | 9.3 | 137.2 | 43.9 | 12.1 | 142.0 | 26.6 | 5.4 | 153.2 | 30.9 | 7.5 |
| 100313288 | GRB 100313A | 06:54:23.23 | 145.7 | 15.9 | 74.4 | 0.2 | 157.0 | -58.7 | 7.7 | 166.8 | -58.8 | 6.5 | 173.4 | -54.4 | 3.7 | 169.3 | -52.4 | 3.0 |
| 100322045 | GRB 100322A | 01:05:09.65 | 337.1 | -12.2 | 45.7 | 0.1 | 24.7 | -10.2 | 6.8 | 28.7 | -5.8 | 4.4 | 22.1 | -12.0 | 1.0 | 21.0 | -13.4 | 1.0 |
| 1003241721 | GRB 100324B | 04:07:36.49 | 39.671 | -19.291 | 0.02531 | 0.04311 | 326.0 | -37.1 | 3.6 | 61.3 | -12.2 | 4.1 | 25.5 | -16.7 | 1.2 | 44.7 | -17.3 | 1.0 |
| 100326402 | GRB 100326B | 09:38:20.05 | 343.3 | -9.9 | 28.2 | 0.3 | 303.0 | 12.1 | 23.3 | 308.3 | 13.3 | 18.8 | 312.8 | -16.5 | 9.0 | 310.8 | -4.6 | 2.1 |
| 100330309 | GRB 100330A | 07:24:51.73 | 168.8 | 7.8 | 32.8 | 0.2 | 213.8 | -1.5 | 11.6 | 208.3 | -0.7 | 7.5 | 195.4 | -0.1 | 3.2 | 202.8 | 1.8 | 2.9 |
| 1004107401 | GRB 100410B | 17:45:46.67 | 351.921 | 62.901 | 0.08101 | 0.14731 | 293.9 | 25.6 | 25.5 | 319.3 | 37.4 | 11.8 | 4.0 | 61.8 | 2.9 | 3.1 | 60.8 | 1.6 |
| 100421917 | GRB 100421A | 21:59:48.40 | 24.8 | 9.1 | 49.6 | 0.4 | 324.6 | 18.0 | 23.2 | 345.4 | -19.4 | 14.3 | 343.9 | -19.3 | 4.9 | 344.9 | -21.1 | 3.2 |
| 100423244 | GRB 100423B | 05:51:25.76 | 27.3 | 10.3 | 89.4 | 0.1 | 120.6 | 5.2 | 31.9 | 120.9 | 0.0 | 7.9 | 120.6 | 4.5 | 2.6 | 119.7 | 5.8 | 1.6 |
| 100424876 | GRB 100424C | 21:01:52.60 | 30.5 | 11.7 | 36.9 | 0.2 | 39.5 | 32.8 | 22.4 | 39.5 | 32.8 | 22.4 | 44.9 | 30.8 | 14.7 | 17.6 | 46.5 | 2.5 |
| 100502356 | GRB 100502A | 08:33:02.95 | 45.9 | 18.0 | 76.6 | 0.1 | 133.3 | 16.8 | 23.8 | 129.6 | 19.9 | 7.9 | 125.7 | 27.1 | 2.8 | 127.7 | 23.9 | 1.6 |
| 100503554 | GRB 100503A | 13:18:03.89 | 228.5 | -18.8 | 79.2 | 0.1 | 145.7 | -14.1 | 22.8 | 146.8 | 5.4 | 7.6 | 144.5 | 5.6 | 2.7 | 149.3 | 5.5 | 1.9 |
| 100511035 | GRB 100511A | 00:49:56.24 | 64.3 | 23.4 | 51.9 | 0.1 | 107.8 | -0.9 | 8.1 | 108.3 | -8.1 | 4.7 | 111.5 | -0.9 | 1.3 | 110.5 | -3.2 | 1.0 |
| 100515467 | GRB 100515A | 11:13:09.04 | 322.1 | -16.7 | 61.4 | 0.1 | 279.1 | 30.0 | 4.6 | 279.1 | 30.0 | 5.4 | 271.1 | 24.3 | 2.1 | 276.4 | 26.7 | 2.3 |
| 100517154 | GRB 100517D | 03:42:08.06 | 255.9 | -25.2 | 25.0 | 0.2 | 236.9 | -12.9 | 8.1 | 236.9 | -12.9 | 8.1 | 242.1 | -12.0 | 4.7 | 246.5 | -9.2 | 4.1 |
| 100519204 | GRB 100519A | 04:53:22.71 | 79.4 | 25.6 | 75.1 | 0.5 | 191.0 | 58.8 | 12.8 | 182.0 | 56.5 | 8.1 | 191.2 | 56.8 | 2.2 | 197.7 | 57.9 | 1.5 |
| 100527795 | GRB 100527A | 19:04:37.25 | 272.8 | -25.5 | 54.1 | 0.5 | 212.5 | 40.2 | 26.9 | 214.2 | 26.8 | 12.3 | 229.5 | 17.0 | 3.1 | 232.4 | 14.5 | 4.9 |
| 100604287 | GRB 100604A | 06:53:34.82 | 281.0 | -24.1 | 51.0 | 0.3 | 271.1 | -79.5 | 14.3 | 240.0 | -72.6 | 6.6 | 255.5 | -75.5 | 2.7 | 245.5 | -69.9 | 2.3 |
| 100609783 | GRB 100609A | 18:48:11.33 | 153.7 | 12.3 | 57.2 | 0.7 | 100.0 | 33.8 | 28.2 | 95.4 | 36.5 | 13.4 | 89.9 | 42.0 | 5.4 | 98.1 | 36.1 | 1.5 |
| 100612545 | GRB 100612A | 13:04:21.66 | - | - | - | - | 61.6 | 10.1 | 7.4 | 61.6 | 10.1 | 7.4 | 68.7 | 18.7 | 5.8 | 65.2 | 17.5 | 4.2 |
| 100612726 | GRB 100612B | 17:26:06.13 | 288.2 | -21.5 | 66.0 | 0.3 | 351.9 | 1.1 | 7.4 | 346.5 | 2.6 | 4.1 | 352.1 | -3.1 | 1.2 | 352.1 | -3.0 | 1.1 |
| 1006201191 | GRB 100620A | 02:51:29.12 | 88.991 | -50.721 | 0.15931 | 0.25041 | 79.6 | -52.6 | 8.4 | 79.7 | -52.5 | 8.2 | 91.4 | -51.8 | 3.6 | 93.0 | -52.3 | 2.1 |
| 1006298011 | GRB 100629A | 19:14:03.36 | 227.621 | 29.551 | 0.01961 | 0.12971 | 212.2 | 33.1 | 4.7 | 212.2 | 33.1 | 4.7 | 221.7 | 27.1 | 6.5 | 222.2 | 30.0 | 2.7 |
| 1007070321 | GRB 100707A | 00:46:38.99 | 357.601 | -6.961 | 0.15941 | 0.06791 | 52.9 | -47.4 | 3.4 | 3.2 | -10.6 | 3.6 | 351.3 | -7.3 | 1.0 | 351.3 | -7.5 | 1.0 |
| 100709602 | GRB 100709A | 14:27:32.99 | 169.1 | 5.6 | 23.7 | 0.2 | 143.6 | 3.1 | 13.6 | 155.3 | -8.1 | 12.0 | 152.5 | -3.8 | 8.7 | 142.3 | 20.7 | 4.2 |
Appendix C Dependence of the single-component systematic error on GRB location in spacecraft coordinate system
Results for single-component models exploring the effects of GRB location in the different spacecraft hemispheres and quadrants are shown in Table 11. The first entry in the table repeats the values from Table 2 showing the single Gaussian fits for each localization type. The parameter values and odds ratio for the simplest single component fit can be compared with those for the models that split the GRBs according to position in spacecraft coordinates. GRBs localized with HitL 4.13 in the +Z and +Y hemispheres were found to have a lower systematic error than those in the -Z and -Y hemispheres and separating the sample into hemispheres was slightly preferred over a single component for the whole sky. GRBs in the Y quadrants appear to have smaller systematic errors than those in the X quadrants, and splitting the GRBs into quadrants is slightly preferred over the all-sky single-component model, but the odds ratio for this model was, however, still much lower than the core-plus-tail model in Table 3. which is thus greatly preferred over any of the single-component models. The odds ratio for these models was, however, still much lower than the core-plus-tail model in Table 3 .
| Single-Component Gaussian with hemisphere dependence | |||||||
| Type | Hemisphere | Number GRB | Peak | Error | Log10 | Log10 | |
| Point | Annuli | ∘ | ∘ | Likelihood | Odds Factor | ||
| Ground-Auto | All-sky | 208 | 100 | 6.62 | 0.29 | 155.2 | 154.3 |
| Ground-Auto | +X | 208 | 100 | 6.95 | 0.42 | ||
| -X | 6.25 | 0.41 | 155.5 | 154.0 | |||
| Ground-Auto | +Y | 208 | 100 | 7.02 | 0.44 | ||
| -Y | 6.21 | 0.39 | 155.7 | 154.2 | |||
| Ground-Auto | +Z | 208 | 100 | 6.48 | 0.33 | ||
| -Z | 7.10 | 0.64 | 155.4 | 154.0 | |||
| Ground-Auto | X | 208 | 100 | 7.27 | 0.45 | ||
| Y | 5.96 | 0.38 | 156.3 | 154.8 | |||
| HitL 4.14g | All-sky | 212 | 100 | 5.15 | 0.22 | 224.6 | 223.6 |
| HitL 4.14g | +X | 212 | 100 | 5.19 | 0.31 | ||
| -X | 5.06 | 0.32 | 224.6 | 222.9 | |||
| HitL 4.14g | +Y | 212 | 100 | 5.26 | 0.32 | ||
| -Y | 5.02 | 0.31 | 224.7 | 222.9 | |||
| HitL 4.14g | +Z | 212 | 100 | 4.98 | 0.24 | ||
| -Z | 5.68 | 0.53 | 225.0 | 223.3 | |||
| HitL 4.14g | X | 212 | 100 | 5.41 | 0.35 | ||
| Y | 4.93 | 0.29 | 224.9 | 223.2 | |||
| HitL 4.13 | All-sky | 211 | 100 | 6.23 | 0.26 | 192.6 | 191.7 |
| HitL 4.13 | +X | 211 | 100 | 6.04 | 0.35 | ||
| -X | 6.41 | 0.37 | 192.7 | 191.1 | |||
| HitL 4.13 | +Y | 211 | 100 | 6.84 | 0.39 | ||
| -Y | 5.57 | 0.34 | 194.0 | 192.4 | |||
| HitL 4.13 | +Z | 211 | 100 | 5.90 | 0.27 | ||
| -Z | 7.57 | 0.66 | 194.0 | 192.5 | |||
| HitL 4.13 | X | 211 | 100 | 6.74 | 0.39 | ||
| Y | 5.75 | 0.33 | 193.5 | 191.8 | |||
Appendix D Dependence of the core-plus-tail systematic error model on GRB spacecraft hemisphere
Results for core-plus-tail models that explore the effect of GRB position in different spacecraft hemispheres are shown in Table 12. The odds ratios for these hemisphere-dependent models should be compared with the simplest all-sky core-plus-tail, repeated from Table 3 as the first entry. Only HitL 4.14g showed a difference from the all-sky core-plus-tail model, with lower parameter values in the +Z hemisphere. By comparing the odds ratios for the two models, we can see that this hemisphere-dependent model is not preferred statistically, but the parameter values are different enough that with a much larger reference sample, this model may become favored over a single core-plus-tail model. HitL 4.13 showed no parameter difference for the core-plus-tail division into Z hemispheres, and the Ground-Auto localization sample failed to converge using this 6-parameter model. In general the division into hemispheres produced similar parameters with larger uncertainties; some juggling of events between the core and the tail can account for the slight differences in parameter values, with the exception of HitL 4.14g and the Z hemisphere division that appears promising when a larger sample becomes available.
| Core + Tail (2 Gaussians) with hemisphere dependence | |||||||||||
| Type | Hemisphere | Number GRB | Core | Error | Core | Error | Tail | Error | Log10 | Log10 | |
| Point | Annuli | ∘ | ∘ | % | % | ∘ | ∘ | Likelihood | odds Factor | ||
| Ground-Auto | All-sky | 208 | 100 | 3.72 | 0.34 | 80.4 | 5.3 | 13.7 | 1.7 | 174.1 | 171.8 |
| Ground-Auto | +X | 208 | 100 | 3.95 | 0.52 | 82.2 | 7.7 | 14.1 | 2.6 | ||
| -X | 3.55 | 0.44 | 79.3 | 7.4 | 13.4 | 2.5 | 174.1 | 170.6 | |||
| Ground-Auto | +Y | 208 | 100 | 3.80 | 0.44 | 77.7 | 7.1 | 14.5 | 2.3 | ||
| -Y | 3.58 | 0.56 | 82.6 | 9.0 | 12.3 | 2.6 | 174.5 | 171.0 | |||
| Ground-Auto | The Z-hemisphere model failed to produce values for the -Z parameters | ||||||||||
| HitL 4.14g | All-sky | 212 | 100 | 3.71 | 0.24 | 90.0 | 3.5 | 14.3 | 2.5 | 241.3 | 238.9 |
| HitL 4.14g | +X | 212 | 100 | 3.76 | 0.32 | 90.7 | 4.8 | 13.8 | 3.6 | ||
| -X | 3.68 | 0.33 | 89.7 | 5.0 | 15.4 | 3.7 | 241.3 | 237.4 | |||
| HitL 4.14g | +Y | 212 | 100 | 3.89 | 0.33 | 89.3 | 5.2 | 13.9 | 3.6 | ||
| -Y | 3.53 | 0.30 | 90.5 | 4.5 | 14.9 | 3.7 | 241.5 | 237.5 | |||
| HitL 4.14g | +Z | 212 | 100 | 3.43 | 0.27 | 88.3 | 4.7 | 12.7 | 2.4 | ||
| -Z | 4.36 | 0.52 | 90.4 | 6.0 | 16.2 | 8.2 | 242.5 | 238.5 | |||
| HitL 4.13 | All-sky | 211 | 100 | 3.57 | 0.32 | 79.8 | 5.3 | 12.7 | 1.5 | 213.5 | 211.1 |
| HitL 4.13 | +X | 211 | 100 | 3.48 | 0.39 | 83.1 | 6.3 | 12.9 | 2.2 | ||
| -X | 3.64 | 0.52 | 75.9 | 8.8 | 12.3 | 2.2 | 213.8 | 210.1 | |||
| HitL 4.13 | +Y | 211 | 100 | 3.63 | 0.48 | 77.1 | 7.6 | 13.1 | 2.0 | ||
| -Y | 3.50 | 0.42 | 81.9 | 7.8 | 11.8 | 2.4 | 213.8 | 210.1 | |||
| HitL 4.13 | +Z | 211 | 100 | 3.40 | 0.37 | 79.6 | 6.4 | 11.4 | 1.5 | ||
| -Z | 3.94 | 0.61 | 76.0 | 9.2 | 15.4 | 3.5 | 214.4 | 210.8 | |||
.
References
- Aasi et al. (2013) Aasi, J., et al. 2013, arXiv:1304.0670
- Abadie et al. (2010) Abadie, J., et al. 2010, Classical & QG, 27, 17
- Abadie et al. (2012) —. 2012, Astrophys. J., 760, 12
- Abdo et al. (2009) Abdo, A. A., et al. 2009, Astrophys. J. Lett., 706, L138
- Ackermann et al. (2013) Ackermann, M., et al. 2013, Astrophys. J. Supp., 209, 11
- Atwood et al. (2009) Atwood, W. S., et al. 2009, Astrophys. J., 697, 1071
- Band et al. (1993) Band, D. L., et al. 1993, Astrophys. J., 413, 281
- Bissaldi et al. (2009) Bissaldi, E., et al. 2009, Exp. Astron., 24, 47
- Briggs et al. (1999) Briggs, M. S., et al. 1999, Astrophys. J. Supp., 503, 122
- Briggs et al. (2009) —. 2009, AIP Conf.Proc. 1133, ed. Meegan, Gehrels, & Kouveliotou, 40
- Bromberg et al. (2013) Bromberg, O., et al. 2013, Astrophys. J., 764, 179
- Connaughton et al. (2013) Connaughton, V., et al. 2013, EAS Publications Series, 61, 657
- de Ugarte Postigo et al. (2013) de Ugarte Postigo, A., et al. 2013, GCN Circular 15187
- Goldstein et al. (2012) Goldstein, A. M., et al. 2012, Astrophys. J. Supp., 199, 19
- Graziani & Lamb (1996) Graziani, C., & Lamb, D. Q. 1996, AIP Conf.Proc. 384, ed. Kouveliotou, Briggs, & Fishman, 382
- Gruber et al. (2014) Gruber, D., et al. 2014, Astrophys. J. Supp., 211, 12
- Hurley et al. (2013) Hurley, K., et al. 2013, Astrophys. J. Supp., 207, 39
- Kippen et al. (2007) Kippen, R. M., et al. 2007, AIP Conf.Proc. 921, 590
- Leloudas et al. (2013) Leloudas, G., et al. 2013, GCN Circular 14983
- Levan et al. (2013) Levan, A. J., et al. 2013, GCN Circular 14455
- Loredo (1990) Loredo, T. J. 1990, in Maximum Entropy and Bayesian Methods, ed. P. F. Fougère (Kluwer Academic, Dordrecht), 81
- Meegan et al. (2009) Meegan, C., et al. 2009, Astrophys. J., 702, 791
- Paciesas et al. (2012) Paciesas, W. S., et al. 2012, Astrophys. J. Supp., 199, 18
- Pal’shin et al. (2013) Pal’shin, V. D., et al. 2013, Astrophys. J. Supp., 207, 38
- Pandey et al. (2010) Pandey, S., et al. 2010, Astrophys. J., 714, 799
- Pendleton et al. (1999) Pendleton, G. N., et al. 1999, Astrophys. J., 512, 362
- Ramírez et al. (2013) Ramírez, R. S., et al. 2013, GCN Circular 14685
- Singer et al. (2013) Singer, L., et al. 2013, Astrophys. J. Lett., 776, 34
- Sivia (1996) Sivia, D. S. 1996, Data Analysis: A Bayesian Tutorial (Oxford, England: Oxford Univ. Press)
- Soderberg et al. (2010) Soderberg, A. M., et al. 2010, Nature, 463, 513
- von Kienlin et al. (2014) von Kienlin, A., et al. 2014, Astrophys. J. Supp., 211, 13