On the intermediate-redshift central stellar mass-halo mass relation, and implications for the evolution of the most massive galaxies since
Abstract
The stellar mass-halo mass relation is a key constraint in all semi-analytic, numerical, and semi-empirical models of galaxy formation and evolution. However, its exact shape and redshift dependence remain debated. Several recent works support a relation in the local Universe steeper than previously thought. Based on the comparisons with a variety of data on massive central galaxies, we show that this steepening holds up to , for stellar masses . Specifically, we find significant evidence for a high-mass end slope of , instead of the usual reported by a number of previous results. When including the independent constraints from the recent BOSS clustering measurements, the data, independent of any systematic errors in stellar masses, tend to favor a model with a very small scatter ( dex) in stellar mass at fixed halo mass, in the redshift range and for , suggesting a close connection between massive galaxies and host halos even at relatively recent epochs. We discuss the implications of our results with respect to the evolution of the most massive galaxies since .
Subject headings:
cosmology: theory – galaxies: statistics – galaxies: evolution1. Introduction
Probing the exact relation between stellar mass and host halo mass is one of the hottest topics in present-day cosmology (Leauthaud et al., 2012; Yang et al., 2012; Behroozi et al., 2013; Moster et al., 2013; Reddick et al., 2013). Such mapping can possibly shed light on the complex and still poorly understood physical processes that govern galaxy evolution (e.g., Silk et al., 2013), as well as unveil key properties of the underlying dark matter cosmological model (e.g., Weinberg et al., 2013).
Constraining the statistical and environmental evolution of massive galaxies, especially those of , is particularly meaningful. A number of independent observations are showing that galaxies above this mass scale tend to depart from simple extrapolations of the scaling relations characterizing their lower-mass counterparts, having larger sizes, more prolate shapes, and redder colors (e.g., van der Wel et al., 2009; Bernardi et al., 2011a).
However, the galaxy-halo mapping for massive galaxies as inferred from abundance matching between the stellar and halo mass functions, is still under debate. One of the main uncertainties relies on a proper determination of the stellar mass function (e.g., Bernardi et al., 2013; Muzzin et al., 2013). For example, the constant number density evolution of the massive galaxies derived by, e.g., Carollo et al. (2013) at , is in disagreement with other measurements at similar redshifts (Maraston et al., 2013; Muzzin et al., 2013).
In this letter, we provide additional, key constraints to the - relation for massive central galaxies at using direct stellar and host halo mass measurements of the Brightest Cluster Galaxies (BCGs), as well as accurate galaxy clustering measurements at . The galaxy clustering measurements are used to infer the host halo mass distributions through the halo occupation distribution (HOD) models (e.g., Zheng et al., 2007), and thus provide a powerful tool to break the degeneracies inherent to the abundance matching techniques.
In the following we will adopt a cosmology with parameters , , , , , and , to match the one assumed in our reference stellar mass functions and halo occupation measurements. We will adopt the Chabrier Initial Mass Function (IMF; Chabrier 2003) as our reference one.
2. Method
To provide constraints on the galaxy-halo mapping at , we evaluate the median stellar mass at fixed host halo mass by direct abundance matching between the stellar and halo mass functions at a given redshift
| (1) |
with the halo masses defined as 200 times the critical density at redshift . The term refers to the host halo mass function, which we take from Tinker et al. (2008), as it can be adapted to diverse halo definitions, and it is well defined up to . Eq. 1 includes the subhalo term with unstripped mass , which we take from Behroozi et al. (2013). Neglecting the satellite term in Eq. 1 makes very little difference in the halo mass range of interest here, e.g., .
It is instead much more relevant to adopt the proper intrinsic scatter in stellar mass at fixed halo mass, ideally constrained from independent datasets, as larger values of induce a flatter relation above the break. Eq. 1 does not assume any scatter between stellar and halo mass, however one straightforward way to include it is as follows (see also, e.g., Behroozi et al. 2010). At any redshift of interest, we first fit the parameters of a two-power law relation defined as
| (2) |
to the raw output of Eq. 1. We then choose a value for the intrinsic scatter , and generate a large galaxy catalog by assigning to each (sub)halo extracted from the total halo mass function, a galaxy with stellar mass derived from a Gaussian distribution with mean given by the logarithm of Eq. 2, and dispersion (in dex). We finally vary in Eq. 2 to tune the high mass-end slope until the input stellar mass function in Eq. 1 is fully reproduced.
3. Data
The data on BCGs in groups and clusters considered in this letter are derived at from X-rays (Kravtsov et al., 2014), at from X-ray and weak lensing in COSMOS (Finoguenov et al., 2007; George et al., 2011; Huertas-Company et al., 2013b), at from IR (SpARCS; Lidman et al., 2012; van der Burg et al., 2013) and X-ray data (Strazzullo et al., 2010; Raichoor et al., 2011; Rettura et al., 2011), and at from the Cl1604 supercluster and other structures from the ORELSE survey (Ascaso et al., 2014).
As for clustering, we utilize the massive galaxies at the median redshift of from the CMASS sample of the Sloan Digital Sky Survey-III (SDSS-III) Baryon Oscillation Spectroscopic Survey (BOSS; Dawson et al., 2013). Stellar masses are from the Portsmouth SED-fitting (Maraston et al., 2013), originally derived assuming a Kroupa IMF (Kroupa, 2001). The host halo masses for these massive galaxies are estimated through the HOD modeling of the projected-space two-point correlation functions on scales from to , faithfully following the method laid out in Guo et al. (2014).
4. Results
4.1. The number density of massive galaxies
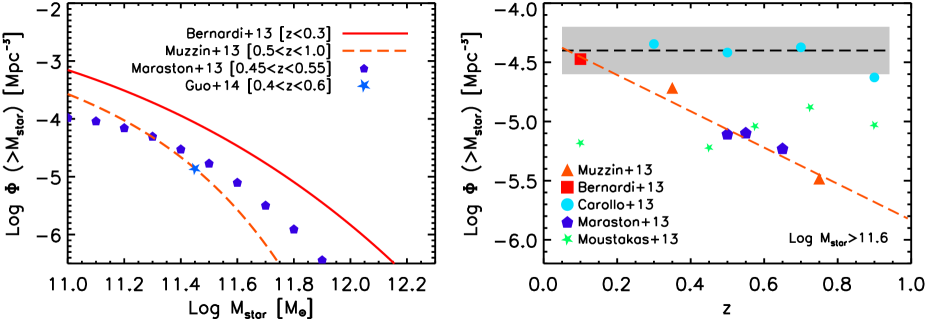
The first step towards defining a more secure mapping between stars and halos relies on properly measuring the stellar mass function of galaxies. The left panel of Fig. 1 shows the cumulative number density of galaxies from Bernardi et al. (2013) for the SDSS-DR7 main galaxy sample (; solid, red line). We used their estimate based on Sérsic-exponential light profile, which is considered by the authors to be the most realistic one to describe SDSS data (Bernardi et al., 2014). When compared to the COSMOS/UltraVISTA data by Muzzin et al. (2013) (long-dashed line), at the average redshift of , or the BOSS estimate from Guo et al. (2014) (star), or even the BOSS determination of the stellar mass function by Maraston et al. (2013) (diamonds), it would imply at face value a significant increase in the number density of massive galaxies towards low redshifts.
The right panel of Fig. 1 focuses on the number density evolution of galaxies above . For completeness, this panel also reports the measurements inferred by Moustakas et al. (2013) and Carollo et al. (2013), which would instead suggest a negligible evolution since . Moustakas et al. (2013) is well consistent with the stellar mass function by Maraston et al. (2013). Carollo et al. (2013) do not subtract stellar mass losses from the total masses, thus explaining at least part of the inconsistency with other determinations.
Overall, the right panel of Fig. 1 brackets the possible evolutionary paths since for the number density of massive galaxies, from a non evolving scenario (black, long-dashed line), to a fast evolving one (orange, dashed line). Most relevant measurements broadly fall within these sequences (e.g., Ilbert et al., 2013). The exact determination of the evolution and normalization of the high-mass end of the stellar mass function is limited by photometric and spectral systematics in the determination of stellar masses, as well as possible incompleteness and/or cosmic variance issues (e.g., Marchesini et al., 2009; Bernardi et al., 2010, 2013; Ilbert et al., 2013; Muzzin et al., 2013). In the following, we will evaluate the stellar mass-halo mass relation considering both of these extreme cases, and, by direct comparison with independent data sets, namely large scale clustering, set constraints on plausible evolutionary paths for the most massive galaxies in light of current estimates of the stellar mass function.
4.2. The stellar mass-halo mass relation
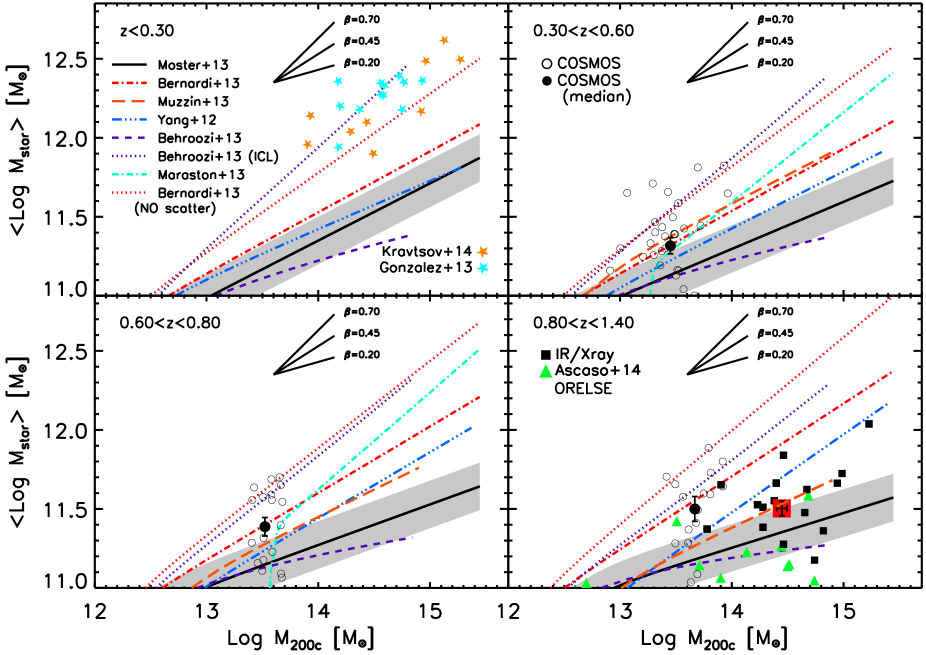
Fig. 2 shows the median stellar mass as a function of host halo mass relation for central galaxies evaluated at (upper left), (upper right), (lower left), (lower right), for different models. The dot-dashed, red lines are obtained by inserting in Eq. 1 the Bernardi et al. (2013) stellar mass function, assumed to be constant up to , and inclusive of a scatter of dex in stellar mass at fixed halo mass. The dotted lines refer to the same model but without scatter.
The long-dashed, orange lines adopt instead the Muzzin et al. (2013) stellar mass function, only valid at , with an intrinsic scatter of dex. For completeness, we compare these results with three mappings from the recent literature, the Moster et al. (2013) median relation (solid, black lines), with its error bar (gray area), the Yang et al. (2012) relation (dot-dashed, blue lines), and the Behroozi et al. (2013) model (dashed, purple lines). Other recent works mostly lie within the Moster et al. (2013) uncertainty region (e.g., Leauthaud et al., 2012). For completeness, we also show with purple dotted lines, the Behroozi et al. (2013) model inclusive of the total intra-cluster light.
Overall, most of the recent estimates of the stellar-halo mass relation tend to be discrepant with respect to direct central galaxy mass measurements in groups and clusters. All the available data collected in this work in fact, although with a large dispersion, tend to lie, on average, above the Moster et al. (2013) uncertainty region, implying a steeper stellar-halo mass relation, with the high-mass end slope (Eq. 2) increasing from to . Such a discrepancy was already emphasized at by some groups (e.g., Kravtsov et al., 2014; Shankar et al., 2014). Kravtsov et al. (2014), in particular, recomputed abundance matching with the Bernardi et al. (2013) stellar mass function, finding a steeper relation above , broadly consistent with their direct nine BCG stellar and halo mass measurements (orange stars). Our own determinations of the stellar-halo mass relation via Eq. 1 based on the local Bernardi et al. (2013) stellar mass function without scatter (dotted, red lines in Fig. 2), are at broadly consistent with the Kravtsov et al. (2014) and Gonzalez et al. (2013) data at very high masses.
One of the primary cause of the discrepancies can be ascribed to the adoption of different input stellar mass functions. In particular, the Bernardi et al. (2013) stellar mass function, based on improved sky subtractions and modeling of the central galaxy light profile, is characterized by a significant boost in the abundance of the most massive galaxies, which in turn induces a steepening of the stellar mass-halo mass relation. Other factors contribute to the differences in Fig. 2. Moster et al. (2013), for example, took care in de-convolving their adopted stellar mass function by some systematic errors before applying Eq. 1, thus producing a flattening in the high-mass end of their inferred stellar mass-halo mass relation.
4.3. Independent constraints from clustering
Fig. 2 also reveals that at , a clear degeneracy exists between a model based on Muzzin et al. (2013), with an intrinsic scatter in stellar mass at fixed halo mass of dex (long-dashed, orange lines), and the one based on the Bernardi et al. (2013) stellar mass function with dex (dot-dashed, red lines). In fact, both models can potentially reproduce the COSMOS data, though the latter with larger scatter would imply a constant number density at least up to , at variance with the former. Irrespective of uncertainties on stellar masses, we discuss in this section how to use clustering to set a secure upper limit to .
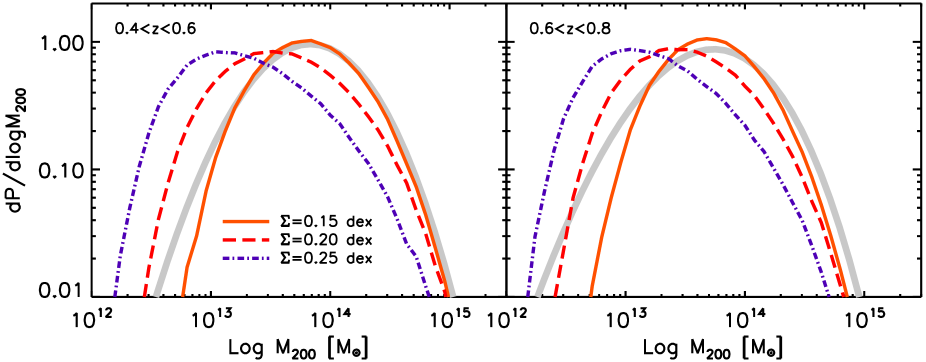
Fig. 3 displays with gray bands the Guo et al. (2014) HOD host halo mass distributions for central galaxies111Given the numerous complexities and variables at play in properly modeling satellites in abundance matching, e.g., redshift of infall, effect of environment, etc… (e.g., Neistein et al., 2011; Yang et al., 2012), we here discuss predictions for only central galaxies, and focus on the large-scale clustering and bias. The fraction of satellites in our stellar mass range is anyway very small (Guo et al., 2014). with stellar mass above (Kroupa IMF) at (left) and (right) inferred from the BOSS CMASS clustering measurements (Sect. 3). For the stellar mass of interest here, the galaxy sample is almost complete and the tiny fraction of missing galaxies due to the CMASS sample selections have negligible effects on the clustering measurements (Maraston et al., 2013; Guo et al., 2014). We compare the BOSS results with the abundance matching model based on the Muzzin et al. (2013) stellar mass function, which perfectly matches the cumulative number density adopted by Guo et al. (2014) (left panel of Fig. 1). At each redshift of interest we generate a mock halo catalog extracted from the halo mass function, and populate the halos with galaxies through the stellar mass-halo mass relation based on Muzzin et al. (2013) with a given dispersion .
Our results are shown in Fig. 3 for three different values of the scatter dex, as labeled. Consistently with the reference HOD model, all our mock catalogs have halo masses defined as 200 times the background density at the redshift of interest, and matched to the stellar mass cut in BOSS. Models based on scatters larger than dex, inevitably map galaxies at fixed stellar mass to host halo masses significantly lower than that inferred from clustering measurements. A larger scatter tends to overall flatten the relation above the break. However, increasing the scatter also includes lower-mass, more numerous halos in samples defined by stellar mass thresholds, thus effectively lowering the median halo mass at fixed stellar mass.
The lower scatter of dex is fully consistent with the inferred scatter ( at and at ) in the HOD model, which describes the scatter in the host halo mass distribution for the stellar mass sample. The scatter can be converted into through when assuming a power-law relation of (Zheng et al., 2007), with as found for Muzzin et al. (2013, cfr. Fig. 2). Our results of a low scatter are in line with and extend several previous estimates (e.g., More et al., 2009; Moster et al., 2010; Leauthaud et al., 2012; Yang et al., 2012; Rodriguez-Puebla et al., 2014).
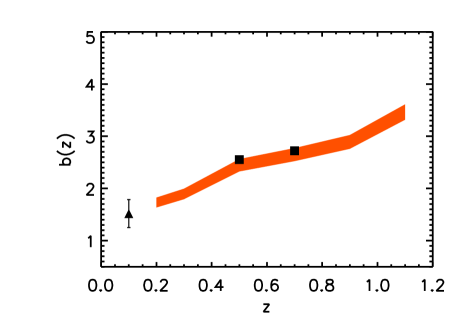
Analogously, the low-scatter model is fully consistent with the predicted large scale bias as a function of redshift (Fig. 4) derived by Guo et al. (2014) from BOSS data (filled squares), all defined for galaxies above . The colored contour defines the systematic uncertainty associated to the Sheth et al. (2001) and Tinker et al. (2005) biases. For completeness, in the same Fig. 4 we also report the bias (filled triangle) extracted from the Yang et al. (2007) catalogue, and matched to the Bernardi et al. (2014) SDSS revised stellar masses (see also Huertas-Company et al. 2013a and Shankar et al. 2014).
Our result on a low scatter in the stellar-halo mass relation is independent of systematics in stellar masses, at least for central galaxies. In fact, any error in stellar mass will equally propagate in the cumulative number density and connected HOD clustering modeling. Higher stellar masses, for example, will induce larger number densities and proportionally lower, large-scale characteristic correlation lengths (thus lower median host halo masses) above a fixed limit in stellar mass (Bernardi et al., 2013). Our stellar-halo median relation, based on Eq. 2, will also map galaxies to lower host halo masses, but will still require a low scatter to fully match the HOD results.
5. Discussion
In this letter we found significant evidence for:
-
•
a steeper stellar mass-halo mass relation with instead of from previous works;
-
•
a low scatter dex in stellar mass at fixed host halo mass, at least up to .
Our results can potentially set valuable constraints to the viable evolutionary paths of massive galaxies.
We first take the Bernardi et al. (2013) stellar mass function as the reference, as it well matches all local data on massive BCGs (upper left panel of Fig. 2). A steadily decreasing number density of massive galaxies at (e.g., Muzzin et al., 2013, right panel of Fig. 1), would then, at face value, be consistent with most of the available constraints on the group and cluster centrals, keeping dex to match the HOD halo mass distributions inferred from the BOSS clustering measurements (Fig. 3).
Another extreme case is forcing the Bernardi et al. (2013) number density of massive galaxies to be constant up to (e.g., Carollo et al., 2013, right panel of Fig. 1). However, the latter model, coupled to the need for a negligible scatter , would imply a systematic overestimate of a factor of in the median BCG stellar mass, as currently measured in clusters at for (red dotted line versus red square in the bottom right panel of Fig. 2), and an overestimate of a factor of the total stellar plus intra-cluster light model by Behroozi et al. (2013; purple dotted lines in Fig. 2).
Irrespective of the systematics in the stellar mass function, current BCG mass determinations and HOD clustering measurements, may favor an increase of a factor of a few since in the number density of the most massive galaxies. This can be partly induced by a parallel growth in the median stellar mass. Independent semi-empirical studies indeed suggest an increase in stellar mass by a factor of since (Zheng et al., 2007; Lidman et al., 2013; Ascaso et al., 2014; Marchesini et al., 2014, e.g.,). As supported by state-of-the-art hierarchical galaxy evolution models (e.g., De Lucia et al., 2006; Shankar et al., 2013), a non-negligible contribution to this mass growth can be explained by minor and major mergers. The latter, in particular, might be the ones responsible for the steepening in the high mass-end of the scaling relations characterizing early-type galaxies (e.g., Bernardi et al., 2011b).
References
- Ascaso et al. (2014) Ascaso, B., Lemaux, B. C., Lubin, L. M., et al. 2014, MNRAS, 442, 589
- Behroozi et al. (2010) Behroozi, P. S., Conroy, C., & Wechsler, R. H. 2010, ApJ, 717, 379
- Behroozi et al. (2013) Behroozi, P. S., Wechsler, R. H., & Conroy, C. 2013, ApJ, 770, 57
- Bernardi et al. (2013) Bernardi, M., Meert, A., Sheth, R. K., et al. 2013, MNRAS, 436, 697
- Bernardi et al. (2014) Bernardi, M., Meert, A., Vikram, V., et al. 2014, MNRAS, 443, 874
- Bernardi et al. (2011a) Bernardi, M., Roche, N., Shankar, F., & Sheth, R. K. 2011a, MNRAS, 412, 684
- Bernardi et al. (2011b) —. 2011b, MNRAS, 412, L6
- Bernardi et al. (2010) Bernardi, M., Shankar, F., Hyde, J. B., et al. 2010, MNRAS, 404, 2087
- Carollo et al. (2013) Carollo, C. M., Bschorr, T. J., Renzini, A., et al. 2013, ApJ, 773, 112
- Chabrier (2003) Chabrier, G. 2003, PASP, 115, 763
- Dawson et al. (2013) Dawson, K. S., Schlegel, D. J., Ahn, C. P., et al. 2013, AJ, 145, 10
- De Lucia et al. (2006) De Lucia, G., Springel, V., White, S. D. M., Croton, D., & Kauffmann, G. 2006, MNRAS, 366, 499
- Finoguenov et al. (2007) Finoguenov, A., Guzzo, L., Hasinger, G., et al. 2007, ApJS, 172, 182
- George et al. (2011) George, M. R., Leauthaud, A., Bundy, K., et al. 2011, ApJ, 742, 125
- Gonzalez et al. (2013) Gonzalez, A. H., Sivanandam, S., Zabludoff, A. I., & Zaritsky, D. 2013, ApJ, 778, 14
- Guo et al. (2014) Guo, H., Zheng, Z., Zehavi, I., et al. 2014, MNRAS, 441, 2398
- Huertas-Company et al. (2013a) Huertas-Company, M., Shankar, F., Mei, S., et al. 2013a, ApJ, 779, 29
- Huertas-Company et al. (2013b) Huertas-Company, M., Mei, S., Shankar, F., et al. 2013b, MNRAS, 428, 1715
- Ilbert et al. (2013) Ilbert, O., McCracken, H. J., Le Fèvre, O., et al. 2013, A&A, 556, A55
- Kravtsov et al. (2014) Kravtsov, A., Vikhlinin, A., & Meshscheryakov, A. 2014, ArXiv e-prints, arXiv:1401.7329 [astro-ph.CO]
- Kroupa (2001) Kroupa, P. 2001, MNRAS, 322, 231
- Leauthaud et al. (2012) Leauthaud, A., Tinker, J., Bundy, K., et al. 2012, ApJ, 744, 159
- Lidman et al. (2012) Lidman, C., Suherli, J., Muzzin, A., et al. 2012, MNRAS, 427, 550
- Lidman et al. (2013) Lidman, C., Iacobuta, G., Bauer, A. E., et al. 2013, MNRAS, 433, 825
- Maraston et al. (2013) Maraston, C., Pforr, J., Henriques, B. M., et al. 2013, MNRAS, 435, 2764
- Marchesini et al. (2009) Marchesini, D., van Dokkum, P. G., Förster Schreiber, N. M., et al. 2009, ApJ, 701, 1765
- Marchesini et al. (2014) Marchesini, D., Muzzin, A., Stefanon, M., et al. 2014, ArXiv e-prints, arXiv:1402.0003 [astro-ph.CO]
- More et al. (2009) More, S., van den Bosch, F. C., & Cacciato, M. 2009, MNRAS, 392, 917
- Moster et al. (2013) Moster, B. P., Naab, T., & White, S. D. M. 2013, MNRAS, 428, 3121
- Moster et al. (2010) Moster, B. P., Somerville, R. S., Maulbetsch, C., et al. 2010, ApJ, 710, 903
- Moustakas et al. (2013) Moustakas, J., Coil, A. L., Aird, J., et al. 2013, ApJ, 767, 50
- Muzzin et al. (2013) Muzzin, A., Marchesini, D., Stefanon, M., et al. 2013, ApJ, 777, 18
- Neistein et al. (2011) Neistein, E., Li, C., Khochfar, S., et al. 2011, MNRAS, 416, 1486
- Raichoor et al. (2011) Raichoor, A., Mei, S., Nakata, F., et al. 2011, ApJ, 732, 12
- Reddick et al. (2013) Reddick, R. M., Wechsler, R. H., Tinker, J. L., & Behroozi, P. S. 2013, ApJ, 771, 30
- Rettura et al. (2011) Rettura, A., Mei, S., Stanford, S. A., et al. 2011, ApJ, 732, 94
- Rodriguez-Puebla et al. (2014) Rodriguez-Puebla, A., Avila-Reese, V., Yang, X., et al. 2014, ArXiv e-prints, arXiv:1408.5407
- Shankar et al. (2013) Shankar, F., Marulli, F., Bernardi, M., et al. 2013, MNRAS, 428, 109
- Shankar et al. (2014) Shankar, F., Mei, S., Huertas-Company, M., et al. 2014, MNRAS, 439, 3189
- Sheth et al. (2001) Sheth, R. K., Hui, L., Diaferio, A., & Scoccimarro, R. 2001, MNRAS, 325, 1288
- Silk et al. (2013) Silk, J., Di Cintio, A., & Dvorkin, I. 2013, ArXiv e-prints, arXiv:1312.0107 [astro-ph.CO]
- Strazzullo et al. (2010) Strazzullo, V., Rosati, P., Pannella, M., et al. 2010, A&A, 524, A17
- Tinker et al. (2008) Tinker, J., Kravtsov, A. V., Klypin, A., et al. 2008, ApJ, 688, 709
- Tinker et al. (2005) Tinker, J. L., Weinberg, D. H., Zheng, Z., & Zehavi, I. 2005, ApJ, 631, 41
- van der Burg et al. (2013) van der Burg, R. F. J., Muzzin, A., Hoekstra, H., et al. 2013, A&A, 557, A15
- van der Wel et al. (2009) van der Wel, A., Rix, H.-W., Holden, B. P., Bell, E. F., & Robaina, A. R. 2009, ApJ, 706, L120
- Weinberg et al. (2013) Weinberg, D. H., Bullock, J. S., Governato, F., Kuzio de Naray, R., & Peter, A. H. G. 2013, ArXiv e-prints, arXiv:1306.0913 [astro-ph.CO]
- Yang et al. (2007) Yang, X., Mo, H. J., van den Bosch, F. C., et al. 2007, ApJ, 671, 153
- Yang et al. (2012) Yang, X., Mo, H. J., van den Bosch, F. C., Zhang, Y., & Han, J. 2012, ApJ, 752, 41
- Zheng et al. (2007) Zheng, Z., Coil, A. L., & Zehavi, I. 2007, ApJ, 667, 760