The AGN Black Hole Mass Database
Abstract
The AGN Black Hole Mass Database is a compilation of all published spectroscopic reverberation-mapping studies of active galaxies. We have created a public web interface, where users may get the most up-to-date black hole masses from reverberation mapping for any particular active galactic nucleus (AGN), as well as obtain the individual measurements upon which the masses are based and the appropriate references. While the database currently focuses on the measurements necessary for black hole mass determinations, we also plan to expand it in the future to include additional useful information, such as host-galaxy characteristics. New reverberation mapping results will also be incorporated into the database as they are published in peer-refereed journals.
Subject headings:
galaxies: active — galaxies: nuclei — galaxies: Seyfert1. Introduction
Variability has long been recognized as one of the defining characteristics of active galactic nuclei (AGNs) (Matthews & Sandage, 1963; Smith & Hoffleit, 1963) and was also one of the key observational properties that led to our current physical description of AGNs as accreting supermassive black holes (Salpeter, 1964). While the nuclear activity is interpreted as a clear signature of a supermassive black hole, AGNs are generally too distant for even the largest telescopes to spatially resolve the gravitational influence of the black hole and determine its mass with current technology. Instead, AGN black hole masses are most often directly determined through time resolution of the AGN variability, rather than spatial resolution, in a technique known as reverberation mapping (Blandford & McKee, 1982).
Reverberation mapping measures the time delay between changes in the continuum emission (likely arising from the accretion disk) and the response to these changes in the broad emission lines (arising from the photoionized broad line region, BLR). The time delay is effectively the mean light travel time between the two regions and thus a measure of distance at spatially-unresolvable scales ( pc in typical nearby Seyferts). As the accretion disk is generally expected to be much smaller than the BLR, the time delay between continuum fluctuations and the response of a specific broad emission line gives the responsivity-weighted mean radius of the BLR for that particular emission species.
One of the key discoveries from the first reverberation mapping campaigns was that the time delay (or BLR size) was smaller by a factor of than previously expected from photoionization models (Peterson et al., 1985). Early on, it was also discovered that, as expected, different emission lines have different mean time delays, evidencing ionization stratification within the BLR gas (Clavel et al., 1991; Peterson et al., 1991; Dietrich et al., 1993; Maoz et al., 1993). More highly ionized species have shorter time delays relative to more neutral species, and their line widths are larger, evidencing larger line-of-sight gas velocities. In fact, a virial relationship is observed between time delays and line widths of different emission species in a single object: time delays are inversely proportional to the square of the line widths (e.g., Peterson & Wandel 1999, 2000; Onken & Peterson 2002). Combining the time delay measurement with the line width therefore gives a measure of the black hole mass, albeit modulo a scaling factor that encompasses the unknown geometry and dynamics of the gas in the broad line region (Wandel et al., 1999).
As our knowledge of AGN physics has evolved, so have the observing requirements for reverberation campaigns and the techniques used to analyze them. Peterson et al. (2004) undertook a massive homogeneous reanalysis of all the existing reverberation datasets. One result from this reanalysis was that many of the early datasets were severely undersampled in their time resolution. While not surprising given the original expectation that the broad line region was much larger, this finding suggested that the time delays, and therefore black hole masses, from these datasets were unreliable. Since 2004, there have been many new reverberation campaigns, some specifically designed to replace early campaigns with poor time sampling, and others to extend the sample to include new objects. As a result, for those astronomers not closely linked to the reverberation mapping community, it can be confusing or unclear where to find the best determination of the black hole mass for any specific AGN, or whether such a measurement even exists.
In response, we undertook to compile all the existing reverberation measurements in a single database with a homogeneous format and to create a simple web interface for use by the community. The result is described in this manuscript.
2. The Reverberation Sample
The large investment of time and resources required for reverberation mapping campaigns leads to the current moderate size of the sample. There are 63 AGNs with successful reverberation campaigns in the published literature, and the sample continues to evolve with time. Most of these AGNs are located in the nearby Universe () and are therefore some of the most well-studied AGNs at all wavelengths. However, a handful of AGNs at higher redshifts also have reverberation measurements, with the highest redshift currently held by S5 0836+71 at (Kaspi et al., 2007).
There are two reasons why the sample is heavily skewed towards nearby AGNs: (1) the large amount of observing time required for a reverberation campaign generally limits the observations to small- and medium-aperture telescopes in the 1.0-m to 4.0-m class, but the necessity of high signal-to-noise spectra () imposes a relatively bright limit on the apparent magnitude of the target AGNs; and (2) the observed time delay is a function of the intrinsic luminosity of the AGN (e.g., Bentz et al. 2013) as well as its distance from us: very luminous quasars have long time delays that are exacerbated by time dilation as the photons traverse our expanding Universe. The observed time delay may be several years, leading to the necessity for decade-long monitoring campaigns (e.g., Kaspi et al. 2000, 2007). Bright nearby Seyferts may be successfully monitored over a single observing season. Resource constraints, as well as student, postdoc, and junior faculty timelines, therefore generally favor studies of nearby AGNs.
All of the AGNs in the Database are Type I or broad-lined AGNs, because the broad emission lines are the main focus of any spectroscopic reverberation mapping campaign. The objects span the range of observed Type I activity, including such well-studied AGNs as NGC 4395 (Seyfert 1.8), NGC 4748 a.k.a. Mrk 766 (narrow-line Seyfert 1), NGC 4151 (the prototypical Seyfert 1), 3C 390.3 (double-peaked very broad-lined and radio loud AGN) and PG 1226+023 a.k.a. 3C 273 (flat-spectrum radio quasar). The host galaxies also show a broad diversity, ranging from the bulgeless disk galaxy of NGC 4395, to typical massive spirals, both barred and unbarred, to elliptical galaxies. Many of the AGN hosts show signs of recent or ongoing merger activity (e.g., the tidal tail of Arp 151 or the ongoing merger of NGC 3227 with NGC 3226), but on the other hand, many do not.
Finally, while the vast majority of reverberation measurements in the literature focus on the optical regime, specifically the region around H , among the full sample there are measurements for every strong broad emission line between Ly and H , inclusive. In particular, many objects have reverberation measurements for rest-frame ultraviolet emission lines from International Ultraviolet Explorer campaigns that were carried out in the 1980s and 1990s. The Database includes all published measurements for all emission lines with reliable time lag measurements. We have not, however, included broad-band or photometric reverberation mapping results (including X-ray bands) in this compilation, as these measurements do not generally translate into a direct mass constraint.
3. The Database
The AGN Black Hole Mass Database is a SQL (Structured Query Language) database hosted at Georgia State University in downtown Atlanta, GA. It contains all AGNs with published spectroscopic reverberation mapping results published in refereed journals. At the time of writing this manuscript, there are 62 AGNs in the main database. For each of these AGNs, we have compiled the following general information (where available):
-
•
object name;
-
•
common alternate names;
-
•
coordinates of right ascension, declination, and redshift;
-
•
AGN activity classification;
-
•
Hubble Space Telescope optical (medium ) image of the host galaxy 111For clarity and ease of comparing host-galaxy features between objects, we do not include non-HST images nor do we include images with different central wavelengths. Only a handful of AGNs have no relevant image and no plans to acquire one in the near future.;
-
•
luminosity distance and angular diameter distance assuming a cosmology of km s-1 Mpc-1, , and .
Several ongoing studies are working to measure redshift-independent distances to the AGNs in this sample, and we plan to incorporate those results in the database when they are published.
In addition to the general information we have compiled for each AGN, we have included the following information (where available) from the reverberation mapping campaigns targeting each object:
-
•
each broad emission line with published reverberation measurements;
-
•
Julian date range of the reverberation campaign;
-
•
emission-line time delay measurement (in the rest-frame) relative to the continuum as determined from: (1) the peak of the cross-correlation function, , (2) the centroid of the cross-correlation function around the peak above some threshold value, , and (3) the maximum likelihood from JAVELIN (Zu et al., 2011) based on a damped random walk model of the continuum light curve and a reprocessed emission-line light curve, ;
-
•
emission line width in the root-mean-square residual spectrum (which highlights the variable part of the spectrum) as determined from: (1) the full-width at half maximum, FWHM, and (2) the second moment of the line profile, ;
-
•
references for the reverberation campaign and the time delay and line width measurements;
-
•
the mean luminosity of the AGN at rest-frame 5100 Å throughout the campaign, corrected for the contribution from host-galaxy starlight;
-
•
reference for the AGN luminosity.
The black hole masses are derived from a combination of the measurements recorded for each object, and so they are calculated on the fly as explained in the next section.
The successful measurement of a reverberation time delay requires not only careful planning, but also a bit of luck. AGNs that were strongly variable in the past may not be strongly variable while they are being monitored (cf. the monitoring results for Mrk 290 as described by Bentz et al. 2009 and Denney et al. 2009). Therefore, in some cases, campaigns were published that were unable to measure a reliable time delay between continuum and emission line variability (e.g., Ark 564, Shemmer et al. 2001). Furthermore, some measurements that were published in one study were reanalyzed (usually with updated techniques) and found to be unconstrained. Examples of this situation include many of the famous Seyfert galaxies among the NGC sample, e.g., NGC 3227, NGC 4051, NGC 4151. The first monitoring datasets for these objects, in particular, were prone to undersampling given that they were among the earliest reverberation targets and the observations were designed under the expectation that the broad line region was much more extended, and therefore that the observed time delays should be longer and require less fine sampling. Datasets such as we have described above have been listed in the database as “excluded results” with links to the appropriate manuscripts. We adopted the general approach to also list in “excluded results” any datasets which have all reported emission-line time delay measurements consistent with zero delay, as this is generally a sign of undersampling in the monitoring cadence. Datasets that contain multiple emission-line measurements where only some (not all) of the time delays are reported as being consistent with zero (e.g., He II as measured for Mrk 50 by Barth et al. 2011) are fully included in the main database. We believe this to be a fairly conservative level of quality flagging, and we leave more careful consideration of the quality of individual datasets to the user and his/her best judgement.
In short, at this time, the database is a summary of 95 published articles in peer-refereed journals with the results obtained for 74 individual AGNs. Twelve of these AGNs only have “excluded results” at this time. For the 62 AGNs with included datasets, there are 226 sets of reverberation measurements tabulated in the database. These are the basis for the determination of the black hole masses.
4. Black Hole Masses
Black hole masses are determined as:
| (1) |
where is taken to be and is taken to be , following Peterson et al. (2004), and and are the speed of light and the gravitational constant, respectively. While is often more tightly constrained than , is reported for significantly more datasets (209 versus 119). The factor is a dimensionless scaling factor of order unity that encapsulates the unknown geometry and dynamics of the broad line region gas. Typically, the population-averaged value of , denoted , is determined as the multiplicative factor needed by the reverberation masses to bring the relationship for AGNs into general agreement with that of the dynamical sample of quiescent galaxies (e.g., McConnell & Ma 2013). Values for range from (Onken et al., 2004) to (Graham et al., 2011), depending on the objects included and the specific measurements adopted for both samples (dynamical and reverberation). We adopt the Grier et al. (2013) value of as the default value for determination of , but allow the user to choose other values and recalculate the masses through the web interface (detailed in the next section). The uncertainties on the masses are based on the combination of measurement uncertainties for and only.
Many objects in the sample have measurements for multiple emission lines, and/or multiple measurements of the same emission line. We adopt the weighted average of the masses derived from the measurements of all emission lines as the default value of for each object, although we also provide the mass based only on measurements of H . Users who wish to determine the mass in some other way, for example using and FWHM for C IV only, will be able to do so with the information provided. We caution the user that, in general, other combinations of time delay and line width measurements will require the adoption of other values of (e.g., Collin et al. 2006).
In addition to the derived reverberation masses, we also include other direct mass measurements for the small number of objects where they are available. In particular, NGC 3227 and NGC 4151 both have determined from stellar dynamical modeling and from spatially-resolved gas dynamical modeling (Davies et al., 2006; Hicks & Malkan, 2008; Onken et al., 2014). A handful of other objects — Arp 151, Mrk 50, Mrk 1310, NGC 5548, NGC 6814, and SBS 1116+583A — have derived directly from dynamical modeling of high quality reverberation spectroscopic datasets (Pancoast et al., 2012, 2014). As more such measurements become available in the literature, they will be incorporated into the database.
5. The Web Interface
The information in the database is provided freely to the community through the web interface, which is located at http://www.astro.gsu.edu/AGNmass.
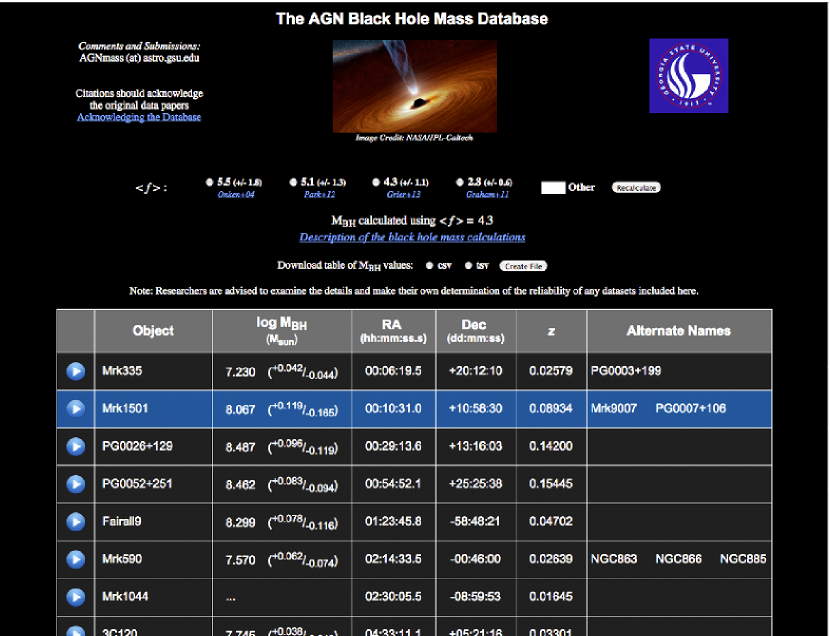
Figure 1 shows the front page that the user will encounter when visiting the interface to the database. All objects included in the database are listed with their default black hole mass calculations, coordinates, and common alternate names, so the user can quickly identify whether an object of interest is included (or not). Should the user prefer to adopt a different value of , buttons are provided at the top allowing all masses to be quickly recalculated with other commonly-adopted scaling factors, including a field where the user may type any value they wish to use. A short explanation of the mass calculations is provided at the bottom of the page, and is a reiteration of the information described in this manuscript in . Furthermore, the user may download the object table and black hole masses with the user’s current adopted value of as either a comma-separated values (csv) or tab-separated values (tsv) file.
If the user has javascript enabled in their browser, each row in the object table will be highlighted when it is moused over to help with object selection, as shown in Figure 1 for Mrk 1501. Detailed information for each object, including a table of all reverberation measurements, can be viewed by clicking on the button at the left of each row in the object table.
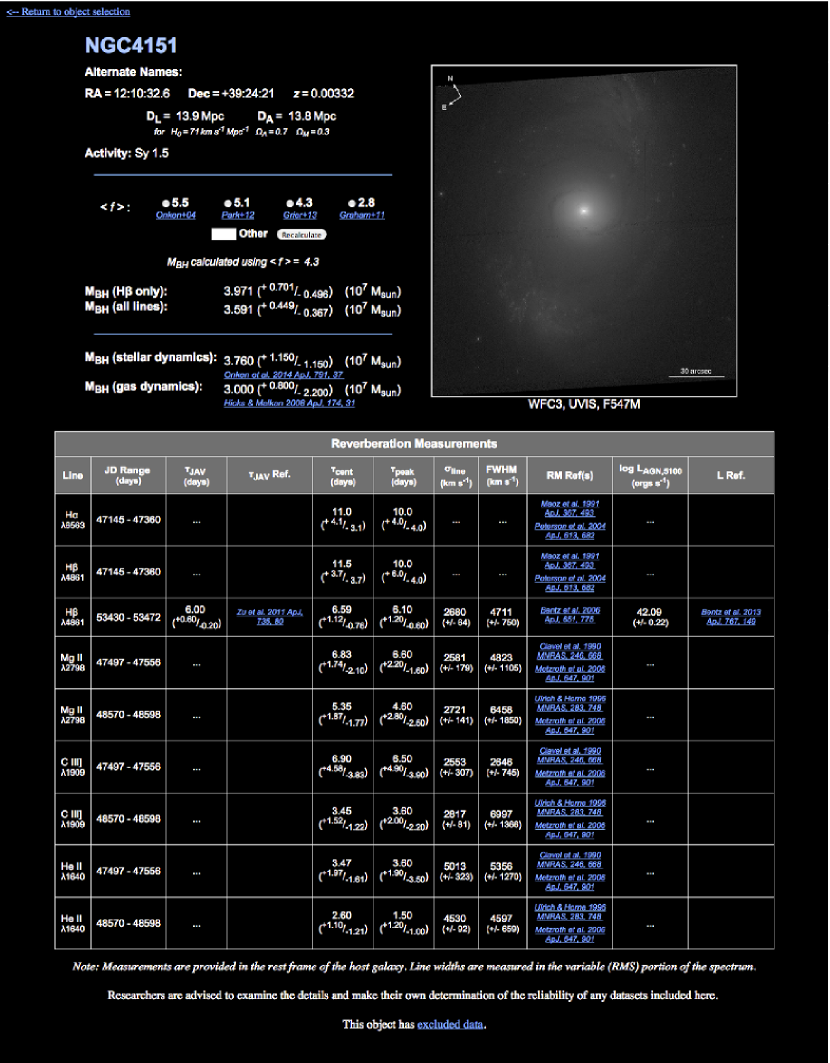
Figure 2 shows the page for an individual object with all the details currently recorded in the AGN Black Hole Mass Database. This includes the information that was provided on the main page in the object table, as well as the host-galaxy image, a table of reverberation measurements, and the other information described in and of this manuscript. The mass is again provided based on all measurements of all emission lines, with a default value of , but is also provided based only on measurements of H. The user is again able to recalculate the mass with different adopted values of .
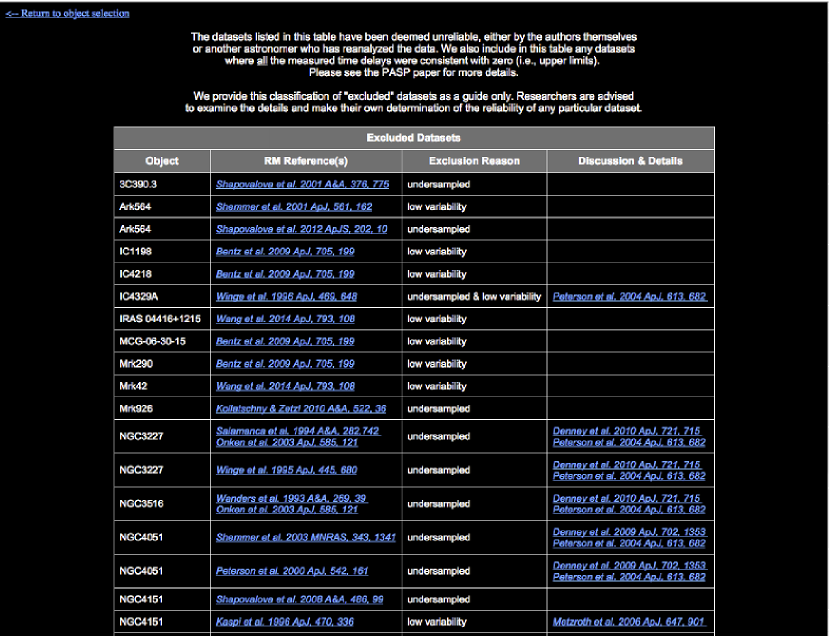
Excluded datasets are listed separately (Figure 3) and can be reached from a link on the front page below the main object table, or from a link on a detailed object page if that object has excluded data. We do not tabulate the numbers for these datasets, as they are untrustworthy and often unreported, but rather list the object, the reference describing the monitoring campaign, the reason the dataset was excluded, and any other reference that describes the quality of the dataset in more detail (oftentimes, a reanalysis of the original data, e.g., Peterson et al. 2004).
6. Future Updates
Reverberation mapping is a technique that has been exploited and refined over the last years, and it continues to be a standard tool for determination of black hole masses. Thus, the AGN Black Hole Mass Database will be a constantly-evolving compilation of spectroscopic reverberation mapping results. It is our intent to continue updating the database as a service to the community.
To that end, we invite authors of papers with new reverberation measurements to assist with this effort by sending copies of their published or in press manuscripts to agnmass@astro.gsu.edu. New results will be incorporated on a monthly basis once they have been published by a peer-refereed journal and have their final bibliographic identification. The date of the last update to the database can be found at the bottom of the main webpage.
We also plan to expand the database to include more information in the future. In particular, we are currently compiling relevant details about the AGN host galaxies, including the bulge stellar velocity dispersion, the bulge magnitudes, and the inclination of the galaxy disk (if a disk is present), and we plan to incorporate them into the database in the near future. Additional expansions are also likely to follow as time and resources permit.
7. Summary
We have compiled a homogeneous collection of all published reverberation mapping results and incorporated them into a SQL database, hosted at Georgia State University. We have also developed a public web interface for the database, allowing users to quickly identify objects with reverberation measurements and to identify the most up-to-date determinations of from these measurements. Additions to this compilation will be included as they enter the published literature. We also plan to incorporate other information of interest, including detailed measurements of host-galaxy characteristics, in the future.
References
- Barth et al. (2011) Barth, A. J., Pancoast, A., Thorman, S. J., et al. 2011, ApJ, 743, L4
- Bentz et al. (2013) Bentz, M. C., Denney, K. D., Grier, C. J., et al. 2013, ApJ, 767, 149
- Bentz et al. (2009) Bentz, M. C., Walsh, J. L., Barth, A. J., et al. 2009, ApJ, 705, 199
- Blandford & McKee (1982) Blandford, R. D., & McKee, C. F. 1982, ApJ, 255, 419
- Clavel et al. (1991) Clavel, J., et al. 1991, ApJ, 366, 64
- Collin et al. (2006) Collin, S., Kawaguchi, T., Peterson, B. M., & Vestergaard, M. 2006, A&A, 456, 75
- Davies et al. (2006) Davies, R. I., Thomas, J., Genzel, R., et al. 2006, ApJ, 646, 754
- Denney et al. (2009) Denney, K. D., Peterson, B. M., Pogge, R. W., et al. 2009, ApJ, 704, L80
- Dietrich et al. (1993) Dietrich, M., et al. 1993, ApJ, 408, 416
- Graham et al. (2011) Graham, A. W., Onken, C. A., Athanassoula, E., & Combes, F. 2011, MNRAS, 412, 2211
- Grier et al. (2013) Grier, C. J., Martini, P., Watson, L. C., et al. 2013, ApJ, 773, 90
- Hicks & Malkan (2008) Hicks, E. K. S., & Malkan, M. A. 2008, ApJS, 174, 31
- Kaspi et al. (2007) Kaspi, S., Brandt, W. N., Maoz, D., et al. 2007, ApJ, 659, 997
- Kaspi et al. (2000) Kaspi, S., Smith, P. S., Netzer, H., et al. 2000, ApJ, 533, 631
- Maoz et al. (1993) Maoz, D., et al. 1993, ApJ, 404, 576
- Matthews & Sandage (1963) Matthews, T. A., & Sandage, A. R. 1963, ApJ, 138, 30
- McConnell & Ma (2013) McConnell, N. J., & Ma, C.-P. 2013, ApJ, 764, 184
- Onken et al. (2004) Onken, C. A., Ferrarese, L., Merritt, D., et al. 2004, ApJ, 615, 645
- Onken & Peterson (2002) Onken, C. A., & Peterson, B. M. 2002, ApJ, 572, 746
- Onken et al. (2014) Onken, C. A., Valluri, M., Brown, J. S., et al. 2014, ApJ, 791, 37
- Pancoast et al. (2012) Pancoast, A., Brewer, B. J., Treu, T., et al. 2012, ApJ, 754, 49
- Pancoast et al. (2014) Pancoast, A., Brewer, B. J., Treu, T., et al. 2014, MNRAS, 445, 3073
- Peterson et al. (2004) Peterson, B. M., Ferrarese, L., Gilbert, K. M., et al. 2004, ApJ, 613, 682
- Peterson et al. (1985) Peterson, B. M., Meyers, K. A., Capriotti, E. R., et al. 1985, ApJ, 292, 164
- Peterson & Wandel (1999) Peterson, B. M., & Wandel, A. 1999, ApJ, 521, L95
- Peterson & Wandel (2000) —. 2000, ApJ, 540, L13
- Peterson et al. (1991) Peterson, B. M., Balonek, T. J., Barker, E. S., et al. 1991, ApJ, 368, 119
- Salpeter (1964) Salpeter, E. E. 1964, ApJ, 140, 796
- Shemmer et al. (2001) Shemmer, O., Romano, P., Bertram, R., et al. 2001,ApJ, 561, 162
- Smith & Hoffleit (1963) Smith, H. J., & Hoffleit, D. 1963, Nature, 198, 650
- Wandel et al. (1999) Wandel, A., Peterson, B. M., & Malkan, M. A. 1999, ApJ, 526, 579
- Zu et al. (2011) Zu, Y., Kochanek, C. S., & Peterson, B. M. 2011, ApJ, 735, 80