Particle Discrimination in TeO2 Bolometers using Light Detectors read out by Transition Edge Sensors
Abstract
An active discrimination of the dominant -background is the prerequisite for future neutrinoless double-beta decay experiments based on TeO2 bolometers. We investigate such -particle rejection in cryogenic TeO2 bolometers by the detection of Cherenkov light. For a setup consisting of a massive TeO2 crystal (285 g) and a separate cryogenic light detector, both using transition edge sensors as temperature sensors operated at around 10 mK, we obtain an event-by-event identification of e/- and -events. We find in the energy interval ranging from 2400 keV to 2800 keV and covering the Q-value of the neutrinoless double-beta decay of 130Te a separation of the means of the two populations of 3.7 times their width.
I Introduction
The postulation of the neutrino in 1930 by W. Pauli was followed by many decades of intensive experimental investigations, though still today important properties of this particle are unknown. Oscillation experiments have confirmed that the three families of neutrinos mix and that at least two of them have a finite mass. However, information on the absolute mass scale, the ordering of these masses, charge conjugation properties and lepton number conservation is still missing.
In case neutrinos are Majorana particles Majorana , which implies the presence of physics beyond the Standard Model of particle physics, an extremely rare process should be observable, namely the so-called Neutrinoless Double-Beta Decay (0DBD) DBD : in a 0DBD the parent nucleus decays by the simultaneous emission of two beta-particles only. As no neutrinos are emitted, the full energy of the decay, the Q-value, is shared between the two electrons. The evidence of 0DBD would prove that neutrinos are their own anti-particles and that lepton number is not conserved. Also, constraints would be set on the mass scale of the neutrinos.
Numerous experiments are searching for this process with the distinctive signature of a monochromatic line at the Q-value of the decay - the combined energy of the two simultaneously emitted electrons.
Low temperature bolometers are ideal detectors for such surveys: crystals can be grown with a variety of interesting DBD-emitters DBDemitter , and multi-kg detectors massive-tellurium can be operated with excellent energy resolution (0.1-0.2%) at the Q-value CUORE0 .
Up to now, low temperature bolometers searching for 0DBD were mainly using TeO2 crystals CUORE0 ; CUORICINO , which show very good mechanical and thermal properties TeO2Crystals , have a very large natural isotopic abundance of the candidate isotope 130Te (34.2% 130TeO ) and, most importantly, are produced at industrial scale.
At present, radioactive surface contamination is the key-issue TeO2bck1 ; TeO2bck2 that may limit the sensitivity of tonne scale cryogenic bolometer experiments like CUORE CUORE : -particles can loose a fraction of their initial energy while passing through the bulk of the material surrounding the detector before interacting in the bolometer. These so-called degraded -particles show a flat energy spectrum ranging from the Q-value of the -decay (several MeV) down to threshold energy, thereby possibly creating background within the region of interest for 0DBD TeO2bck3 .
For next-generation bolometric 0DBD experiments beyond CUORE CUOREIHE , the only way to eliminate this -background is to identify the interacting particles. In case of non-scintillating crystals like TeO2 the discrimination could be obtained by measuring the Cherenkov light emitted by electrons as suggested in Tabarelli . Alpha-particles of few MeV have kinetic energies below the threshold for the creation of Cherenkov light. Since the expected energy emitted in form of Cherenkov photons from electron interactions is (100 eV) Tabarelli , light detectors with a low energy threshold and an excellent energy resolution should be employed.
The first published measurement on the detection of Cherenkov light in this context was carried out on a 116 g TeO2 crystal, demonstrating that -particles can be discriminated Cerenkov1 . Very recently an event-by-event discrimination was obtained with a very small TeO2 bolometer based on a 23 g crystal Willers . Measurements on a massive crystal (750 g) demonstrate that difficulties may substantially increase with crystal size and that light detectors with a threshold as low as some 10 eV are required Cerenkov2 .
In this work we report the results from a measurement of the Cherenkov light emitted by a 285 g TeO2 bolometer. The light absorber is read out by a Transition Edge Sensor (TES) of the same type as used in the CRESST dark matter search CRESST . With this set-up we demonstrate for the first time an effective event-by-event discrimination on a massive TeO2 crystal.
II Experimental Set-up
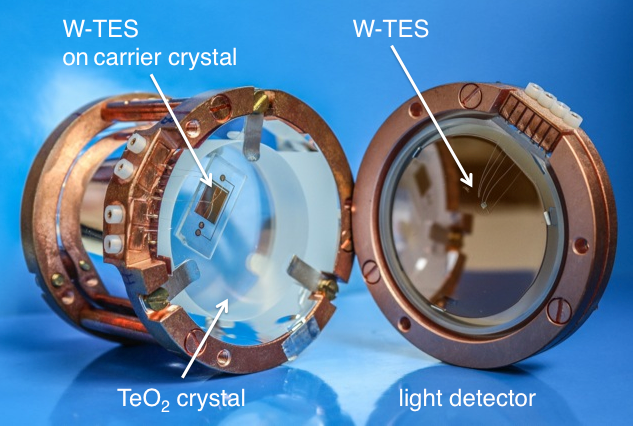
The TeO2 crystal used in this work is a cylinder (40 mm diameter and height, 285 g in weight). The mantle surface of the crystal was mechanically roughened to increase the collection of Cherenkov light Danevich . The two flat surfaces are of optical quality, polished with a 1 mm chamfer on edges. The crystal is operated as a bolometer at about 10 mK and read out by a W-TES. TESs are highly sensitive thermometers which allow to detect tiny temperature excursions (K) caused by particle interactions in the crystal, by measuring the change in the resistance of the TES. In our case, the sensor consists of a thin tungsten film (200 nm, referred to as W-TES) stabilized in its transition between the normal conducting and the superconducting phase by a dedicated heater. The heater consists of a gold stitch bond (gold wire with diameter of 25 m), which is bonded to the tiny gold structure on the TES also used as thermal link. Since a direct evaporation onto the TeO2 crystals did not succeed, a composite detector design was used instead CompositeDet : a small (20x10x2) mm3 cadmium tungstate carrier crystal (CdWO4), equipped with the W-TES, was attached onto one of the flat surfaces of the TeO2 by vacuum grease (DowCorning UHV). The reason for choosing a CdWO4 crystal as carrier of the W-TES is discussed in section III.
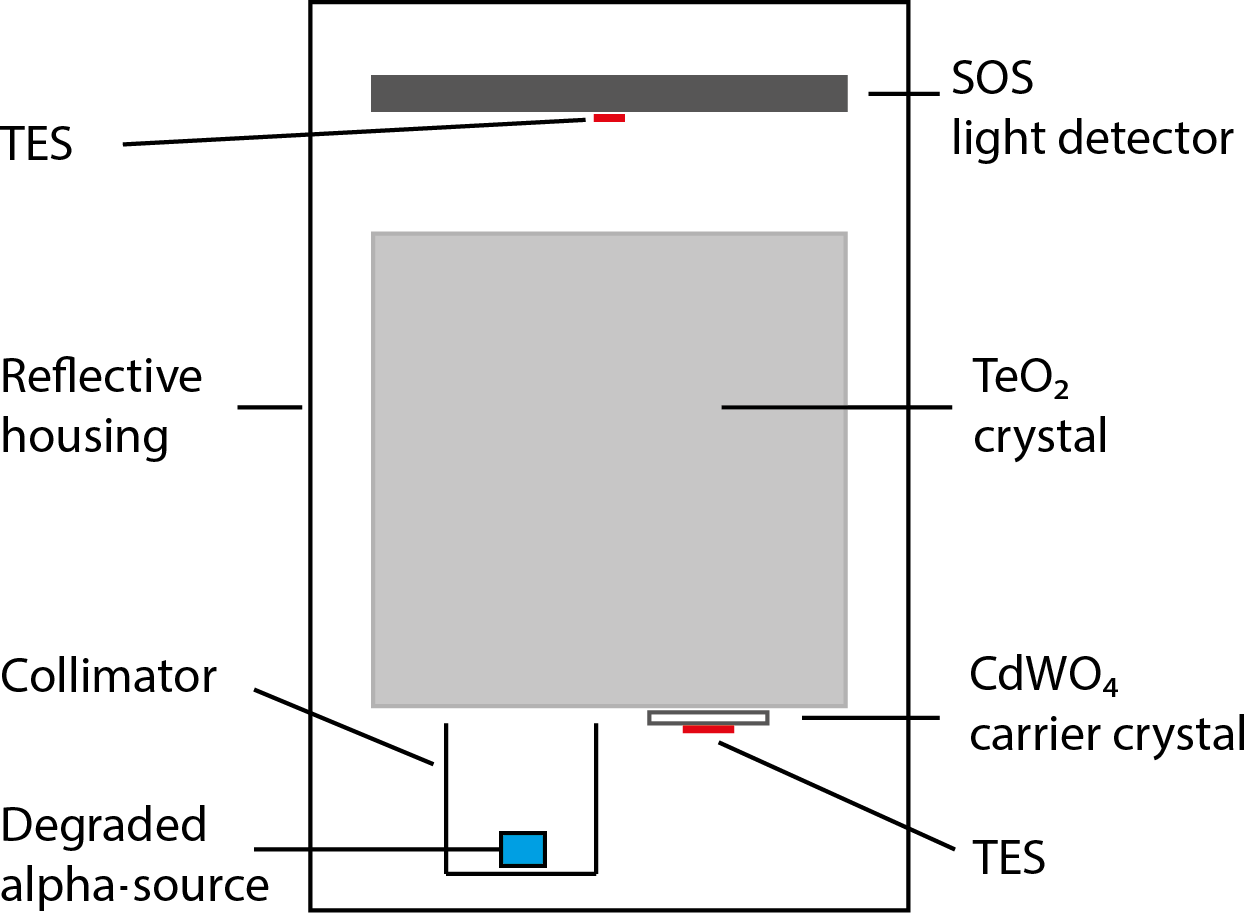
One polished side of the TeO2 crystal is facing a cryogenic light detector of CRESST-II type CRESST , which consists of a thin sapphire disc (thickness of 460 m) with a diameter of 40 mm, equal to the diameter of the crystal. Since pure sapphire is optically transparent a 1 m thick layer of silicon is epitaxially grown onto the sapphire disc. Light detectors of this type we refer to as SOS (Silicon on Sapphire). Also the light absorber is read out by a W-TES, which in shape and dimension is optimized for the light detector and different to the TES design of the massive absorber crystal. Crystal and light detector are enclosed in a reflective housing (VM2002 Radiant Mirror Film). A photograph of the set-up is shown in Figure 1.
To study the discrimination capability of e/-events from -particles a source of degraded s of 238U is used. The source, as depicted in Figure 2, is arranged such to avoid any line of sight to the TES and to the surrounding.
The measurement was carried out in the test facility of the Max-Planck Institute for Physics. The facility is located at the Laboratori Nazionali del Gran Sasso (LNGS), a deep underground site (3650 m.w.e.) in central Italy and consists of a dilution refrigerator which is surrounded by about 20 cm of low background lead to shield the environmental e/-radioactivity. A platform attached by a spring to the mixing chamber of the dilution unit mechanically decouples the detector from the cryogenic facility in order to reduce microphonic noise. The TESs are operated with a commercial dc-SQUID electronics (Applied Physics Systems). The hardware triggered signals are sampled in a 409 ms window with a sampling rate of 10 kHz. Both detectors are always read out simultaneously, independent of which channel triggered.
More detailed descriptions of the DAQ, the control of detector stability as well as the pulse height evaluation and energy calibration procedures are given in CRESST09 ; CRESST05 .
III Detector Performance
In this section we report on pulse-shape parameters and energy resolution of the TeO2 bolometer and of its light detector.
III.1 TeO2 Crystal
| Material | Ref. | |||
|---|---|---|---|---|
| [km/s] | [km/s] | [K] | ||
| TeO2 | 2.2 | 3.2 | 232 | Barucci , Handbook |
| CaWO4 | 2.45 | 4.76 | 335 | Senyshyn , Head |
| Al2O3 | 6.1 | 11.2 | 1041 | Proebst , Handbook |
The measured signals in the TeO2 bolometer are very small in comparison to other inorganic scintillating materials both read out by a W-TES of the type as used in this work Proebst ; Schaeffner . This behavior can be attributed to the acoustic mismatch between TeO2 and the CdWO4 crystal carrying the W-TES. A particle interaction in an inorganic anisotropic single crystal as, e.g. TeO2, creates high frequency phonons (THz) with energies of a few meV. As these energies are much higher than thermal energies at the temperature of detector operation (about 10 mK) corresponding to 1 eV, these phonons are called non-thermal phonons.
This initial phonon population is not stable and very quickly decays to a distribution with a mean frequency of few 100 GHz Proebst . The fast decay is followed by a period of few milliseconds where the distribution of average phonon frequencies remains quasi constant. During this time the phonons spread ballistically over the volume of the crystal.
These phonons may get absorbed directly in the TES, thereby creating the fast so-called non-thermal part of the detected signal. The TES relaxes back to equilibrium temperature via its thermal link to the heat bath (dominant process), but also via re-emission of thermal phonons into the crystal. Phonons that thermalize in the crystal by inelastic scattering (e.g. on the surface or on crystal defects) also lead to an increase in the crystal’s temperature and cause the slow thermal component of the detected signal. Typically, the fast component dominates the signal at very low operating temperatures, whereas the slow component is suppressed as a consequence of the weak coupling between electrons and phonons in the TES. Thus, being operated in the bolometric mode Proebst , the pulse height of detected signals is determined by the flux of non-thermal phonons and by the thermal coupling of the TES to the heat bath.
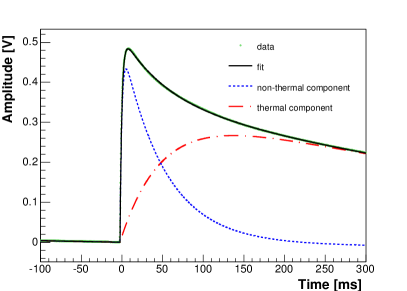
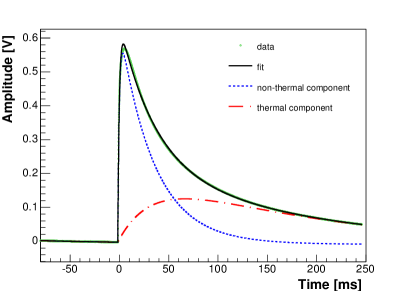
The left plot of Figure 3 shows a fit to a pulse averaged over a set of (100) pulses from 2615 keV -events (208Tl-line) in the TeO2 crystal. The pulse was fit with two exponentials using the model of cryogenic detectors Proebst : the signal’s non-thermal component (dotted line) and the thermal component (dashed line) are indicated. The sum of both components is shown as black solid line. For comparison, the right hand side of Figure 3 shows the result of such a fit to the events from 122 keV s (57Co calibration) in a CdWO4 crystal (40 mm in diameter and height). For both measurements the same W-TES evaporated onto a small CdWO4 carrier crystal was used. In case of the TeO2 crystal the carrier was attached by conventional vacuum grease. In the case of CdWO4, the carrier crystal was glued onto the big absorber using a low viscous epoxy resin (EpoTek 301-2).
For the pulses illustrated in Figure 3 the energy deposited in TeO2 (left plot) is about 20 times higher than in the CdWO4 crystal (right plot). However, the detected pulse amplitude is of same order. Especially, the contribution of the non-thermal component in the TeO2 crystal is significantly reduced. Non-thermal phonons seem to thermalize before being detected in the TES, resulting in an overall small pulse amplitude with a long decay time.
The following explanation of the experimental observation is very plausible, however contributions from other processes cannot completely be excluded at this point. Phonons that have to be transmitted between two carefully bonded dissimilar crystalline media (crystal - interface - carrier crystal - metal film) will experience a boundary resistance. The reflection, refraction and mode conversion of phonons on crystalline interfaces is described by the acoustic impedance mismatch model Anderson . In contrast, an amorphous interface as epoxy resin or grease allows low energy phonons more easily to pass the interface due to its rich energy spectrum, thus working as a low-pass filter Swatz .
A first idea on the quality of the phonon transmission between solid-solid interfaces can be gained by comparing the Debye temperatures of the bonded materials (see Table 1). The more the differs for two bond materials the lower the transmission probability. The ratio of the speeds of sound yields a qualitative estimate of the transmission probability from material 1 to material 2. A quantitative way of calculating the transmission and related parameters while including the anisotropy of a real crystal is illustrated in Weis . However, such calculations cannot be performed here because the elastic constants and the lattice orientation are unknown for the materials of this work.
The thin grease/epoxy layer used to attach the carrier crystal onto the large TeO2 crystal does not affect the phonon propagation. This is proven by composite detectors made from CaWO4 and CdWO4 where no degradation of the phonon signal, in particular of the non-thermal component, is observed. Estimating the transmission probability for the material combination TeO2 and CaWO4 by using the simple ratio results in a transmission of about 30%. Since CaWO4 and CdWO4 reveal similar crystal quality in sense of phonon propagation properties, a comparable value is expected for the material combination TeO2 and CdWO4.
Prior to the measurement reported in this article the same TeO2 crystal was operated using a carrier crystal made out of sapphire (Al2O3). The pulse amplitude of 2615 keV s was about six times smaller. The simple calculation for the phonon transmission results in about 3% for the configuration TeO2 and Al2O3 and is roughly consistent with the observed degradation in pulse amplitude in comparison to the combination TeO2 crystal and CdWO4 carrier crystal.
However, the acoustic mismatch between carrier crystal and the TeO2 crystal is not sufficient to serve as the unique explanation for the observed degradation in the non-thermal signal component. In TeO2 other processes which reduce the life time of the non-thermal phonon population due to inelastic processes in the crystal or on the crystals’ surface may play a role. The mantle surface of the cylindrical TeO2 crystal used in this work was mechanically roughened. Surface imperfections induced by a mechanical treatment showed a degradation of the detected signal amplitude, in other experimental works, using Si or sapphire substrates. Further studies are necessary to gain a better understanding of the observed small signal amplitudes in TeO2 crystals read out by W-TES.
The energy resolution achieved at the 2.6 MeV 208Tl -line is: =10.2 keV. In comparison, the energy resolution of a CUORE crystal (750 g) read out by a NTD-Ge with optimized thermal design and working conditions is 2.2 keV CUORE0 . An energy resolution of 0.1-0.2% at the Q-value energy is a prerequiste for a future 0DBD experiment. Thus, thermistors to read out the signals of large bolometers are superior to transition edge sensors in the region of interest for 0DBD (MeV-scale), given their large dynamic range of operation. Instead, W-TES are ideal sensors for the purpose of light detection and for cryogenic bolometers for dark matter searches since their performance is best at eV-keV scale.
III.2 Light Detector
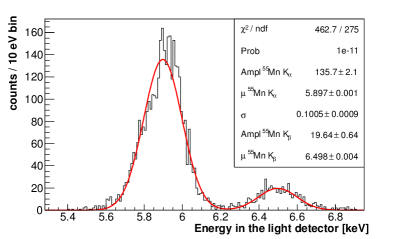
The SOS light detector has a transition temperature of about 17.5 mK. An 55Fe X-ray source was used to allow for a direct energy calibration of the detector. The achieved energy resolution at the 55Mn Kα- and Kβ-line is about (100.5 0.9) eV (see Figure 4), the RMS noise of the baseline is 23.4 eV .
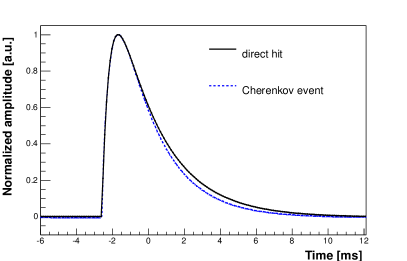
An investigation of the pulse shapes of the detected light signals shows that a pulse from a direct energy deposition in the light detector, referred to as a direct hit event, and a Cherenkov event reveal a very similar pulse shape for the same deposited energy (left plot in Figure 5). The detected light signal caused by an e/-interaction in the TeO2 we refer to as Cherenkov event. The rise time of the non-thermal component of both signals is identical within errors; we find 0.4810.028 ms and 0.4880.008 ms for the direct hit event and the Cherenkov event, respectively.
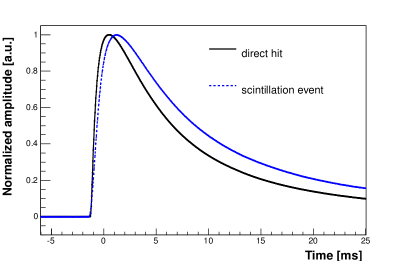
On the contrary, when using a typical inorganic scintillator made from CaWO4, direct hit events and so-called scintillation light events, detected in the light detector as a consequence of a particle interaction in the CaWO4 crystal, reveal a different pulse-shape as can be noted in the right plot of Figure 5: a direct hit event at 5.9 keV in a SOS light detector (solid line) is shown together with an averaged pulse of a scintillation light event (dotted line) from the CaWO4 crystal depositing the same amount of energy in the light detector.111The SOS light detector used with the CaWO4 crystal is not the same as used in the TeO2 measurement. However, they are from the same batch, both SOS-type and identical TES design. The rise times are 0.64 ms for the direct hit event and 0.98 ms for the scintillation light event. This observation further confirms that the light detected from TeO2 is Cherenkov light: the scintillation process is a slow process as it involves a sequence of stages, whereas the Cherenkov light is promptly produced by the charged particle. Therefore the pulse shape is similar to the one of particles (X-rays, electrons) directly absorbed in the light detector.
IV Results
The background data of the TeO2 bolometer acquired in 0.67 days of live time in the light yield-energy plane is shown in Figure 6. The light yield (LY) in this context is defined as the direct energy detected in the light detector in eV per one MeV of deposited energy in the TeO2 crystal. Two distributions can be observed. The highly populated band is due to e/-interactions, the less populated band at zero light yield is ascribed to -particle interactions from the degraded 238U -source.
The test facility does not exhibit a low-background environment and several -lines are visible in the scatter plot (Figure 6). The dominant part of the e/-background comes from non-radiopure materials used for manufacturing the cryostat and the LHe-dewar located inside the Pb-shield. Furthermore, the Pb-shield around the LHe-dewar does not completely enclose the experiment. The highest observable -line from thallium appears at 2615 keV. We find the energy of the detected Cherenkov light at this 208Tl-line to be 128.9 eV (=32 eV).
The band ascribed to e/-events is shown in form of a central probability band. Two functions define this band: the mean value of the light yield and the energy-dependent width of the band around the mean value. The width is set by the finite energy resolution of the detectors. The following notation is used: the energy deposited in the crystal is , the corresponding energy emitted in form of Cherenkov light is . In this data-oriented model the mean of the light yield (LY) of the e/-event distribution is
| (1) |
The value of is around 50 eV/MeV since the light yield after absolute energy calibration of the light detector is about 50 eV for 1 MeV of deposited energy in the crystal.
The width of the band is given by the energy resolution of the detectors. Due to high statistics, the energy dependence of the resolution can be extracted from a fit of the e/-band. The width of the e/-band can be well described by a Gaussian function with the width Strauss
| (2) |
where and is the baseline noise of the light detector and the TeO2 bolometer and accounts for statistical fluctuations in the number of detected photons (Poisson statistics). During the detector operation heater pulses are injected to the detector via the TES heater. The resolution of a heater pulse in the light detector and the TeO2 bolometer directly yield the and parameters since heater pulses, in contrast to particle pulses, are not affected by photon statistics. The values for the detector module of this work are =261 keV, =9.8 keV and =360 keV.
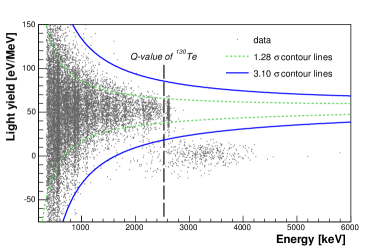
The band description is shown in Figure 6: the dotted contour lines are central 1.28 boundary lines whereas the solid lines are 3.1 boundary lines, thus 99.8% of all e/- events are expected to be within the two solid contour lines. The -particle distribution appears at a light yield of zero, well separated from the populated e/-band.
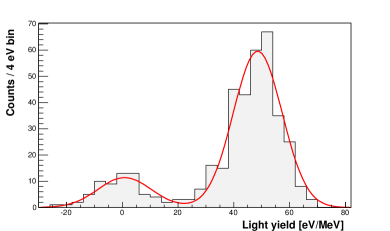
A projected view of the light yield in [eV/MeV] allows to visualize the achieved discrimination of -particles from e/-events; in Figure 7 a histogram of all events observed in the energy interval from 2400 keV to 2800 keV is shown. Two Gaussian functions (all parameters free) are used to fit the two distributions (red solid line): -particles appear at (0.800.89) eV/MeV, whereas for the distribution of e/-events the mean value is found to be (48.550.36) eV/MeV.
The fit gives a resolution of =(8.740.27) eV/MeV for the e/-peak and =(9.530.75) eV/MeV for the -peak. Since the -events do not produce light, the resolution is expected to be slightly better in respect to the e/-events because of the missing Poisson statistics contribution. However, the s of both distributions are compatible due to the dominant contribution of the baseline noise and the lack of statistics (see Figure 7).
Following DP , the discrimination power (DP) between two symmetric distributions can be characterized by comparing the difference between the mean values of the two distributions weighted by the square root of the quadratic sum of their widths
| (3) |
where and are the mean values of the two distributions and and are their corresponding widths. Inserting the values obtained from the double-Gaussian fit displayed in Figure 7 yields a value of DP equal to 3.7. Thus, we achieve the highest suppression up to date, in particular carried out on a massive TeO2 bolometer (see Table 2).
Experiments using light detectors read out by NTD-Ge with the characteristics presented in Cerenkov1 ; Cerenkov2 so far do not arrive at a sensitivity level which allows for a discrimination on an event-by-event base. An improvement by a factor of four ( 20 eV (RMS)) on the performance of the thermistor would be needed for an effective -particle suppression. A TES-based light detector combined with Neganov-Luke amplification technique Willers showed an -suppression of 99% while accepting 99.8% of all e/-events at the 208Tl-line, but on a very small 23 g TeO2 crystal.
In Table 2 we summarize the properties and the performance of the before mentioned cryogenic light detectors used for the detection of Cherenkov light from TeO2 bolometers.
| Material | Area [cm2] | Thermometer | TeO2 | Cherenkov light | DP | Ref. | |
|---|---|---|---|---|---|---|---|
| absorber | light detector | light detector | [eV RMS] | mass [g] | 2.6 MeV in [eV] | ||
| Ge | 19.6 | NTD-Ge | 72 | 750 | 100 | 1.5 | Cerenkov2 |
| Ge | 34.2 | NTD-Ge | 97 | 117 | 195 | 1.4 | Cerenkov1 |
| Si | 4.0 | IrAu-TES + NL | 8 | 23 | 78 | 2.9 | Willers |
| SOS | 12.6 | W-TES | 23 | 285 | 129 | 3.7 | this work |
V Conclusion and Perspective
In order to explore the inverted hierarchy region, future 0DBD experiments based on TeO2 bolometers have to adopt a particle discrimination method to reject the -background in the region of interest for 0DBD. We demonstrated for the first time, using a massive TeO2 bolometer (285 g), that the detection of the Cherenkov light by operating a TES-based cryogenic light detector allows to suppress the -background. We achieve a discrimination power of 3.7 for e/-events from -particles in the energy interval from 2400 keV to 2800 keV comprising the Q-value of 130Te.
For the readout of the TeO2 crystal a NTD-Ge thermistor is superior to a TES since such thermometers have shown to be able to reach a resolution of 0.1-0.2% at the Q-value of the double-beta decay of 130Te.
The light detector used in this work has an RMS of the baseline of about 23 eV . Best performing TES-based light detectors operated in the CRESST-II dark matter search show =5 eV (RMS) Angloher14 . This improvement of a factor of about five would allow to enlarge the light absorber without loosing discrimination power. A light absorber with a larger area might be employed in order to detect the Cherenkov light from several massive TeO2 crystals (750 g each), in a CUORE-like structure. To equip a next-generation CUORE-type experiment with 1-tonne of isotopic mass using enriched TeO2 crystal with such large light absorbers would allow for a limited number of SQUID channels and would mitigate the challenge of manufacturing W-TES on a mass-production scale.
Acknowledgements
This work was supported by the Italian Ministry of Research under the PRIN 2010ZXAZK9 2010-2011 grant. We want to thank the LNGS mechanical workshop and in particular E. Tatananni, A. Rotilio, A. Corsi, and B. Romualdi for continuous and constructive help in the overall set-up construction and to M. Guetti for his constant technical support.
References
- (1) E. Majorana, Il Nuovo Cimento 14, 171 (1937).
- (2) F. T. Avignone, S. R. Elliott, and J. Engel, Rev. Mod. Phys. 80, 481 (2008).
- (3) A. Barabash, Nuclear Physics A 935, 52 (2015).
- (4) L. Cardani et al., JINST 7, P01020 (2012).
- (5) CUORE Collaboration, D. Artusa et al., Eur. Phys. J. C 74, 2956 (2014), 1402.0922.
- (6) E. Andreotti et al., Astropart. Phys. 34, 822 (2011), 1012.3266.
- (7) C. Arnaboldi et al., J. Crystal Growth 312, 2999 (2010).
- (8) M. A. Fehr, M. Rehkämper, and A. N. Halliday, Int. J. Mass Spectrom. 232, 83 (2004).
- (9) F. Alessandria et al., Astropart. Phys. 45, 13 (2013), 1210.1107.
- (10) M. Clemenza, C. Maiano, L. Pattavina, and E. Previtali, Eur. Phys. J. C 71, 1805 (2011).
- (11) CUORE Collaboration, C. Arnaboldi et al., Nucl. Instrum. Meth. A518, 775 (2004), hep-ex/0212053.
- (12) C. Bucci et al., Eur. Phys. J. A41, 155 (2009).
- (13) D. Artusa et al., Eur. Phys. J. C74, 3096 (2014), 1404.4469.
- (14) T. Tabarelli de Fatis, Eur. Phys. J. C65, 359 (2010).
- (15) J. Beeman et al., Astropart. Phys. 35, 558 (2012), 1106.6286.
- (16) M. Willers et al., submitted for publication, (2014), 1407.6516.
- (17) N. Casali et al., Eur. Phys. J. C 75, 12 (2015).
- (18) G. Angloher et al., Eur. Phys. J. C 72, 1971 (2012).
- (19) F. Danevich et al., Nucl. Instr. Meth. Phys. Res. A 744, 41 (2014).
- (20) M. Kiefer et al., AIP Conference Proceedings 1185, 651 (2009).
- (21) CRESST Collaboration, G. Angloher et al., Astropart. Phys. 31, 270 (2009), 0809.1829.
- (22) CRESST Collaboration, G. Angloher et al., Astropart. Phys. 23, 325 (2005), astro-ph/0408006.
- (23) F. Pröbst et al., J. Low. Temp. Phys. 100, 69 (1995).
- (24) M. Barucci et al., J. of Low Temp. Phys. 123, 303 (2001).
- (25) M. Weber, Handbook of Optical Materials (CRC Press, 2002).
- (26) A. Senyshyn, H. Kraus, V. B. Mikhailik, and V. Yakovyna, Phys. Rev. B 70, 214306 (2004).
- (27) T. L. Head and M. E. Msall, C. J. Phys. 49, 278 (2011).
- (28) Schäffner et al., Journal of Low Temperature Physics 167, 1075 (2012).
- (29) A. C. Anderson, Nonequilibrium Superconductivity, Phonons, and Kapitza Boundaries (Plenum, New York, NY, 1981).
- (30) E. T. Swartz and R. O. Pohl, Rev. Mod. Phys. 61, 605 (1989).
- (31) O. Weis, Z. Phys. B 34, 55 (1979).
- (32) R. Strauss et al., Eur. Phys. J. C 74, 2957 (2014).
- (33) J. Beeman et al., Eur. Phys. J. C 72 (2012).
- (34) CRESST-II Collaboration, G. Angloher et al., Eur. Phys. J. C 74, 3184 (2014), 1407.3146.