Patterns in the Chaos – a Study of Performance Variation and Predictability in Public IaaS Clouds
Abstract
Benchmarking the performance of public cloud providers is a common research topic. Previous work has already extensively evaluated the performance of different cloud platforms for different use cases, and under different constraints and experiment setups. In this paper, we present a principled, large-scale literature review to collect and codify existing research regarding the predictability of performance in public Infrastructure-as-a-Service (IaaS) clouds. We formulate 15 hypotheses relating to the nature of performance variations in IaaS systems, to the factors of influence of performance variations, and how to compare different instance types. In a second step, we conduct extensive real-life experimentation on four cloud providers to empirically validate those hypotheses. We show that there are substantial differences between providers. Hardware heterogeneity is today less prevalent than reported in earlier research, while multi-tenancy indeed has a dramatic impact on performance and predictability, but only for some cloud providers. We were unable to discover a clear impact of the time of the day or the day of the week on cloud performance.
category:
H.3.4 Systems and Software Distributed systemskeywords:
Infrastructure-as-a-Service; Public Cloud; BenchmarkingThe research leading to these results has received funding from the European Community’s Seventh Framework Programme (FP7/2007-2013) under grant agreement no. 610802 (CloudWave). We thank Joel Scheuner for valuable feedback and help with setting up our benchmarks in Cloud Workbench.
1 Introduction
In an Infrastructure-as-a-Service (IaaS) cloud [Armbrust et al. (2010)], computing resources are acquired and released as a service, typically in the form of virtual machines with attached virtual disks [Buyya et al. (2009)]. Cloud benchmarking, i.e., the process of establishing and objectively comparing the performance of different providers and configurations, is a common contemporary research topic in the cloud domain.
Previous work has already extensively evaluated the performance of different cloud platforms for different use cases, and under different constraints and experiment setups. However, we observe a number of issues with the current state of research. Firstly, most existing papers do not make all parameters that impact the reported results, or the raw data itself, available, leading to the unsatisfying situation that similar experiments are reported in literature with differing results. Readers are unable to establish whether this is due to external factors (e.g., the performance of cloud providers changing over time), unreported parameters, or technical inaccuracies. Secondly, current research papers generally do not compare their results to previous work, but start from a “clean slate”. Thirdly, it is unclear to what extent research published, for instance, in 2010 stood the test of time, and remains valid today. One has to consider that cloud benchmarking inherently aims at a moving target, as cloud providers are constantly competing to improve their service. All in all, despite the plethora of existing data points, it remains surprisingly difficult to extract meaningful and portable knowledge from existing research.
The goal of our study is to identify the fundamental rules, patterns and mechanisms underlying performance variations of IaaS-based public cloud systems. Specifically, we are interested in predictability of performance, i.e., how accurately the performance of a virtual machine acquired from an IaaS cloud can be estimated in advance, and how stable this performance will be. We present a principled literature review to collect and codify existing research on the performance variations underlying public IaaS systems. We formulate 15 hypotheses relating to the nature of performance predictability, to the factors of influence of performance variations, and how to select cloud instance types. Further, we systematically collect real-life performance data from four IaaS providers (Amazon Elastic Compute Cloud, EC2111http://aws.amazon.com/ec2/, Google Compute Engine, GCE222https://cloud.google.com/compute/, Microsoft Azure333https://azure.microsoft.com/en-us/, and IBM Softlayer, SL444http://www.softlayer.com) using 5 micro and application-level benchmarks in 2 to 8 different configurations, executed 6 times a day over a period of one month. This led to two data sets, with a combined total of 53918 measurements. We use this data to validate the hypotheses we formed from existing research. We show that there are relevant differences between providers, and illustrate that not all assumptions and results from existing research are equally valid for all cloud providers. For instance, we show that hardware heterogenity, as often seen as a core property of public clouds, only exists in Azure and a small number of EC2 instance types at the time of this writing. Similarly, the effect of multi-tenancy on performance predictability is not equally pronounced in all clouds.
2 Preliminaries
In the IaaS model of cloud computing, virtual machines (or, as they are more commonly referred to, instances) can be configured along a number of dimensions. Most importantly, when requesting an instance, users need to specify (1) a region (e.g, us-east-1), which maps to a known physical data center within the cloud, (2) a base image, which defines what software (operating system plus optional pre-installed software packages) should initially be installed in the virtual machine, and (3) an instance type, which defines price and available computing resources for the instance.
| Instance Type | CPU | Price | Common CPU |
| Cores | Models | ||
| m1.small | 1 | 0.044$ |
Xeon E5645
Xeon E5-2650 |
| m3.large | 2 | 0.14$ | 2x Xeon E5-2670 |
| t1.micro | 0.02$ |
Xeon E5645
Xeon E5430 Xeon E5507 |
|
| i2.xlarge | 4 | 0.853$ | 4x Xeon E5-2670 v2 |
Instance types are typically grouped into families of types for comparable use cases (e.g., general-purpose, CPU-optimized, I/O-optimized). IaaS clouds often serve requests for identical instance types with differing underlying hardware (hardware heterogeneity). Table 1 lists a subset of existing EC2 instance types along with their hourly price as of beginning of November 2014 in the us-east-1 region for a Linux instance. Additionally, we list, without claim of completeness, physical CPU models that are at the time of our study commonly used to serve a given instance type for EC2. In IaaS, multiple customers typically own instances running on the same physical machine (multi-tenancy). Most computing resources (e.g., network or disk I/O, but usually not CPU cores) are shared among all instances on a machine. This can lead to the “noisy neighbour” problem, when one instance experiences a slowdown due to the behavior of a co-located other tenant [Gkatzikis and Koutsopoulos (2013)].
3 Related Work
Our study takes inspiration from the efforts of Li et al., who have been the first to systematically collect and classify research on IaaS benchmarking. Their work has led to a methodology for evaluating providers [Li et al. (2013a)], to a catalogue of widely-used metrics [Li et al. (2012)], and to a conceptual model of IaaS benchmarks [Li et al. (2013)]. However, while this work aptly classifies existing research, it does not actually codify or validate the results presented therein, which is the scope of our research.
The empirical part of our research requires means to easily define and execute benchmarks over different cloud systems. Previous work has proposed multiple approaches to achieve this, including Expertus [Jayasinghe et al. (2012)], CloudBench [Silva-Lepe et al. (2008)], CloudCrawler [Cunha et al. (2013)], and Cloud Workbench [Scheuner et al. (2014), Scheuner et al. (2015)]. We have made use of our own framework (Cloud Workbench) to collect data for quantitative analysis. However, arguably, either of the other systems could have been used instead as well.
Our work is also related to the efforts of CloudHarmony555https://cloudharmony.com. CloudHarmony is a commerical entity, which has been collecting numerical performance data from a large set of cloud providers and services over a long period of time (multiple years in many cases). Unfortunately, at the time of this writing, the CloudHarmony benchmarking data has been removed from their website. The main difference between our work and the data collected by CloudHarmony is that they are primarily striving for breadth in the data they collect (many providers, configurations, and a longer observation period), while we were going for depth (less services benchmarked over a much shorter period of time, but significantly more data per provider).
Finally, our work is evidently also closely related to previous cloud benchmarking research, which we cover as part of Section 4.
4 Hypotheses
We conducted a systematic literature review [Kitchenham et al. (2004)] to collect the existing state of research regarding performance predictability of public IaaS clouds. We seeded our review with 7 seminal publications, which we considered widely-known and representative of the field [Phillips et al. (2011), Schad et al. (2010), Lenk et al. (2011), Mao and Humphrey (2012), Iosup et al. (2011a), Imai et al. (2013), Fittkau et al. (2012)]. We also added three of our own earlier publications to the seed [Borhani et al. (2014), Scheuner et al. (2014), Leitner and Scheuner (2015)]. From those 10 studies, we generated a candidate set of additional relevant studies by following all backward and forward scientific references.
From the resulting set of additional candidate studies, we accepted those that were (1) specifically about benchmarking public cloud services (we disregarded studies on private cloud systems or self-hosted data centers, as those systems are substantially different from a performance predictability point of view), (2) which explicitly reported numerical performance data (we disregarded studies that mention benchmarking as part of their research, but do not explicitly report their results), and (3) which appeared in a trustworthy peer-reviewed scientific venue (specifically, we excluded several publications that were published in journals on Beall’s list of predatory open access journals666http://scholarlyoa.com/publishers/ – after manual inspection the results of these papers did not appear sufficiently reliable).
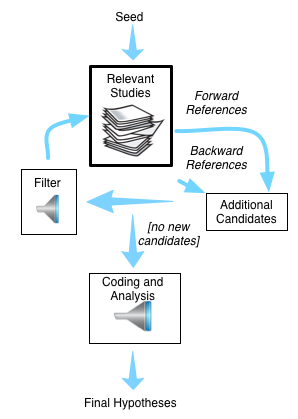
We have repeated this process until we were unable to find additional relevant studies. Afterwards, we analyzed this body of research, and used open coding to identify and group common patterns of results and conclusions. This led to the formation of 15 hypotheses (categorized into 4 groups). We illustrate our method in Figure 1.
4.1 H1: Performance Predictability
It is evident that cloud instances with different configurations (e.g., m1.small versus m3.large in EC2) provide different performance. However, a plethora of existing research has established that even the performance of instances using the exact same configuration can vary dramatically [Iosup et al. (2011a), Schad et al. (2010), Cerotti et al. (2012)]. This makes it hard for cloud customers to predict the performance of their instances in advance. A wide array of existing research has shown that these variations are unique to virtualized cloud instances, or at least much less pronounced in on-premise environments [Hazelhurst (2008), Kotthoff (2014), Hill and Humphrey (2009), Jackson et al. (2010), Mehrotra et al. (2012), Chakthranont et al. (2014)].
H1.1: Performance Varies Between Instances – the performance of cloud instances using the same configuration tends to vary relevantly. \endMakeFramed
Existing literature supports 4.1 based on various micro and application benchmarks, including CPU performance [OLoughlin and Gillam (2013), Akioka and Muraoka (2010)], hard disk IO [Kossmann et al. (2010), Ghoshal et al. (2011), Li et al. (2010)], memory [Ataş and Gungor (2014), Gillam et al. (2013)], network latency [Barker and Shenoy (2010)], or overall system performance [Walker (2008)]. However, the main causes of the observed performance variability differs for different types of benchmarks and applications. The performance of CPU-bound applications or benchmarks (i.e., those that depend strongly on processing speed or memory access) varies primarily due to the randomness of which physical hardware is used for an instance (hardware heterogeneity). This has been studied (and exploited) extensively in [Lenk et al. (2011), Ou et al. (2013), Farley et al. (2012), Cerotti et al. (2012)].
H1.2: CPU-Bound Applications – the performance of CPU-bound applications depends strongly on the served CPU model, and tends to vary primarily due to hardware heterogenity. \endMakeFramed
Contrary, the performance of IO-bound applications or benchmarks (i.e., those that primarily depend on disk IO or networking bandwidth) varies primarily due to the behavior of other co-located tenants [Iosup et al. (2011a)]. That is, these applications may suffer from a “noisy neighbour” effect [Varadarajan et al. (2012)].
H1.3: IO-Bound Applications – the performance of IO-bound applications depends strongly on the behavior of other co-located tenants. \endMakeFramed
As a direct result, performance data collected from CPU-bound applications often follows a multi-modal distribution [Schad et al. (2010), OLoughlin and Gillam (2013)]. That is, while the overall performance variability is large, there are clusters of similarly-performing instances, which have been served with the same type of hardware. Hence, for CPU-bound applications, performance predictability increases substantially if the hardware is known. For IO-bound applications, knowing the served hardware does not help much to increase predictability.
4.2 H2: Variability Within Instances
Additionally, even the performance of a single instance may vary over time. For IO-bound applications (e.g., disk IO [Scheuner et al. (2014)] and network throughput [Wang and Ng (2010), Hill et al. (2010)]), existing research has established that even multiple benchmarks taken in quick succession, within the timeframe of minutes or even seconds, can lead to substantially varying results.
H2.1: Intra-Instance Variability of IO-Bound Applications – the performance of IO-bound applications tends to vary relevantly within the same instance. \endMakeFramed
Theoretically, cloud providers are able to migrate instances from one physical host to another at runtime. In practice, the hardware used to serve a given instance currently does not routinely change after instance creation, leading to rather stable performance of CPU-bound applications over time [Dejun et al. (2009)].
H2.2: Intra-Instance Stability of CPU-Bound Applications – the performance of CPU-bound applications tends not to vary relevantly within the same instance for instances with a dedicated CPU. \endMakeFramed
An exception to 4.2 are bursting cloud instance type families, such as GCE’s f1-micro and EC2’s t1.micro. Such instance types do not receive an entire CPU, but share their processor with other tenants based on a credit system. Hence, their longer-term performance is also subject to noisy neighbours, as well as other performance variations induced by the credit system [Wen et al. (2015)].
H2.3: Intra-Instance Variability of Bursting Instance Types – the performance of any application using a bursting instance type tends to vary relevantly within the same instance. \endMakeFramed
4.3 H3: Temporal and Geographical Factors
Some authors have speculated that there may be additional temporal and geographical factors that influence cloud performance and predictability [Iosup et al. (2011b)], in addition to hardware heterogeneity and multi-tenancy. One such potential factor of influence is the time of the day when a benchmark was launched [Borhani et al. (2014)].
H3.1: Impact of Time of the Day on Performance – the performance of a cloud instance in any application depends significantly on the time of the day. \endMakeFramed
Moreover, we speculate that not only the absolute performance of cloud instances differs at different times of the day, but also the performance variability.
H3.2: Impact of Time of the Day on Predictability – the predictability of the performance of a cloud instance in any application depends significantly on the time of the day. \endMakeFramed
Other researchers have argued that the current day of the week may impact performance [Lenk et al. (2011)]. The theory behind this, as well as behind 4.3 and 4.3, is that enterprise applications are typically used less during the weekend and outside of office hours, while other types of applications (e.g., movie streaming services) are used more when the majority of their customers are not at work.
H3.3: Impact of Day of the Week on Performance – the performance of a cloud instance in any application depends significantly on the day of the week. \endMakeFramed
Similarly to 4.3, we assume that the predictability of the performance of a cloud instance also depends on the day.
H3.4: Impact of Day of the Week on Predictability – the predictability of the performance of a cloud instance in any application depends significantly on the day of the week. \endMakeFramed
Finally, multiple earlier studies have shown that the region an instance is launched in (e.g., us-east-1 or eu-west-1 in EC2) has implications, both on the performance and the expected performance variability [Dejun et al. (2009), Schad et al. (2010)]. Different regions typically map to different physical data centers, which differ in the hardware used to serve requests, as well as in the data center utilization, which impacts how many tenants are typically located on each physical machine. To reflect this, regions are often not priced at equal rates.
H3.5: Impact of Region on Performance – the performance of a cloud instance in any application depends significantly on the selected region. \endMakeFramed
Again, we speculate that not only the absolute performance, but also the performance variability is impacted by the selected provider region.
H3.6: Impact of Region on Predictability – the predictability of the performance of a cloud instance in any application depends significantly on the selected region. \endMakeFramed
4.4 H4: Instance Type Selection
In H1 to H3, we have primarily focused on performance predictability, and what impacts it, in isolation. However, practitioners choosing between different configurations or providers are generally not interested in performance alone. A more meaningful metric to select between instance types is the performance per US dollar per hour [Sobel et al. (2008)]. Clearly, the ratio of performance and costs is dependent on the used application or benchmark. Hence, no consensus “best” instance type (or provider) for all use cases has emerged from existing research. Nonetheless, we are able to identify a number of trends regarding the relationship of different instance types.
One such trend is the observation that the ratio of performance and costs of more expensive instance types tends to be lower than of cheaper instance types. Essentially, this means that there are diseconomies of scale when selecting larger instances [Borhani et al. (2014), Roberto R. Exposito and Doallo (2013), Sadooghi et al. (2015)]. Note that this observation is not obvious from provider specifications, which often give the impression that there is close to a perfectly constant relationship between costs and expected performance, at least within the same instance type family. Indeed, contemporary research sometimes seems to assume that twice as expensive instance types are generally twice as fast (e.g., [Frincu et al. (2014)]).
H4.1: Diseconomies of Scale of Larger Instance Types – the ratio of performance and costs for any application tends to decrease with increasing instance type costs. \endMakeFramed
However, one advantage of larger instance types is a higher predictability of performance [Wang et al. (2011), Kotthoff (2014)].
H4.2: Stability of Larger Instance Types – the predictability of performance for any application tends to increase with increasing instance type costs. \endMakeFramed
Finally, some existing studies have analyzed how specialized instance types (e.g., the IO-optimized instances from the “i2” family) compare to general-purpose instances. These studies show that specialized instance types are more cost-efficient for the right kind of application [Imai et al. (2013)].
H4.3: Price of Specialization – specialized instance types tend to have a better ratio of performance and cost for applications related to their specialization, and worse ratio otherwise. \endMakeFramed
5 Experimental Results
We now numerically discuss the formed hypotheses in the context of the performance of four existing IaaS providers.
5.1 Data Collection
We used Cloud Workbench [Scheuner et al. (2015)] to set up and collect a relevant amount of performance measurements from four real-life cloud providers. We have chosen EC2, GCE, Microsoft Azure, and IBM Softlayer (SL) for our study. EC2 has been chosen due to both, its popularity in existing benchmarking research and its high industrial relevance. Similarly, Azure was chosen because it is seen as another current market leader [Serrano et al. (2015)]. GCE, on the other hand, was interesting for us as the service went out of beta only 1 month prior to the start of our data collection (on May 15th, 2014), and has, to the best of our knowledge, so far only been used in a single performance study [Li et al. (2013b)]. [Serrano et al. (2015)] lists GCE as a “visionary” in the current cloud market. Finally, we have chosen SL as a smaller, less established, provider, who is nonetheless backed by an established IT company.
Based on our literature review, we decided to implement 3 micro-benchmarks, targeting instance processor speed (CPU), (combined) disk read/write speed (IO), and (combined) memory read/write speed (MEM). Additionally, we defined two application benchmarks, measuring queries per minute on a MySQL database (OLTP) and the Git checkout and Java compilation time of the open source project jCloudScale [Leitner et al. (2012), zabolotnyi:15:1] (Java). Following the distinction introduced in Section 4, we consider the CPU, MEM, and Java benchmarks to be CPU-bound, while IO and OLTP are IO-bound. More details on these benchmarks are given in Table 2. All EC2, Azure and SL benchmarks use an Ubuntu 14.04 LTS image as base operating system. In GCE, no officially maintained Ubuntu images were available at the time of experimentation. Hence, we use Debian 7 Wheezy base images for this provider.
| Name | Benchmark Description | Unit | |
|---|---|---|---|
| CPU-Bound | CPU | Uses sysbench to check 20000 natural numbers for prime-ness; measures time to completion; lower is better | s |
| MEM | Uses mbw to 50 times allocate two 64 MiB arrays in memory and copy one array to the other; measures average memory bandwidth; higher is better | MiB/s | |
| Java | Clones jCloudScale, a mid-sized Java project from GitHub and compiles it using OpenJDK 7; measures end-to-end duration; lower is better | s | |
| IO-Bound | IO | Uses sysbench to repeatedly read / write a 5 GByte file for 3 minutes; measures average combined disk read/write bandwidth; higher is better | Mb/s |
| OLTP | Uses sysbench to repeatedly execute SQL queries against a MySQL database with 10.000 rows for 3 minutes; measures average queries per second; higher is better | Query/s |
Further, we considered two types of experiments. In isolated tests, we acquire a specific instance type from a provider, provision the benchmark code (e.g., install the sysbench tool for the CPU benchmark), execute the benchmark three times directly after each other, and then immediately release the instance. Using Cloud Workbench, we scheduled this procedure in 82 configurations 6 times per day over a period of approximately one month during July/August 2014 for EC2 and GCE, and during June/July 2015 for Azure and SL. For European regions (“eu”), we used eu-west-1 in case of EC2, West Europe for Azure, and europe-west1-a in case of GCE. For North American regions (“na”), we used us-east-1 for EC2, East US for Azure, mel01 (Montreal) in case of SL, and us-central1-a for GCE.
In some cases, we had to deal with transient faults, which originated either in the cloud provider (e.g., instances not starting up correctly) or in our own tooling (e.g., timeouts from the Chef server used for instance provisioning). In these cases, we have simply cancelled the benchmarking run and discarded the resulting measurements. As executing all combinations of benchmarks, providers, instance types, and regions proved prohibitively expensive, we aimed for a pragmatic compromise between cost- and time-efficient benchmarking on the one hand, and validity and expressiveness of the resulting data on the other. Specifically, we executed the OLTP and MEM benchmarks only in EC2. For OLTP, the main reason was that we saw a strong correlation between OLTP and IO. Hence, executing both benchmarks in all clouds was deemed not necessary. The same was true for MEM and CPU, as both benchmarks tend to depend strongly on the served CPU model. Similarly, we have only analyzed IO- and CPU-optimized instance types in EC2 and in the European region. SL does not specifically provide named instance types. Rather, customers can specify various virtualized hardware properties, such as number of virtual CPUs and available memory. As SL does not provide an equivalent to the bursting micro instance types of other providers, we only benchmark two configurations, resembling small and large instance types in other clouds. Further, we have only benchmarked SL in North America.
Orthogonal to these isolated tests, we also collected data related to the performance stability of cloud virtual machines over time. For these continuous tests, we again acquire a specific type of virtual resource from a provider and provision the benchmark. However, we then continuously execute the benchmark once every hour for a total duration of 3 days (72 executions), after which we discard the instance. For each benchmarked configuration, we repeated this 15 times. We executed all micro-benchmarks used in our study (CPU, IO and MEM) for these experiments. Further, we used European regions for EC2, GCE, and Azure, and the Montreal region for Softlayer. Table 3 lists the number of collected data points for each cloud provider and data set.
5.2 Validation Results
We now discuss the validation of the 15 hypotheses formed in Section 4. We base our validation on the data described in Section 5.1.
5.2.1 Performance Predictability of Instances
We first validate the hypotheses related to the performance variability between instances acquired with identical configuration. In this context, a configuration is defined as the quadruple of cloud provider, region, instance type, and benchmark .
| EC2 | GCE | Azure | SL | Total | |
|---|---|---|---|---|---|
| Isolated | 21552 | 8372 | 9406 | 3041 | 42371 |
| Continuous | 3243 | 3225 | 2995 | 2084 | 11547 |
| Total | 24795 | 11597 | 12401 | 5125 | 53918 |
Every configuration has associated instances (where is the set of all instances). For every instance within a configuration, we collected performance measurements . For each configuration, we collected a large number of individual measurements (approximately 500 measurements each, resulting in 42371 data points), consisting of the union of all measurements of instances of this configuration (Equation 1).
| (1) |
As a measure of performance variability, we use the relative standard deviation () of the measurements collected for each configuration, as defined in Equation 2, with referring to the arithmetic mean of , and referring to the standard deviation of .
| (2) |
We display of all configurations in Table 4. We assume that a relative standard deviation of more than 5% represents a relevant variability in performance for most use cases. However, evidently, specific applications may tolerate higher or lower variability.
| CPU-Bound | IO-Bound | ||||||
| Type | CPU | MEM | Java | IO | OLTP | ||
| EC2 | eu | t1.micro | 12.14 | 17.67 | 30.63 | 71.33 | 30.66 |
| m1.small | 3.19 | 3.77 | 3.17 | 88.49 | 13.02 | ||
| m3.large | 0.13 | 2.07 | 7.22 | 35.53 | 21.26 | ||
| c3.large | 0.21 | 8.60 | 6.42 | 58.88 | 21.31 | ||
| i2.xlarge | 0.12 | 11.92 | 8.44 | 20.07 | 12.28 | ||
| na | t1.micro | 20.28 | 26.40 | 59.32 | 70.08 | 32.18 | |
| m1.small | 12.81 | 26.18 | 5.34 | 94.47 | 15.68 | ||
| m3.large | 0.16 | 4.46 | 9.23 | 49.02 | 37.10 | ||
| GCE | eu | f1-micro | 5.28 | 8.36 | 3.06 | ||
| n1-standard-1 | 2.54 | 6.99 | 3.36 | ||||
| n1-standard-2 | 1.71 | 6.96 | 1.33 | ||||
| na | f1-micro | 5.13 | 7.17 | 9.47 | |||
| n1-standard-1 | 2.05 | 8.31 | 10.39 | ||||
| n1-standard-2 | 1.16 | 9.53 | 4.88 | ||||
| Azure | eu | ExtraSmall | 18.38 | 16.88 | 61.92 | ||
| Small | 18.23 | 8.37 | 59.01 | ||||
| Medium | 17.81 | 11.91 | 47.14 | ||||
| na | ExtraSmall | 18.13 | 15.96 | 49.01 | |||
| Small | 19.11 | 6.62 | 44.01 | ||||
| Medium | 18.28 | 10.96 | 48.31 | ||||
| SL | na | 1 CPU / 2048 MB | 0.11 | 6.65 | 13.01 | ||
| 2 CPUs / 4096 MB | 0.11 | 7.14 | 6.27 | ||||
We note four observations. Firstly, in 63 of 82 configurations (i.e., unique combinations of provider, region, instance type, and benchmark), we experienced a of more than 5%. Hence, we argue that the fundamental hypothesis 4.1 is supported by our data. Secondly, there is a clear difference between the analyzed providers. IO (and, to a lesser extent, OLTP) performance in EC2, as well as IO in Azure, seems almost chaotic, while the same benchmarks are much more predictable in GCE and SL. CPU performance is generally rather predictable with the exception of Azure, for which all benchmarks including CPU are highly unpredictable. By and large, performance in GCE and SL is much more predictable than in EC2 and Azure at the time of our experiments. Thirdly, EC2 t1.micro instances in the us-east-1 region have been the most unpredictable type of cloud virtual machine in our experiments, with a larger than 20% in all benchmarks. Fourthly, the two benchmarks we classify as IO-bound (IO and OLTP) are substantially less predictable than those where performance is strongly influenced by the served hardware (CPU, MEM, and Java) in EC2 and Azure. In SL and GCE, this difference is much less pronounced.
These results can be explained by analyzing the CPU models we have received from the cloud. Contrary to our expectations, we have not universally observed hardware heterogeneity in our experiments. Virtual machines in GCE currently report a standard Intel CPU independent of the actual hardware (and our measured performance data makes it plausible that the underlying physical CPUs are indeed very similar or identical). Virtual machines in EC2 report the actual hardware that the instance is running on. However, as assured by AWS, m3.large instances always receive an Intel Xeon E5-2670 CPU, c3.large instance always receive an Intel Xeon E5-2680 CPU, and i2.xlarge instance always receive an Intel Xeon E5-2670 v2 CPU. Hence, only the t1.micro and m1.small instances are theoretically prone to experience hardware heterogeneity in this provider, and even for m1.small instances in the eu-west-1 region we have in practice seen the exact same CPU model in more than 97% of all runs. SL also provides well-defined hardware for each instance type. Only Azure actually uses a wider range of CPU models for all analyzed instance types. Given that 4.1 postulates that, for CPU-bound applications, hardware heterogeneity accounts for most of the observed performance variability, the apparent lack of heterogeneity in practice explains why the CPU-bound benchmarks ended up with relatively little variability everywhere except in the Azure cloud.
To assess 4.1 and 4.1, we now look in detail at a subset of those instance types for which hardware heterogenity was indeed a factor, concretely EC2 m1.small and the Azure Small configurations in the North American regions. In Table 5, we provide another table of relative standard deviations for those configurations. However, this time, we additionally control for the concrete CPU model we have received in our experiments. To calculate the proper relative standard deviation (Equation 3), we consider measurements for a certain hardware type (, Table 1) within a configuration : . The column “#” indicates the number of concrete benchmark runs in this configuration that have received this CPU model from the cloud provider.
| (3) |
Our data indeed shows that controlling for the CPU model further reduces the observed relative standard deviations in CPU-bound benchmarks, supporting 4.1. Controlling for the served CPU model also reduces the relative standard deviations in IO-bound benchmarks, but to a much smaller degree. Hence, we consider 4.1 to also be supported by our results.
| CPU-Bound | IO-Bound | ||||||
| Model | # | CPU | MEM | Java | IO | OLTP | |
| EC2 | Intel E5-2650 | 1962 | 0.42 | 1.53 | 4.76 | 88.4 | 14.87 |
| Intel E5430 | 364 | 0.15 | 4.51 | 4.84 | 31.53 | 6.56 | |
| Intel E5645 | 293 | 0.36 | 4.6 | 5.04 | 22.82 | 8.86 | |
| Intel E5507 | 84 | 0.25 | 2.66 | 2.79 | 21.02 | 8.51 | |
| Intel E5-2651 | 32 | 0.28 | 0.54 | 3.03 | 2.27 | 18.27 | |
| AMD 2218 HE | 9 | 5.45 | 0.98 | ||||
| Azure | AMD 4171 HE | 782 | 1.84 | 5.8 | 49.05 | ||
| Intel E5-2673 | 595 | 3.05 | 4.13 | 29.85 | |||
| Intel E5-2660 | 189 | 0.8 | 3.46 | 47.51 | |||
The other configurations where we observed hardware heterogenity (all other Azure configurations, the t1.micro configurations in EC2, and, to a very small degree, the m2.small configuration in Europe) lead to comparable results. The detailed data for these cannot be shown here for reasons of brevity, but this data is available in our online appendix.
5.2.2 Performance Variability Within Instances
So far, we have evaluated the variability of performance data measured on different cloud instances. Now we turn to the variability of performance within a single instance. We consider 33 different continuous configurations . For each continuous configuration, we requested 15 instances , and executed the benchmark once per hour for a total duration of 72 hours, leading to a series of measurements per instance . We again use the relative standard deviation (, analogously defined as in Equation 2) as a measure of performance variability, this time of the variability within a single cloud instance (Equation 4). In addition, we define the mean relative standard deviation () as the arithmetic mean of all values for a continuous configuration over all 15 instances that were provisioned using this configuration.
| (4) |
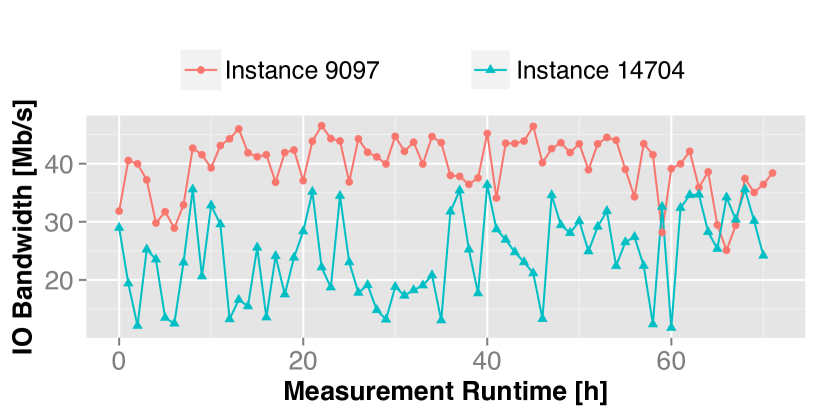
Following 4.2, we expect IO-bound benchmarks to exhibit relevant performance variability even for measurements on the same instance. We initially explored this visually by plotting measurements of different instances on a time line. This visual data analysis supported our hypothesis. Further, we observe that there are substantial differences between individual instances. That is, there are slow and fast, as well as stable and unstable instances. This is exemplified for two sample instances using the same configuration (EC2 in the eu-west-1 region, using the m3.large instance type, and testing IO performance) in Figure 4. In this example, despite identical configuration, the mean IO read/write speed of instance 9097 is almost twice as high as of instance 14704. Further, the performance of 14704 fluctuates more ( for 9097 versus for 14704). However, there is no obvious trend in either of the time series (i.e., the instances do not seem to slow down or get faster over time).
Contrary, 4.2 states that CPU-bound benchmarks do not exhibit relevant performance variability for measurements on the same instance, as long as the instance is not using a bursting instance type (the latter exception is captured by 4.2).
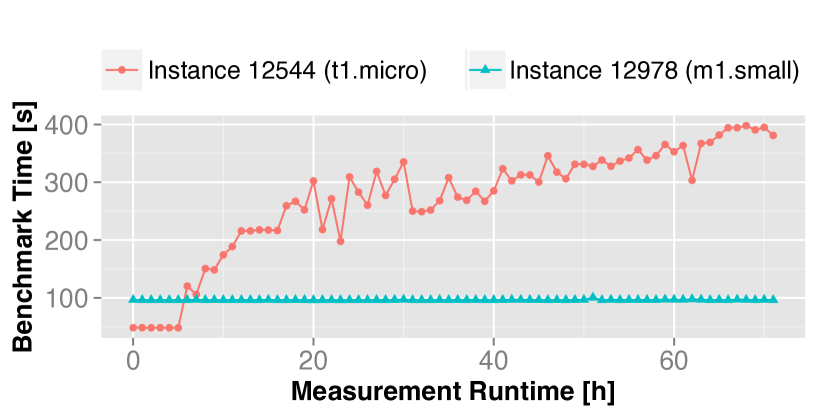
We again verified these hypotheses using visual exploratory data analysis. Figure 4 plots the CPU measurements of two examples instances, this time using different instance types (12544, t1.micro, and 12978, m1.small). Note that, for the CPU benchmark, lower values represent higher performance.
We observe that the m1.small instance 12978 has essentially no variability of CPU performance over time (). The bursting instance 12544 (with a shared CPU) not only has a substantial variability (), but performance is actually decreasing over time. This is because we did not give the bursting instance time to replenish its credit account during our tests. Hence, the CPU cycles available to the instance gradually depleted over time, leading to the observed slowdown. However, it is interesting to see that the cheaper t1.micro instance actually starts off faster than the more expensive m1.small until its credit account starts to deplete.
To analyze 4.2, 4.2, and 4.2 more formally, we now provide the mean relative standard deviations for each continuous configuration in Table 6.
| Type | CPU | MEM | IO | ||
|---|---|---|---|---|---|
| EC2 | eu | t1.micro | 40.17 | 40.86 | 22.78 |
| m1.small | 1.69 | 1.66 | 27.28 | ||
| m3.large | 0.89 | 0.49 | 17.92 | ||
| GCE | eu | f1-micro | 3.24 | 6.85 | 2.65 |
| n1-standard-1 | 0.76 | 2.43 | 4.42 | ||
| n1-standard-2 | 0.86 | 2.01 | 1.46 | ||
| Azure | eu | ExtraSmall | 2.41 | 3.39 | 27.08 |
| Small | 1.65 | 2.33 | 93.47 | ||
| Medium | 1.30 | 1.98 | 0.14 | ||
| SL | na | 1 CPU / 2048 MB | 0.22 | 0.39 | 2.94 |
| 2 CPU / 4096 MB | 0.13 | 0.14 | 2.25 |
We observe that, as expected, the relative standard deviation within the same cloud instances is very low for all CPU-bound benchmarks on non-bursting instance types in all providers. In terms of IO, Azure and EC2 exhibit fluctuating performance for most instance types, while both, GCE and SL, are remarkably predictable. Hence, we conclude that 4.2 is supported for all providers, while 4.2 is only supported in EC2 and Azure. Further, note that, with the exception of the Small instance type in Azure, all configurations have less intra-instance performance variability than between different instances of the same configuration. The performance of the t1.micro instance type on EC2 varies wildly, even (and especially) for CPU-bound benchmarks. Performance in GCE is again remarkably predictable, even for bursting instance types. Hence, we conclude that our data supports 4.2 only for EC2.
5.2.3 Temporal and Geographical Factors
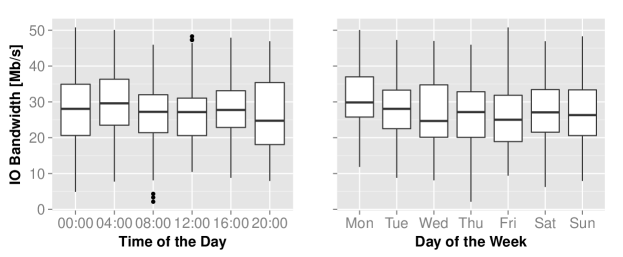
In 4.3-4.3, we speculate that time of day, day of the week, and the region are influential factors of overall performance and predictability. To this end, we have grouped the data collected from the isolated tests discussed in Section 5.1 into days (Monday through Sunday) and time slots (in 4-hour slots, i.e., slot 1 is from “00:00 AM” to “03:59 AM”), based on the start time of the benchmark. The resulting measurements are approximately equally distributed over days and time slots. The region information is readily available, as it is part of the configuration . Using visual data analysis, we were, against our expectations, not able to observe any strong indication that would support an impact of the time of the day or the day of the week, either on absolute performance or predictability. For illustration, Figure 5 depicts the distributions of IO performance for m3.large instances in eu-west-1 in standard Boxplot notation. The remaining configurations show similar distributions.
To analyze this more formally, we now test for statistically significant differences in the underlying distributions. We are required to perform pairwise comparisons for each pair of time slots or days, and each configuration. That means that for each we need to evaluate 21 p-values respectively for 4.3 and 4.3 (measurements on Mondays versus measurements on Tuesdays, Mondays versus Wednesdays, etc.), and 15 p-values for each of 4.3 and 4.3. Hence, we ended up with a total of 3444 p-values for days of the week, and 2460 p-values for time slots. Given that our data is not normally distributed, we performed Wilcoxon signed-rank tests rather than standard Student’s t-tests. P-values were adjusted for multiple hypotheses testing using Holm correction. We tested for statistically significant differences in performance variability via Levene’s variance test. The assumed null-hypothesis for all tests was that there is no difference in underlying distributions between different days or time slots. We tested for a confidence level of .
| Time of the Day | Day of the Week | ||||||||
|---|---|---|---|---|---|---|---|---|---|
| 4.3 | 4.3 | 4.3 | 4.3 | ||||||
| 00:00 | 4% | 96% | 24.4% | 75.6% | Mon | 9.55% | 90.4% | 19.5% | 80.5% |
| 04:00 | 5.88% | 94.1% | 7.32% | 92.7% | Tue | 6.1% | 93.9% | 17.1% | 82.9% |
| 08:00 | 3.92% | 96.1% | 11% | 89% | Wed | 4.47% | 95.5% | 11% | 89% |
| 12:00 | 5.88% | 94.1% | 14.6% | 85.4% | Thu | 7.52% | 92.5% | 13.4% | 86.6% |
| 16:00 | 4.41% | 95.6% | 13.4% | 86.6% | Fri | 7.11% | 92.9% | 11% | 89% |
| 20:00 | 6.37% | 93.6% | 17.1% | 82.9% | Sat | 7.32% | 92.7% | 19.5% | 80.5% |
| Sun | 9.55% | 90.4% | 20.7% | 79.3% | |||||
As the resulting p-values are too numerous to fully enumerate here, and individually of little interest, we only provide an aggregation in Table 7. For each time slot and day, we provide the percentage of p-values over all configurations that were below and above the confidence level of . Clearly, for each time slot and day, there are a small number of pairs for which our tests showed significant differences. However, for the majority of pairs, no statistically significant difference could be established. Further, we were not able to discover any systematics behind the significant pairs, leading us to believe that they represent statistical artifacts and outliers rather than relevant differences. Hence, we conclude that there is no support for the hypotheses 4.3-4.3 in our data.
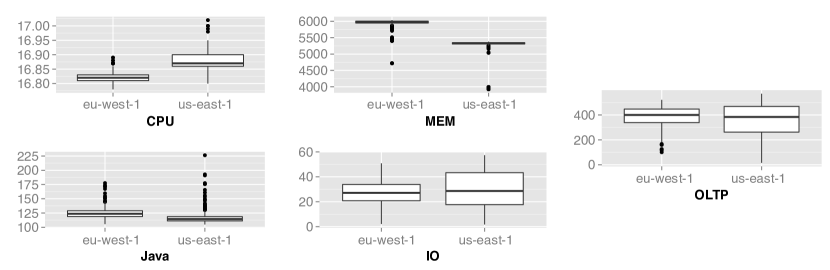
However, when comparing regions, results are different. In Figure 6, we provide boxplots for all benchmarks to compare the eu-west-1 and us-east-1 regions for the EC2 m3.large instance type. This time, visual analysis indicates that there may indeed be a small but statistically significant difference in distribution between the regions, as projected in 4.3 and 4.3. More concretely (considering that for the CPU and Java benchmarks, lower is better) our data seems to indicate that us-east-1 is typically worse-performing as well as more unpredictable (i.e., have higher standard deviation) than eu-west-1. Incidentally, this may explain why providers are, at the time of our research, typically pricing the European regions slightly higher than the North American regions.
| CPU-Bound | IO-Bound | ||||||
| Type | Hyp. | CPU | MEM | Java | IO | OLTP | |
| EC2 | t1.micro | H3.5 | * | * | * | * | 0.016 |
| H3.6 | * | * | * | * | 0.221 | ||
| m1.small | H3.5 | * | * | * | * | * | |
| H3.6 | * | * | * | * | * | ||
| m3.large | H3.5 | * | * | * | 0.03 | 0.065 | |
| H3.6 | * | 0.192 | 0.202 | * | * | ||
| GCE | f1-micro | H3.5 | * | 0.670 | * | ||
| H3.6 | 0.251 | 0.058 | * | ||||
| n1-standard-1 | H3.5 | 0.253 | * | * | |||
| H3.6 | * | * | * | ||||
| n1-standard-2 | H3.5 | * | * | * | |||
| H3.6 | * | * | 0.034 | ||||
| Azure | ExtraSmall | H3.5 | * | 0.017 | * | ||
| H3.6 | 0.229 | 0.737 | * | ||||
| Small | H3.5 | * | * | * | |||
| H3.6 | * | * | * | ||||
| Medium | H3.5 | 0.347 | * | * | |||
| H3.6 | 0.259 | * | 0.412 | ||||
We again validate our intuition using Wilcoxon signed-rank tests for 4.3 and via Levene’s variance test for 4.3. The assumed null-hypothesis for all tests was again that there is no difference in underlying distributions between regions. We again tested for a confidence level of . The resulting p-values for all configurations are listed in Table 8. All statistically significant p-values (i.e., values ) are coded as * for readability. We were able to find statistically significant differences in 26 of 33 relevant configurations for 4.3, and in 23 of 33 relevant configurations for 4.3. Hence, we consider these hypotheses to be supported by our data. The only cases for which we systematically could not find a significant difference is for the OLTP benchmark in EC2, and for the CPU benchmark in Azure. Generally, in Azure, the difference in performance and predictabilty between regions is much less pronounced than in EC2 and GCE. Note that these tests do not make any statement about which region is actually preferable in which configuration. Using visual comparison of boxplots, we verified that indeed, when there is a difference, the analyzed European region is preferable to the North American region in the majority of cases.
5.2.4 Instance Type Selection
In H4, we investigate the economic implications involved in selecting instance types. For 4.4, we examine whether the ratio of performance and costs tends to decrease with in increasing costs. We consider on-demand, Linux-based cloud instances that are priced for a full hour. Further, we consider the prices that were valid at the time we conducted our experiments, i.e., July/August 2014 for EC2 and GCE, and June/July 2015 for Azure and SL. The base hour prices are given in Table 9. For these experiments, we are not interested in how instances of different providers compare, but rather in the comparison of cost-performance ratio (i.e., the “value for money”) of different instance types in the same region of the same provider. Hence, as a first step, we normalize all benchmark results to the mean value of a small instance type (i.e., m1.small for EC2, n1-standard-1 for GCE, Small for Azure, and the single-core machine ine SL) of the same provider and region, as in Equation 5. Further, for the CPU and Java benchmark, we also invert the value, to achieve a consistent “higher-is-better” notion across all benchmarks.
| (5) |
Similarly, we normalize all hourly prices as in Table 9 to the costs of a small instance of the same provider and region (Equation 6).
| (6) |
Now we can define the normalized cost-performance ratio for every possible instance configuration (Equation 7). Per definition, all small instances have a of exactly 1. For all other instance types, a represents a cost-performance ratio worse than a small instance in the same region and provider, while a represents better cost efficiency. Note again that these values cannot be compared between providers, regions, or benchmarks, as they are normalized to different base values.
| (7) |
| Type | Costs | ||
|---|---|---|---|
| EC2 | eu | t1.micro | 0.020$ |
| m1.small | 0.047$ | ||
| m3.large | 0.154$ | ||
| c3.large | 0.120$ | ||
| i2.xlarge | 0.938$ | ||
| na | t1.micro | 0.020$ | |
| m1.small | 0.044$ | ||
| m3.large | 0.140$ | ||
| GCE | eu | f1-micro | 0.013$ |
| n1-standard-1 | 0.069$ | ||
| n1-standard-2 | 0.138$ | ||
| na | f1-micro | 0.012$ | |
| n1-standard-1 | 0.063$ | ||
| n1-standard-2 | 0.126$ | ||
| Azure | eu | ExtraSmall | 0.018$ |
| Small | 0.051$ | ||
| Medium | 0.102$ | ||
| na | ExtraSmall | 0.018$ | |
| Small | 0.044$ | ||
| Medium | 0.088$ | ||
| SL | na | 1 CPU / 2048 MB | 0.053$ |
| 2 CPUs / 4096 MB | 0.105$ |
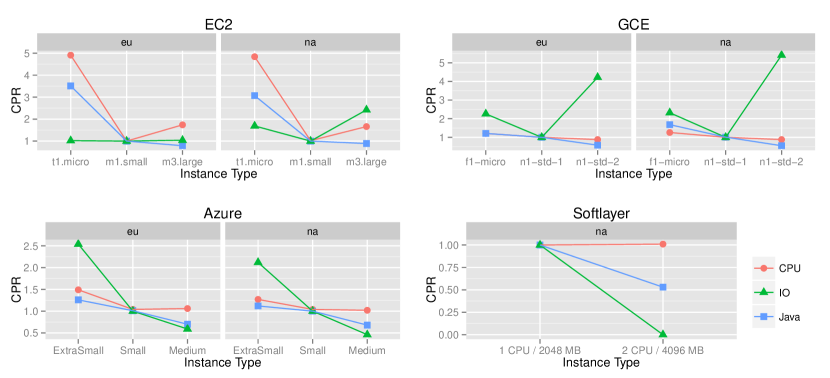
In Figure 7, we depict for all micro, small and large instance types in our study for the CPU, IO and Java benchmarks. 4.4 claims that larger (i.e., more expensive) instance types are generally less cost-efficient. Our data only supports this hypothesis for Azure and Softlayer. For EC2 and GCE, m1.small and n1-standard-1 instances are often the least cost-efficient instance type in our study. Generally, which instance types are the most cost-efficient choice is highly provider and use case specific. Hence, we conclude that 4.4 is not generally supported by our experiments. Contrary, 4.4 claims that the performance of larger instance types is more predictable than of cheaper instance types. The data already presented in Table 4 supports this hypothesis for CPU-bound benchmarks in EC2 and GCE, but there is no strong support for this hypothesis for IO-bound benchmarks or the other two providers. Similarly to 4.4, we conclude that no clear, provider- and benchmark-independent statement can be made in this regard.
Following 4.4, we expected specialized instance types to be more cost-efficient in benchmarks that relate to their “speciality”, such as IO-bound benchmarks for IO-optimized instance types. We have collected data related to specialized instance types only for EC2 and the European region. This data is depicted in Figure 8. For the CPU-optimized instance type c3.large, we indeed observe a slightly better cost-performance ratio for CPU-bound benchmarks than for the m1.small and m3.large instance types. However, for the IO-optimized i2.xlarge instance type, even the cost-performance ratio in the IO benchmark is relatively unfavorable in comparison to all other instance types.
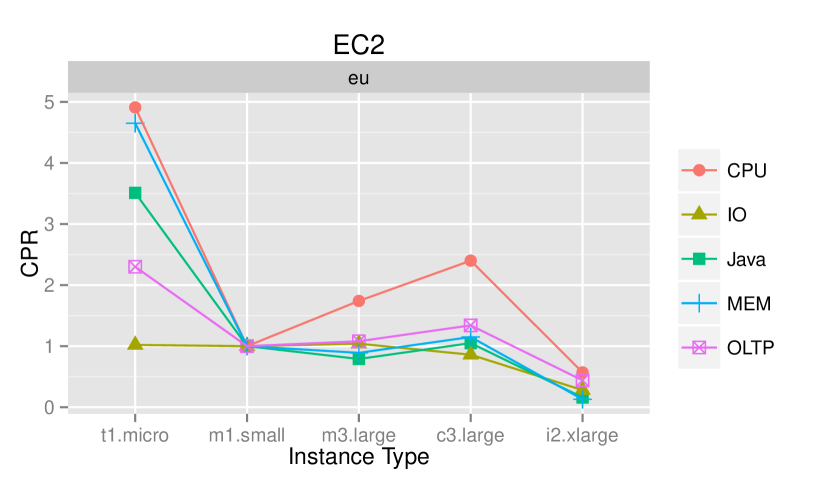
This is largely due to the very high hourly costs of this instance type, which is not fully made up for with increased performance. Concluding, cloud users should not fall into the trap of assuming that specialized instance types are always the best choice for a use case that requires substantial IO or CPU. The often over-proportionally higher price for specialized instance types should always be taken into account when selecting between those and general-purpose instance types. However, users need to keep in mind that some options may only available for specialized instance types.
6 Implications
We now discuss the main outcomes and implications of our study.
Substantial differences between providers. For 4.1-4.2, which relate to the fundamental properties of performance predictability, we found EC2 and Azure to largely behave as we expected after analyzing existing research. GCE and SL, on the other hand, were much more stable and predictable than what we anticipated based on the literature. This leads us to believe that currently there is too much focus on benchmarking EC2, and that the research community needs to validate to what extent existing results are generalizable to other cloud providers. We argue that a wide-ranging survey across a large number of IaaS providers is required to reality-check some of the cloud computing communities’ standing assumptions. Our work serves as a first step into this direction.
Lack of hardware heterogeneity. One such assumption is the concept of hardware heterogeneity, on which a large body of scientific research rests (e.g., [Ou et al. (2013), Farley et al. (2012)]). Based on our experiments, we conclude that hardware heterogeneity is today much less of a factor than what previous studies have reported. We can only speculate as to the reasons of this discrepancy. However, it is likely that cloud providers have simply reacted to commercial pressure to deliver more predictable “value-for-money” in comparison to the early years of the cloud hype. Currently, hardware heterogeneity in EC2 is really only important for micro and small instance types (and even for those only in the North American region). All more expensive instance types (which are arguably also more relevant in industrial practice) are currently served with a fixed CPU model in EC2. In our study, only Azure still fully embraces the idea of hardware heterogeneity for all instance types.
Multi-tenancy is indeed important, but not equally so for all providers. As expected, multi-tenancy is a large factor in cloud performance predictability, but the extent of this varies substantially between providers. For the more mainstream cloud providers EC2 and Azure, all IO-bound benchmarks are highly unpredictable, while the more niche players GCE and SL actually perform rather predictably even for IO-bound benchmarks. We speculate that this is due to higher infrastructure utilization in the former cloud providers. In any case, our results show that the research community needs to more carefully cross-check results across multiple clouds, as research results can vary substantially between providers even for long-standing assumptions such as the importance of multi-tenancy.
Regions matter, time and day do not. For 4.3-4.3, which capture the temporal and geographical factors that influence performance and predictability, we found little empirical evidence that either the day of the week or the time of the day have any real, measurable impact on performance in any provider. However, different regions perform differently in all providers for most benchmarks, but the difference is considerably less pronounced in GCE and Azure than in EC2.
Selecting the right instance type is non-trivial. Our results relating to the cost-performance ratio of cloud instances shows that there are no reliable “rules of thumb” for selecting the right instance types. Different providers employ different pricing strategies, and it is rarely clear without explicit benchmarking which instance type of a provider is particularly cost-efficient for which use case. This is also true for specialized instance types, which are not necessarily more cost-efficient in their specialization than general-purpose types. Arguably, the selling point of, for example, IO-optimized instances is rather the high ceiling of performance and the possibility to use special configuration options. Careful evaluation and benchmarking is still essential to get the best performance and predictability per US dollar spent.
7 Threats to Validity
As with any empirical research, there are threats and limitations to our study, which we discuss in the following.
Construct Validity. Both during literature review and experimentation, some design decisions had to be made. Most importantly, our choice of method for literature search (seeding the search with well-known standard publications and then following the citation graph) has the threat of missing relevant “unconnected” papers (e.g., from different research communities). We have mitigated this risk by verifing for 10 arbitrary relevant papers (found by searching the ACM Digital Library777http://dl.acm.org) that each they were indeed contained in our study set. Another design decision was which benchmarks and configurations to select, and how to configure and parameterize each benchmark. Our approach here was primarily to use common “out-of-the-box” tools and configurations as far as possible, to prevent us from biasing the results by unbalanced optimization.
Internal Validity. We collected an extensive amount of data to validate our hypotheses. However, we did so during a relatively short period of time. This increases the threat that external factors influenced our results (e.g., exceptionally high load during summer in EC2). More long-term research is required to control for this threat, which was out of scope of our present work.
External Validity. We necessarily had to select a subset from the vast space of available cloud providers, instance types, regions, and configuration options. This leads to the question to what extent our results are generalizable to other providers and configurations. Indeed, one of our central outcomes is that benchmarking results vary substantially between different cloud providers. However, our choice of providers included the two current market leaders (EC2 and Azure), one up-and-coming provider (GCE), and a niche player (SL). Hence, we argue that our coverage of the IaaS market is sufficient to support our conclusions.
8 Conclusions and Outlook
We have conducted a structured analysis of the fundamental principles of performance variation and predictability in public IaaS providers. We have analyzed the current state of research, and formulated 15 hypotheses based on previously published, peer-reviewed literature. Further, we have validated these hypotheses based on real-life data collected from Amazon’s EC2, Google’s GCE, Microsoft’s Azure, and IBM’s Softlayer clouds. Analysis of this data showed that there are substantial differences in the performance of different providers, and that practitioners should not assume that research on EC2 is necessarily applicable to other providers. Further, we have observed that hardware heterogeneity is less of a practical factor than what earlier research has reported. Multi-tenancy is indeed important, but not to the same extent for all providers. These results indicate that cloud performance is indeed a “moving target”, and that the scientific community is required to periodically re-validate its understanding of the subject.
We have not been able to establish conclusive causality between different days of the week, or times of the day, and observed performance. However, as expected, the region has a statistically significant impact on performance and predictability on both providers. Finally, we have seen that it is not feasible to establish hard and fast rules for cost-efficient cloud instance selection. Users are required to benchmark instance types for their specific use cases.
One key issue that our research did not address is the longer-term performance stability of cloud instances. Our own work only studied performance stability within cloud instances in the time frame of three days, and we are not aware of any other publication that systematically benchmarked instances for a longer period. Doing so would help practitioners get a feel for how frequently they need to re-evaluate the performance of the instances they are using. More generally, our results call for a more longitudinal study, which tracks the performance of IaaS providers over multiple months or even years, to decide whether the observations reported in this paper (as well as in previous work) are subject to temporal (e.g., seasonal) changes.
Companion Website
We maintain an online companion888http://wp.ifi.uzh.ch/leitner/?p=588, which contains the used benchmark code, and all data used in our study. Further, we will provide additional plots as well as scripts used for analysis and data cleaning.
References
- [1]
- Akioka and Muraoka (2010) Sayaka Akioka and Yoichi Muraoka. 2010. HPC Benchmarks on Amazon EC2. In Proceedings of the 2010 IEEE 24th International Conference on Advanced Information Networking and Applications Workshops (WAINA). 1029–1034. DOI:http://dx.doi.org/10.1109/WAINA.2010.166
- Armbrust et al. (2010) Michael Armbrust, Armando Fox, Rean Griffith, Anthony D Joseph, Randy Katz, Andy Konwinski, Gunho Lee, David Patterson, Ariel Rabkin, Ion Stoica, and Matei Zaharia. 2010. A View of Cloud Computing. Commun. ACM 53, 4 (2010), 50–58.
- Ataş and Gungor (2014) Gültekin Ataş and Vehbi Cagri Gungor. 2014. Performance Evaluation of Cloud Computing Platforms Using Statistical Methods. Computers and Electrical Engineering 40, 5 (July 2014), 1636–1649. DOI:http://dx.doi.org/10.1016/j.compeleceng.2014.03.017
- Barker and Shenoy (2010) Sean Kenneth Barker and Prashant Shenoy. 2010. Empirical Evaluation of Latency-sensitive Application Performance in the Cloud. In Proceedings of the First Annual ACM SIGMM Conference on Multimedia Systems (MMSys’10). ACM, New York, NY, USA, 35–46. DOI:http://dx.doi.org/10.1145/1730836.1730842
- Borhani et al. (2014) Amir Hossein Borhani, Philipp Leitner, Bu-Sung Lee, Xiaorong Li, and Terence Hung. 2014. WPress: Benchmarking Infrastructure-as-a-Service Cloud Computing Systems for On-line Transaction Processing Applications. In Proceedings of the 18th IEEE International Enterprise Distributed Object Computing Conference (EDOC).
- Buyya et al. (2009) Rajkumar Buyya, Chee Shin Yeo, Srikumar Venugopal, James Broberg, and Ivona Brandic. 2009. Cloud Computing and Emerging IT Platforms: Vision, Hype, and Reality for Delivering Computing as the 5th Utility. Future Generation Computing Systems 25 (2009), 599–616. Issue 6.
- Cerotti et al. (2012) Davide Cerotti, Marco Gribaudo, Pietro Piazzolla, and Giuseppe Serazzi. 2012. Flexible CPU Provisioning in Clouds: A New Source of Performance Unpredictability. International Conference on Quantitative Evaluation of Systems 0 (2012), 230–237. DOI:http://dx.doi.org/10.1109/QEST.2012.23
- Chakthranont et al. (2014) Nuttapong Chakthranont, Phonlawat Khunphet, Ryousei Takano, and Tsutomu Ikegami. 2014. Exploring the Performance Impact of Virtualization on an HPC Cloud. In Proceedings of the 2014 IEEE 6th International Conference on Cloud Computing Technology and Science (CloudCom). 426–432. DOI:http://dx.doi.org/10.1109/CloudCom.2014.71
- Cunha et al. (2013) Matheus Cunha, Nabor Mendonca, and Americo Sampaio. 2013. A Declarative Environment for Automatic Performance Evaluation in IaaS Clouds. In Proceedings of the 2013 IEEE Sixth International Conference on Cloud Computing (CLOUD). 285–292. DOI:http://dx.doi.org/10.1109/CLOUD.2013.12
- Dejun et al. (2009) Jiang Dejun, Guillaume Pierre, and Chi-Hung Chi. 2009. EC2 Performance Analysis for Resource Provisioning of Service-oriented Applications. In Proceedings of the 2009 International Conference on Service-oriented Computing (ICSOC/ServiceWave’09). Springer-Verlag, Berlin, Heidelberg, 197–207. http://dl.acm.org/citation.cfm?id=1926618.1926641
- Farley et al. (2012) Benjamin Farley, Ari Juels, Venkatanathan Varadarajan, Thomas Ristenpart, Kevin D. Bowers, and Michael M. Swift. 2012. More for Your Money: Exploiting Performance Heterogeneity in Public Clouds. In Proceedings of the Third ACM Symposium on Cloud Computing (SoCC’12). ACM, New York, NY, USA, Article 20, 14 pages. DOI:http://dx.doi.org/10.1145/2391229.2391249
- Fittkau et al. (2012) Florian Fittkau, Sören Frey, and Wilhelm Hasselbring. 2012. CDOSim: Simulating Cloud Deployment Options for Software Migration Support. In Proceedings of the 6th IEEE International Workshop on the Maintenance and Evolution of Service-Oriented and Cloud-Based Systems (MESOCA 2012). 37–46. DOI:http://dx.doi.org/10.1109/MESOCA.2012.6392599
- Frincu et al. (2014) Marc Frincu, Stephane Genaud, and Julien Gossa. 2014. On the Efficiency of Several VM Provisioning Strategies for Workflows with Multi-Threaded Tasks on Clouds. Computing (2014), 1–28. DOI:http://dx.doi.org/10.1007/s00607-014-0410-0
- Ghoshal et al. (2011) Devarshi Ghoshal, Richard Shane Canon, and Lavanya Ramakrishnan. 2011. I/O Performance of Virtualized Cloud Environments. In Proceedings of the Second International Workshop on Data Intensive Computing in the Clouds (DataCloud-SC ’11). ACM, New York, NY, USA, 71–80. DOI:http://dx.doi.org/10.1145/2087522.2087535
- Gillam et al. (2013) Lee Gillam, Bin Li, John O’Loughlin, and Anuz Pratap Singh Tomar. 2013. Fair Benchmarking for Cloud Computing Systems. Journal of Cloud Computing: Advances, Systems and Applications 2, 6 (2013).
- Gkatzikis and Koutsopoulos (2013) Lazaros Gkatzikis and Iordanis Koutsopoulos. 2013. Migrate or Not? Exploiting Dynamic Task Migration in Mobile Cloud Computing Systems. IEEE Wireless Communication (2013).
- Hazelhurst (2008) Scott Hazelhurst. 2008. Scientific Computing using Virtual High-Performance Computing: a Case Study using the Amazon Elastic Computing Cloud. In Proceedings of the 2008 Annual Research Conference of the South African Institute of Computer Scientists and Information Technologists on IT Research in Developing Countries (SAICSIT ’08), Vol. 338. ACM, 94–103.
- Hill and Humphrey (2009) Zach Hill and Marty Humphrey. 2009. A Quantitative Analysis of High Performance Computing with Amazon’s EC2 Infrastructure: the Death of the Local Cluster?. In GRID. IEEE, 26–33.
- Hill et al. (2010) Zach Hill, Jie Li, Ming Mao, Arkaitz Ruiz-Alvarez, and Marty Humphrey. 2010. Early Observations on the Performance of Windows Azure. In Proceedings of the 19th ACM International Symposium on High Performance Distributed Computing (HPDC’10). ACM, New York, NY, USA, 367–376. DOI:http://dx.doi.org/10.1145/1851476.1851532
- Imai et al. (2013) Shigeru Imai, Thomas Chestna, and Carlos A. Varela. 2013. Accurate Resource Prediction for Hybrid IaaS Clouds Using Workload-Tailored Elastic Compute Units. In Proceedings of the 6th IEEE/ACM International Conference on Utility and Cloud Computing (UCC 2013). Dresden, Germany.
- Iosup et al. (2011a) Alexandru Iosup, Simon Ostermann, Nezih Yigitbasi, Radu Prodan, Thomas Fahringer, and Dick Epema. 2011a. Performance Analysis of Cloud Computing Services for Many-Tasks Scientific Computing. IEEE Transactions on Parallel and Distributed Systems 22, 6 (June 2011), 931–945. DOI:http://dx.doi.org/10.1109/TPDS.2011.66
- Iosup et al. (2011b) Alexandru Iosup, Nezih Yigitbasi, and Dick Epema. 2011b. On the Performance Variability of Production Cloud Services. In Proceedings of the 2011 11th IEEE/ACM International Symposium on Cluster, Cloud and Grid Computing (CCGrid). 104–113. DOI:http://dx.doi.org/10.1109/CCGrid.2011.22
- Jackson et al. (2010) Keith R. Jackson, Lavanya Ramakrishnan, Krishna Muriki, Shane Canon, Shreyas Cholia, John Shalf, Harvey J. Wasserman, and Nicholas J. Wright. 2010. Performance Analysis of High Performance Computing Applications on the Amazon Web Services Cloud. In Proceedings of the 2010 IEEE Second International Conference on Cloud Computing Technology and Science (CLOUDCOM ’10). IEEE Computer Society, Washington, DC, USA, 159–168. DOI:http://dx.doi.org/10.1109/CloudCom.2010.69
- Jayasinghe et al. (2012) Deepal Jayasinghe, Galen Swint, Simon Malkowski, Jack Li, Qingyang Wang, Junhee Park, and Calton Pu. 2012. Expertus: A Generator Approach to Automate Performance Testing in IaaS Clouds. In Proceedings of the 2012 IEEE Fifth International Conference on Cloud Computing (CLOUD’12). IEEE Computer Society, Washington, DC, USA, 115–122. DOI:http://dx.doi.org/10.1109/CLOUD.2012.98
- Kitchenham et al. (2004) Barbara A. Kitchenham, Tore Dyba, and Magne Jorgensen. 2004. Evidence-Based Software Engineering. In Proceedings of the 26th International Conference on Software Engineering (ICSE’04). IEEE Computer Society, Washington, DC, USA, 273–281. http://dl.acm.org/citation.cfm?id=998675.999432
- Kossmann et al. (2010) Donald Kossmann, Tim Kraska, and Simon Loesing. 2010. An Evaluation of Alternative Architectures for Transaction Processing in the Cloud. In Proceedings of the 2010 ACM SIGMOD International Conference on Management of Data (SIGMOD’10). ACM, New York, NY, USA, 579–590. DOI:http://dx.doi.org/10.1145/1807167.1807231
- Kotthoff (2014) Lars Kotthoff. 2014. Reliability of Computational Experiments on Virtualised Hardware. Journal of Experimental & Theoretical Artificial Intelligence 26, 1 (2014), 33–49. DOI:http://dx.doi.org/10.1080/0952813X.2013.784812
- Leitner et al. (2012) Philipp Leitner, Benjamin Satzger, Waldemar Hummer, Christian Inzinger, and Schahram Dustdar. 2012. CloudScale: A Novel Middleware for Building Transparently Scaling Cloud Applications. In Proceedings of the 27th Annual ACM Symposium on Applied Computing (SAC’12). 434–440. http://doi.acm.org/10.1145/2245276.2245360
- Leitner and Scheuner (2015) Philipp Leitner and Joel Scheuner. 2015. Bursting With Possibilities – an Empirical Study of Credit-Based Bursting Cloud Instance Types. In Proceedings of the 8th IEEE/ACM International Conference on Utility and Cloud Computing (UCC).
- Lenk et al. (2011) Alexander Lenk, Michael Menzel, Johannes Lipsky, Stefan Tai, and Philipp Offermann. 2011. What Are You Paying For? Performance Benchmarking for Infrastructure-as-a-Service Offerings. In IEEE CLOUD, Ling Liu and Manish Parashar (Eds.). 484–491.
- Li et al. (2010) Ang Li, Xiaowei Yang, Srikanth Kandula, and Ming Zhang. 2010. CloudCmp: Comparing Public Cloud Providers. In Proceedings of the 10th ACM SIGCOMM Conference on Internet Measurement (IMC ’10). ACM, New York, NY, USA, 1–14. DOI:http://dx.doi.org/10.1145/1879141.1879143
- Li et al. (2013b) Zheng Li, Liam O’Brien, Rajiv Ranjan, and Miranda Zhang. 2013b. Early Observations on Performance of Google Compute Engine for Scientific Computing. In Proceedings of the 2013 IEEE International Conference on Cloud Computing Technology and Science (CLOUDCOM’13). IEEE Computer Society, Washington, DC, USA, 1–8. DOI:http://dx.doi.org/10.1109/CloudCom.2013.7
- Li et al. (2013a) Zheng Li, L. O’Brien, and He Zhang. 2013a. CEEM: A Practical Methodology for Cloud Services Evaluation. In Proceedings of the 2013 IEEE Ninth World Congress on Services (SERVICES). 44–51. DOI:http://dx.doi.org/10.1109/SERVICES.2013.73
- Li et al. (2012) Zheng Li, Liam O’Brien, He Zhang, and Rainbow Cai. 2012. On a Catalogue of Metrics for Evaluating Commercial Cloud Services. In Proceedings of the 2012 ACM/IEEE 13th International Conference on Grid Computing (GRID ’12). IEEE Computer Society, Washington, DC, USA, 164–173. DOI:http://dx.doi.org/10.1109/Grid.2012.15
- Li et al. (2013) Zheng Li, Liam O’Brien, He Zhang, and Rainbow Cai. 2013. On the Conceptualization of Performance Evaluation of IaaS Services. IEEE Transactions on Services Computing (2013).
- Mao and Humphrey (2012) Ming Mao and Marty Humphrey. 2012. A Performance Study on the VM Startup Time in the Cloud. In Proceedings of the 2012 IEEE Fifth International Conference on Cloud Computing (CLOUD’12). IEEE Computer Society, Washington, DC, USA, 423–430. DOI:http://dx.doi.org/10.1109/CLOUD.2012.103
- Mehrotra et al. (2012) Piyush Mehrotra, Jahed Djomehri, Steve Heistand, Robert Hood, Haoqiang Jin, Arthur Lazanoff, Subhash Saini, and Rupak Biswas. 2012. Performance Evaluation of Amazon EC2 for NASA HPC Applications. In Proceedings of the 3rd Workshop on Scientific Cloud Computing (ScienceCloud’12). ACM, New York, NY, USA, 41–50. DOI:http://dx.doi.org/10.1145/2287036.2287045
- OLoughlin and Gillam (2013) John OLoughlin and Lee Gillam. 2013. Towards Performance Prediction for Public Infrastructure Clouds: An EC2 Case Study. Proceedings of the 2013 IEEE 5th International Conference on Cloud Computing Technology and Science (CloudCom) 1 (2013), 475–480. DOI:http://dx.doi.org/10.1109/CloudCom.2013.69
- Ou et al. (2013) Zhonghong Ou, Hao Zhuang, Andrey Lukyanenko, Jukka K. Nurminen, Pan Hui, Vladimir Mazalov, and Antti Yla-Jaaski. 2013. Is the Same Instance Type Created Equal? Exploiting Heterogeneity of Public Clouds. IEEE Transactions on Cloud Computing (TCC) 1, 2 (2013), 201–214. DOI:http://dx.doi.org/10.1109/TCC.2013.12
- Phillips et al. (2011) Stephen C. Phillips, Vegard Engen, and Juri Papay. 2011. Snow White Clouds and the Seven Dwarfs. In Proceedings of the 2011 IEEE Third International Conference on Cloud Computing Technology and Science (CLOUDCOM ’11). IEEE Computer Society, Washington, DC, USA, 738–745. DOI:http://dx.doi.org/10.1109/CloudCom.2011.114
- Roberto R. Exposito and Doallo (2013) Xoan C. Pardo Juan Tourino Roberto R. Exposito, Guillermo L. Taboada and Ramon Doallo. 2013. Running Scientific Codes on Amazon EC2: a Performance Analysis of Five High-end Instances. Computer Science and Technology 13, 3 (2013).
- Sadooghi et al. (2015) Iman Sadooghi, Jesus Hernandez Martin, Tonglin Li, Kevin Brandstatter, Ketan Maheshwari, Tiago Pais Pitta de Lacerda Ruivo, Gabriele Garzoglio, Steven Timm, Yong Zhao, and Ioan Raicu. 2015. Understanding the Performance and Potential of Cloud Computing for Scientific Applications. IEEE Transactions on Cloud Computing (2015). DOI:http://dx.doi.org/10.1109/TCC.2015.2404821
- Schad et al. (2010) Jörg Schad, Jens Dittrich, and Jorge-Arnulfo Quiané-Ruiz. 2010. Runtime Measurements in the Cloud: Observing, Analyzing, and Reducing Variance. Proceedings of the VLDB Endowment 3, 1-2 (Sept. 2010), 460–471. http://dl.acm.org/citation.cfm?id=1920841.1920902
- Scheuner et al. (2015) Joel Scheuner, Jürgen Cito, Philipp Leitner, and Harald C. Gall. 2015. Cloud WorkBench: Benchmarking IaaS Providers based on Infrastructure-as-Code. In Proceedings of the 24th International World Wide Web Conference (WWW 2015) - Companion Volume. 239–242. DOI:http://dx.doi.org/10.1145/2740908.2742833
- Scheuner et al. (2014) Joel Scheuner, Philipp Leitner, Jürgen Cito, and Harald Gall. 2014. Cloud WorkBench - Infrastructure-as-Code Based Cloud Benchmarking. In Proceedings of the 6th IEEE International Conference on Cloud Computing Technology and Science (CloudCom’14).
- Serrano et al. (2015) Nicolas Serrano, Gorka Gallardo, and Josune Hernantes. 2015. Infrastructure as a Service and Cloud Technologies. IEEE Software 32, 2 (Mar 2015), 30–36. DOI:http://dx.doi.org/10.1109/MS.2015.43
- Silva-Lepe et al. (2008) Ignacio Silva-Lepe, Revathi Subramanian, Isabelle Rouvellou, Thomas Mikalsen, Judah Diament, and Arun Iyengar. 2008. SOAlive Service Catalog: A Simplified Approach to Describing, Discovering and Composing Situational Enterprise Services. In Proceedings of the 6th International Conference on Service-Oriented Computing (ICSOC’08). Springer-Verlag, Berlin, Heidelberg, 422–437. DOI:http://dx.doi.org/10.1007/978-3-540-89652-4_32
- Sobel et al. (2008) Will Sobel, Shanti Subramanyam, Akara Sucharitakul, Jimmy Nguyen, Hubert Wong, Arthur Klepchukov, Sheetal Patil, Armando Fox, and David Patterson. 2008. Cloudstone: Multi-Platform, Multi-Language Benchmark and Measurement Tools for Web 2.0. In Cloud Computing and Its Applications.
- Varadarajan et al. (2012) Venkatanathan Varadarajan, Thawan Kooburat, Benjamin Farley, Thomas Ristenpart, and Michael M. Swift. 2012. Resource-freeing Attacks: Improve Your Cloud Performance (at Your Neighbor’s Expense). In Proceedings of the 2012 ACM Conference on Computer and Communications Security (CCS’12). ACM, New York, NY, USA, 281–292. DOI:http://dx.doi.org/10.1145/2382196.2382228
- Walker (2008) Edward Walker. 2008. Benchmarking Amazon EC2 for High-Performance Scientific Computing. LOGIN 33, 5 (Oct. 2008), 18–23.
- Wang and Ng (2010) Guohui Wang and T. S. Eugene Ng. 2010. The Impact of Virtualization on Network Performance of Amazon EC2 Data Center. In Proceedings of the 29th Conference on Information Communications (INFOCOM’10). IEEE Press, Piscataway, NJ, USA, 1163–1171. http://dl.acm.org/citation.cfm?id=1833515.1833691
- Wang et al. (2011) Zhilin Wang, Xinhuai Tang, and Xiangfeng Luo. 2011. Policy-Based SLA-Aware Cloud Service Provision Framework. In Proceedings of the Seventh International Conference on Semantics Knowledge and Grid (SKG 2011). 114–121.
- Wen et al. (2015) Jiawei Wen, Lei Lu, Giuliano Casale, and Evgenia Smirni. 2015. Less Can Be More: Micro-managing VMs in Amazon EC2. In Proceedings of the 8th IEEE International Conference on Cloud Computing (CLOUD). 317–324. DOI:http://dx.doi.org/10.1109/CLOUD.2015.50