Issue Date \issuenumberIssue Number
Field-induced superconducting phase of FeSe in the BCS-BEC cross-over
Abstract
Fermi systems in the crossover regime between weakly coupled Bardeen-Cooper-Schrieffer (BCS) and strongly coupled Bose-Einstein-condensate (BEC) limits are among the most fascinating objects to study the behavior of an assembly of strongly interacting particles. The physics of this crossover has been of considerable interest both in the fields of condensed matter and ultracold atoms. One of the most challenging issue in this regime is the effect of large spin imbalance on a Fermi system under magnetic fields. Although several exotic physical properties have been predicted theoretically, the experimental realization of such an unusual superconducting state has not been achieved so far. Here we show that pure single crystals of superconducting FeSe offer the possibility to enter the previously unexplored realm where the three energies, Fermi energy , superconducting gap and Zeeman energy, become comparable. Through the superfluid response, transport, thermoelectric response, and spectroscopic-imaging scanning tunneling microscopy, we demonstrate that of FeSe is extremely small, with the ratio in the electron (hole) band. Moreover, thermal-conductivity measurements give evidence of a distinct phase line below the upper critical field, where the Zeeman energy becomes comparable to and . The observation of this field-induced phase provides insights into previously poorly understood aspects of the highly spin-polarized Fermi liquid in the BCS-BEC crossover regime.
keywords:
BCS-BEC crossover — Fermi energy — Quasiparticle interference — Iron-based superconductors — exotic superconducting phaseBCS, Bardeen-Cooper-Schrieffer; BEC, Bose-Einstein condensation; ARPES, angle-resolved photoemission spectroscopy; QPI, quasiparticle interference
Significance
The BCS-BEC crossover bridges the two important theories of bound particles in a unified picture with the ratio of the attractive interaction to the Fermi energy as a tuning parameter. A key issue is to understand the intermediate regime, where new states of matter may emerge. Here, we show that the Fermi energy of FeSe is extremely small, resulting in that this system can be regarded as an extraordinary “high-temperature” superconductor located at the verge of a BCS-BEC crossover. Most importantly, we discover the emergence of an unexpected superconducting phase in strong magnetic fields, demonstrating that the Zeeman splitting comparable to the Fermi energy leads to a strong modification of the properties of fermionic systems in such a regime.
Superconductivity in most metals is well explained by the weak-coupling BCS theory, where the pairing instability arises from weak attractive interactions in a degenerate fermionic system. In the opposite limit of BEC, composite bosons consisting of strongly coupled fermions condense into a coherent quantum state [1, 2]. In BCS superconductors, the superconducting transition temperature is usually several orders of magnitude smaller than the Fermi temperature, -, while in the BEC limit is of the order of . Even in the high- cuprates, is merely of the order of at optimal doping. Of particular interest is the BCS-BEC crossover regime with intermediate coupling strength. In this regime the size of interacting pairs (), which is known as the coherence length, becomes comparable to the average distance between particles (), i.e., [3, 4, 5], where is the Fermi momentum. This regime is expected to have the highest values of and ever observed in any fermionic superfluid.
One intriguing issue concerns the role of spin imbalance, whether it will lead to a strong modification of the properties of the Fermi system in the crossover regime. This problem has been of considerable interest not only in the context of superconductivity but also in ultracold-atom physics [6, 7, 8]. However, such Fermi systems have been extremely hard to access. In superconductors, the spin imbalance can be introduced through the Zeeman effect by applying a strong magnetic field. Again, in the high- cuprates, the Zeeman energy at the upper critical field at is of the order of only . In ultracold atoms, although several exotic superfluid states have been proposed [9, 10], cooling the systems down to sufficiently low temperature () is not easily attained.
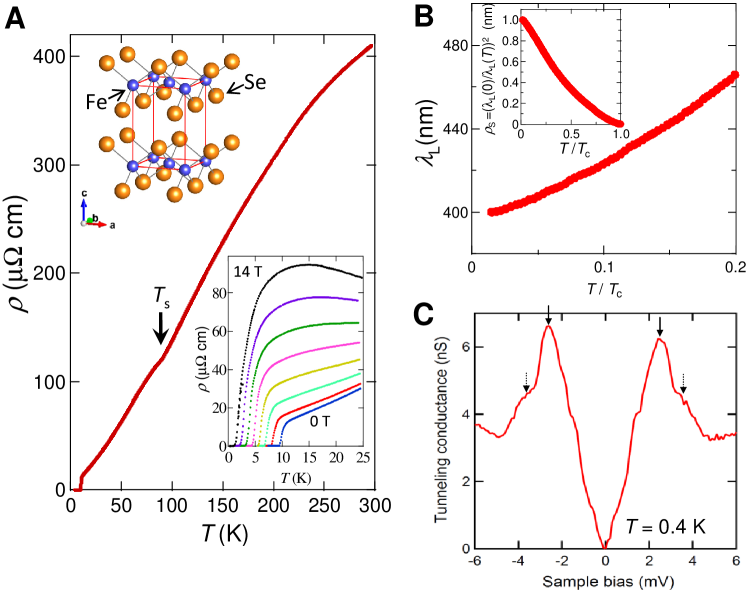
FeSe provides an ideal platform for studying a highly spin-polarized Fermi system in the crossover regime. FeSe is the simplest iron-based layered superconductor (Inset of Fig. 1A) with of 9 K [11]. The structural transition from tetragonal to orthorhombic crystal symmetry occurs at 90 K and a large electronic in-plane anisotropy appears. In contrast to the other iron-based compounds, no magnetic order occurs below . A prominent feature of the pseudobinary “11” family (FeSe1-xTex) is the presence of very shallow pockets, as reported by angle-resolved photoemission-spectroscopy (ARPES). Although a possible BCS-BEC crossover has been suggested in the bands around the -point [12, 13], it is still an open question whether all bands are in such a crossover regime. Moreover, it should be noted that high-quality single crystals are highly requisite for the study of the crossover regime, as exotic superconductivity often is extremely sensitive to impurities. Previous FeSex single crystals are strongly disordered, as indicated by large residual resistivity and small residual resistivity ratio , typically 0.1 mcm and 5, respectively [14].
1 Results and Discussion
1.1 BCS-BEC crossover
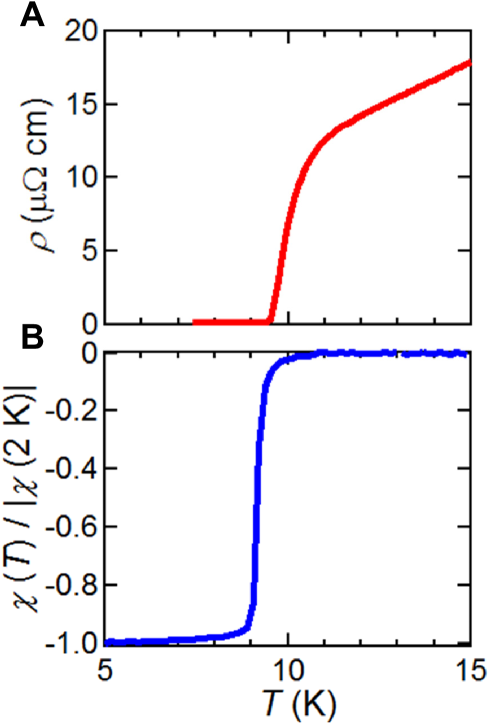
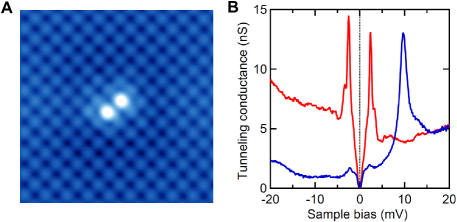
By using high-quality single crystals of FeSe (SI Text 1, Figs. S1 and S2) which have become available recently, we have measured the transport properties (Fig. 1A). In zero field, the temperature dependence of the resistivity can be described by with below 25 K. Taking cm as upper limit of leads to , i.e., a factor of 10 higher than previous samples. In the present crystals defined by the zero resistivity is 9.5 K, which is higher than K of the low samples [14]. A remarkably large magnetoresistance (Inset of Fig. 1A) not observed in previously studied low- crystals [14], supports that the crystal is very clean (SI Text 2, Fig. S3A). The strongly -dependent Hall coefficient below 60 K indicates that the electron and hole mobilities are of the same order (SI Text 2, Fig. S3B). The London penetration depth shows a quasi -linear dependence, , for , suggesting the presence of line nodes in the superconducting gap (Fig. 1B). Figure 1C shows the tunneling conductance which is proportional to the density of states, measured with a scanning tunneling microscope at 0.4 K. The V-shaped spectrum at low bias voltages likewise indicates the presence of line nodes, which is consistent with previously reported observations [15]. We note that the line nodes are accidental, not symmetry protected, i.e., the gap function is extended -wave, because the nodes are absent in samples with low [16]. Distinct peaks and shoulder structures in the spectra indicate the presence of (at least) two superconducting gaps ( 2.5 and 3.5 meV), reflecting the multiband nature.
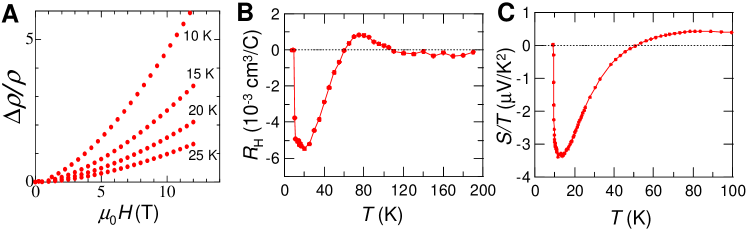
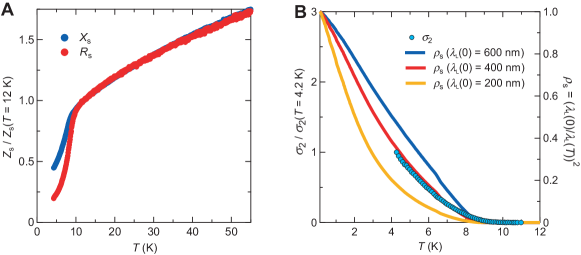
The high quality of the single crystals enables us to estimate the Fermi energies and from the band edges of electron and hole sheets, respectively, by using several techniques; all of them consistently point to extremely small Fermi energies. In 2D systems is related to as , where is the interlayer distance and is the vacuum permeability. From the dependence of , we obtain nm (Fig. 1B, SI Text 3, Fig. S4) [S6]. Very recent quantum oscillation measurements on the present FeSe crystals revealed that the Fermi surface consists of one hole sheet and one (compensating) electron sheet (see Fig. 2A) [S2]. Then can be written as , where and represent the contribution from the electron and hole sheets, respectively. Assuming that two sheets have similar effective masses as indicated by the Hall effect (see below and SI Text 2), we estimate meV. The magnitude of the Fermi energy can also be inferred from the thermoelectric response in the normal state (SI Text 2). From the Seebeck coefficient , the upper limit of is deduced to be 10 meV (SI Text 2, Fig. S3C). Moreover, the sign change of at 60 K (SI Text 2, Fig. S3B) indicates that the Fermi energies and are of similar size, a feature also observed in underdoped cuprate superconductors with small electron and hole pockets [19]. In contrast to the cuprate case, however, in FeSe almost vanishes at high temperatures, which sheds light on the unique feature of FeSe with extremely small Fermi energy.
We can determine the electron and hole Fermi energies directly by measuring the electronic dispersion curves in momentum space yielding () for the hole (electron) band. Here () is the energy of the top (bottom) of the hole (electron) band and is the electrochemical potential. For this assignment, we exploit spectroscopic-imaging scanning tunneling microscopy to observe the quasiparticle interference (QPI) patterns [20, 21] associated with electron waves scattered off by defects. By taking the Fourier transform of energy-dependent normalized conductance images, characteristic wave vectors of electrons at different energies reflecting the band dispersion, can be determined (SI Text 4). The observed QPI patterns of FeSe at 1.5 K (SI Text 4, Fig. S5) consist of hole- and electron-like branches that disperse along the crystallographic and directions, respectively. These branches can naturally be ascribed to the hole and electron sheets illustrated in Fig. 2A. The QPI signals exhibit a strong in-plane anisotropy. Such an anisotropy is consistent with the largely elongated vortex core structure [15]. The origin of the strong in-plane anisotropy of the QPI signals is unclear, but a possible cause may be the orbital ordering in the orthorhombic phase.
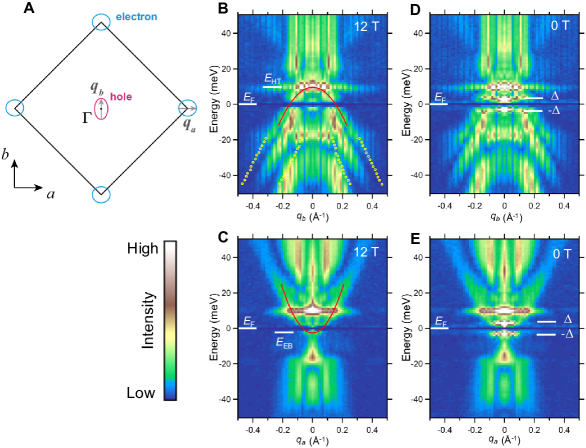
As shown in Figs. 2B and 2C, full dispersion curves of hole- and electron-like branches are clearly identified by taking linecuts from the series of Fourier-transformed conductance images (SI Text 4, Fig. S5). Here, a magnetic field T is applied parallel to the axis () to mostly suppress superconductivity. Multiple hole-like branches are identified in Fig. 2B. Since QPI signals include both intra- and interband scattering processes, it is difficult to disentangle all the QPI branches in order to resolve the bare band structure. Nevertheless, the top of the hole band can be faithfully determined to yield 10 meV from the highest energy of the top-most branch. This branch is quantitatively consistent with the intra-band scattering associated with the -band detected by ARPES [22]. In the case of the electron-like branch, an even smaller band bottom of 2 – 3 meV is estimated (Fig. 2C). These small values are consistent with the ones estimated from the superfluid and thermoelectric responses. The effective mass of electron (hole) determined by QPI assuming parabolic dispersion is 2.5 (3.5 ), where is the free-electron mass. The observation of comparable effective masses of electrons and holes is consistent with the Hall-effect data (SI Text 2). We stress that the electronic structure obtained from QPI, including masses of electron and hole, the size and the number of each pocket, and the magnitude of the Fermi energies, is consistent with the values recently reported by the quantum oscillations in the quantitative level [S2]. Remarkably, the superconducting gaps are of the same order as the Fermi energy of each band, (Fig. 2D) and (Fig. 2E), implying the BCS-BEC crossover regime. Additional strong support of the crossover is provided by extremely small 1 – 4. Here of the electron (hole) sheet obtained from Fig. 2C (Fig. 2B) is roughly 0.3 (0.75) nm-1, and determined from the upper critical field ( T) is roughly 5 nm.
1.2 Field-induced superconducting phase
So far we discussed the relation between and . How does the Zeeman energy scale , where is the Bohr magneton, enter the game? The thermal conductivity is well suited to address the issue of how the magnetic field affects the extraordinary pairing state by probing quasiparticle excitations out of the superconducting condensate, as the Cooper pair condensate does not contribute to heat transport. Figure 3A shows the dependence of in zero field. Below , is enhanced due to the suppression of quasiparticle scattering rates owing to the gap formation. As shown in the inset of Fig. 3A, at low temperatures is well fitted as , similar to Tl2Ba2CuO6+δ [23]. The presence of the residual at is consistent with line nodes in the gap.
Figure 3B shows the dependence of for well below obtained after averaging over many field sweeps at constant temperatures. Beyond the initial steep drop at low fields, likely caused by the suppression of the quasiparticle mean free path through the introduction of vortices, becomes nearly -independent. Similar behavior has been reported for Bi2Sr2CaCu2O8 [24] and CeCoIn5 [25]. It has been suggested that the nearly -independent reflects a compensation between the enhancement of the density of states by magnetic field in nodal superconductors (Doppler shift) and the concomitant reduction in due to increased scattering from vortices [26]. At high fields, above the smoothly varying background, exhibits a cusp-like feature at a field that is practically independent of . The height of the cusp-like peak decreases with increasing . To further analyze our data, the values at different temperatures are extrapolated to for each field value measured to yield as shown in Fig. 3C, corroborating the robustness of the cusp. In particular, the cusp of is unrelated to phonon heat transport because phonons do not contribute to for . Since the thermal conductivity has no fluctuation corrections [27], the cusp of usually corresponds to the mean-field phase transition. We note that at the field dependence of magnetic torque shows no discernible anomaly (SI Text 5, Fig. S7). However, such a difference of the sensitivity to the transition in different measurements has been reported for the field-induced transition between two superconducting phases in CeCoIn5, which is hardly resolved in magnetization[28], despite clear anomaly in some other bulk probes[29]. Moreover, the hysteresis in the magnetization due to vortex pinning may smear out a possible torque anomaly at .
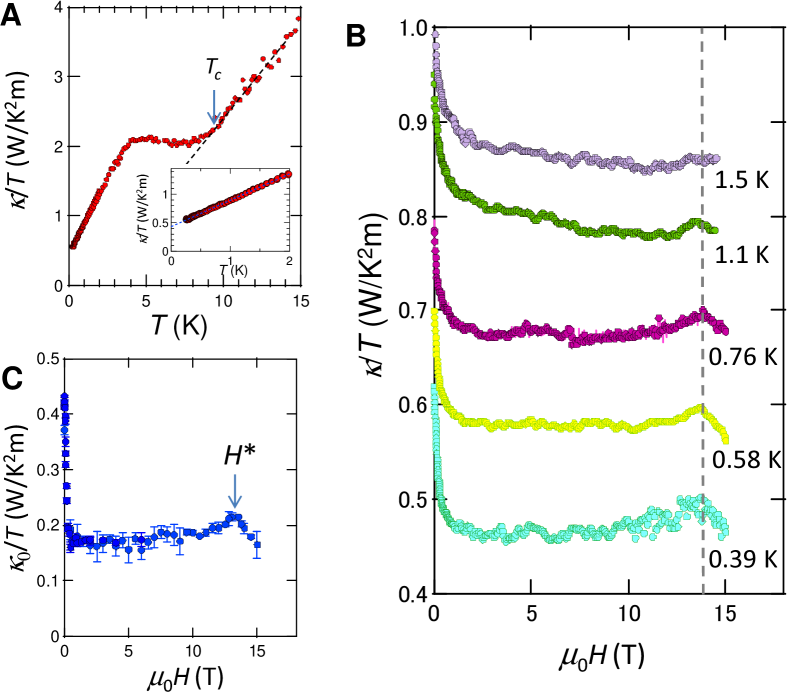
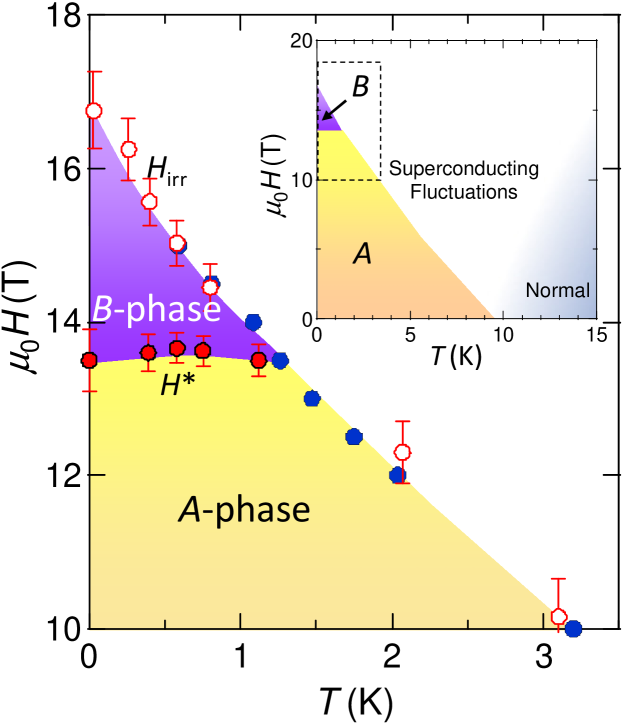
Figure 4 displays the - phase diagram for . The irreversibility fields at low temperatures extend to fields well above , indicating that is located inside the superconducting state. The anomaly at is not caused by some changes of the flux-line lattice, such as melting transition, because the peak field determined by the torque is strongly -dependent and well below (SI Text 5, Fig. S7), indicating that the flux-line lattice is already highly disordered at .
As shown in the inset of Fig. 1A, the resistivity at T increases with decreasing temperature and decreases after showing a broad maximum at around 15 K. The -dependence at high temperature is a typical behavior of the very pure compensated semimetals. However, the decrease of the resistivity at low temperature regime is not expected in conventional semimetals. This unusual decrease may be attributed to the strong superconducting fluctuations above (inset of Fig. 4). In higher fields the fluctuation region expands to higher . In fact, the Ginzburg number, which is given by within the BCS framework [30], is orders of magnitude larger than in any other superconductors. This large range of fluctuations may be related to the presence of preformed pairs predicted in the BCS-BEC crossover regime [1, 3, 4, 5].
The appearance of the high-field phase (B-phase in Fig. 4) where three characteristic energy scales are comparable, , suggests a phase transition of the Fermi liquid with strong spin imbalance in the BCS-BEC crossover regime. Whether the observed distinct phase arises from strong spin imbalance and/or a BCS-BEC crossover, however, needs to be resolved in the future with particular attention to multiband effects. We discuss two possible scenarios. (1) The phase line might signal an electronic transition akin to a Lifshitz transition, i.e., a topology change of the Fermi surface. Indeed the phase line would be independent of and smeared by thermal fluctuations. However, the fact that this phase line vanishes at would be accidental. Furthermore, the absence of any discernible anomaly in torque magnetometry at (SI Text 5, Fig. S7) implies that the anomaly at is not caused by a Lifshitz transition nor, for that matter, by a spin-density-wave type of magnetic order. (2) Comparable Fermi and Zeeman energies may lead to an unprecedented superconducting state of highly spin-polarized electrons, such as spin-triplet pairing and an admixture of even- and odd-frequency pairing [31]. Comparable gap and Zeeman energies may alternatively induce a Fulde-Ferrell-Larkin-Ovchinnikov (FFLO)-like state with Cooper pairs having finite total momentum (, ) owing to the pairing channel between the Zeeman-split Fermi surfaces [29]. The FFLO state requires a large Maki parameter, i. e., a ratio of orbital and Pauli-paramagnetic limiting fields, in the BCS limit. In this regime, , yielding, for FeSe, as large as () in the electron (hole) pockets. This estimate may be questionable in the regime of for FeSe. In any case, we stress that the high-field phase is not a simple FFLO phase because in the multiband superconductor FeSe the interaction between electron and hole bands is crucial. Even in the single band systems, it has been suggested that the FFLO state becomes unstable in the crossover regime [32]. Our work should motivate further studies in the field of strongly interacting Fermi liquids near the BCS-BEC crossover regime and in the presence of large spin imbalance, which remains largely unexplored and might bridge the areas of condensed-matter and ultracold-atom systems.
Acknowledgements.
We thank A. E. Böhmer, A. V. Chubukov, I. Eremin, P. J. Hirschfeld, H. Kontani, S. S. Lee, C. Meingast, A. Nevidomskyy, L. Radzihovsky, M. Randeria, I. Vekhter, and Y. Yanase for valuable discussion. This work has been supported by Japan – Germany Research Cooperative Program, Grant-in-Aid for Scientific Research (KAKENHI) from Japan Society for the Promotion of Scienceand Project No. 56393598 from German Academic Exchange Service, and the “Topological Quantum Phenomena” (No. 25103713) KAKENHI on Innovative Areas from Ministry of Education, Culture, Sports, Science and Technology of Japan.References
- [1] Noziéres P, & Schmitt-Rink S (1985) Bose condensation in an attractive fermion gas: From weak to strong coupling superconductivity. J Low Temp Phys 59:195-211.
- [2] Leggett AJ (1980) Modern trends in the theory of condensed matter. ed. Pekalski A, & Przystawa R (Springer-Verlag, Berlin).
- [3] Chen Q, Stajic J, Tan S, & Levin K (2005) BCS-BEC crossover: From high temperature superconductors to ultracold superfluids. Phys Rep 412:1-88.
- [4] Giorgini S, Pitaevskii LP, & Stringari, S (2008) Theory of ultracold atomic Fermi gases. Rev Mod Phys 80:1215.
- [5] Randeria M, & Taylor E (2014) Crossover from Bardeen-Cooper-Schrieffer to Bose-Einstein condensation and the unitary Fermi gas. Annu Rev Condens Matter Phys 5:209-232.
- [6] Chevy F, & Mora C (2010) Ultra-cold polarized Fermi gases. Rep Prog Phys 73:112401.
- [7] Shin Y, Schunck CH, Schirotzek A, & Ketterle W (2007) Phase diagram of a two-component Fermi gas with resonant interactions. Nature 451:689-693.
- [8] Gubbels KB, & Stoof HTC (2012) Imbalanced Fermi gases at unitarity. Phys Rep 525:255-313.
- [9] Gubankova E, Liu WV, & Wilczek F (2003) Breached pairing superfluidity: Possible realization in QCD. Phys Rev Lett 91:032001.
- [10] Yoshida N, & Yip S-K (2007) Larkin-Ovchinnikov state in resonant Fermi gas. Phys Rev A 75:063601.
- [11] Hsu F-C, et al. (2008) Superconductivity in the PbO-type structure -FeSe. Proc Natl Acad Sci 105:14262-14264.
- [12] Lubashevsky Y, Lahoud E, Chashka K, Podolsky D, & Kanigel A (2012) Shallow pockets and very strong coupling superconductivity in FeSexTe1-x. Nat Phys 8:309-312.
- [13] Okazaki K, et al. (2014) Superconductivity in an electron band just above the Fermi level: possible route to BCS-BEC superconductivity. Scientific Reports 4:4109.
- [14] Braithwaite D, et al. (2009) Superconducting and normal phases of FeSe single crystals at high pressure. J Phys: Condens Matter 21:232202.
- [15] Song C-L, et al. (2011) Direct observation of nodes and twofold symmetry in FeSe superconductor. Science 332:1410-1413.
- [16] Dong, J. K. et al. Multigap nodeless superconductivity in FeSex: Evidence from quasiparticle heat transport Phys. Rev. B 80, 024518 (2009).
- [17] Hashimoto K, et al. (2012) A sharp peak of the zero-temperature penetration depth at optimal composition in BaFe2(As1-xPx)2. Science 336:1554-1557.
- [18] Terashima T, et al. (2014) Anomalous Fermi surface in FeSe seen by Shubnikov-de Haas oscillation measurements. Phys Rev B 90:144517.
- [19] LeBoeuf D, et al. (2011) Lifshitz critical point in the cuprate superconductor YBa2Cu3Oy from high-field Hall effect measurements. Phys Rev B 83:054506.
- [20] Hasegawa Y, & Avouris Ph (1993) Direct observation of standing wave formation at surface steps using scanning tunneling spectroscopy. Phys Rev Lett 71:1071.
- [21] Crommie MF, Lutz CP, & Eigler DM (1993) Imaging standing waves in a two-dimensional electron gas. Nature 363:524-527.
- [22] Maletz J, et al. (2014) Unusual band renormalization in the simplest iron-based superconductor. Phys Rev B 89:220506(R).
- [23] Hawthorn DG, et al. (2007) Doping dependence of the superconducting gap in Tl2Ba2CuO6+δ from heat transport. Phys Rev B 75:104518.
- [24] Krishana K, Ong NP, Li Q, Gu GD, & Koshizuka N (1997) Plateaus observed in the field profile of thermal conductivity in the superconductor Bi2Sr2CaCu2O8. Science 277:83-85.
- [25] Kasahara Y, et al. (2005) Anomalous quasiparticle transport in the superconducting state of CeCoIn5. Phys Rev B 72:214515.
- [26] Franz M (1999) Mixed-state quasiparticle transport in high- cuprates. Phys Rev Lett 82:1760.
- [27] Vishveshwara S, & Fisher MPA (2001) Critical dynamics of thermal conductivity at the normal-superconducting transition. Phys Rev B 64:134507.
- [28] Tayama T, et al. (2002) Unconventional heavy-fermion superconductor CeCoIn5: dc magnetization study at temperatures down to 50 mK. Phys Rev B 65:180504(R).
- [29] Matsuda Y, & Shimahara H (2007) Fulde-Ferrell-Larkin-Ovchinnikov state in heavy fermion superconductors. J Phys Soc Jpn 76:051005.
- [30] Larkin AI, & Varlamov AA (2013) Fluctuation phenomena in superconductors. arXiv:cond-mat/0109177.
- [31] Yanase Y (2008) FFLO superconductivity near the antiferromagnetic quantum critical point. J Phys Soc Jpn 77:063705.
- [32] Radzihovsky L , & Sheehy DE (2010) Imbalanced Feshbach-resonant Fermi gases. Rep Prog Phys 73:076501.
Supporting Information
Kasahara et al.
2 SI1–Sample growth and characterization
High-quality single crystals of tetragonal -FeSe were grown by the vapor transport method at Karlsruhe Institute of Technology [S1]. A mixture of Fe and Se powders was sealed in an evacuated SiO2 ampoule together with KCl and AlCl3 powders. The ampoule was heated to 390∘C on one end while the other end was kept at 240∘C. After 28.5 days, single crystals of FeSe with tetragonal morphology were extracted at the cold end. We note that the crystals grow directly in the tetragonal phase at these temperatures, resulting in high-quality single crystals free from structural transformations or decomposition reactions. Wavelength dispersive X-ray spectroscopy reveals an impurity level below 500 ppm. In particular, there is no evidence of Cl, Si, K or Al impurities. X-ray diffraction confirms the tetragonal structure with lattice constants = 3.7707(12) Å and = 5.521(3) Å. Structural refinement shows the stoichiometric composition of Fe and Se within the error (Fe:Se=0.995(4):1). The structural parameter of Se is . No indications for interstitial atoms were found.
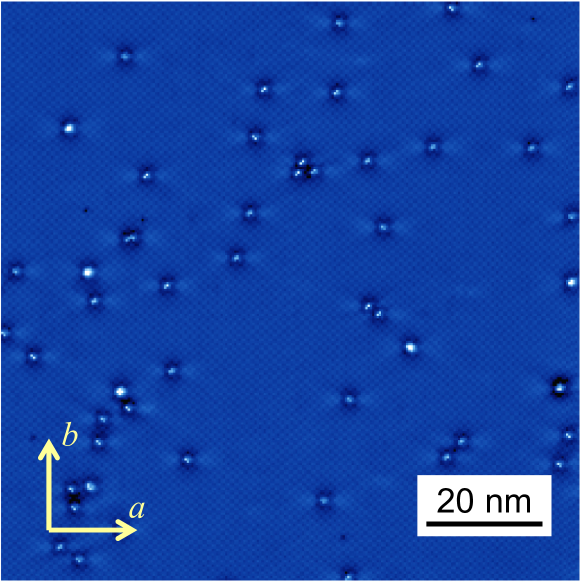
The extremely small level of impurities and defects (less than one impurity per 2000 Fe atoms) are confirmed by scanning tunneling microscope (STM) topography (Fig. S1).
Figures S2B shows the magnetic susceptibility of the sample used for the penetration depth measurements (Fig. 1B), which is measured by superconducting quantum interference device magnetometer under zero-field-cooling condition with a field applied parallel to the axis ( Oe). The sample size is approximately m3. The susceptibility shows sharp transition with the width (10-90%) of 0.3 K and defined as the mid-point of the transition is 9.25 K. Figure S2A shows the resistive transition of another sample of the same batch (inset of Fig. 1A). The temperature at which the resistivity goes to zero is 9.40 K, which is very close to determined by .
The high quality of our samples allow observing quantum oscillations above [S2]. The results, together with large value (Fig. 1A), large magetoresistance (inset of Fig. 1A) and extremely small level of impurities and defects (Fig. S1), demonstrate that the crystals used in the present study are very clean.
3 SI2–Transport measurements
Thermal conductivity and magnetoresistance were measured on the same crystal ( m3) using the same contacts. We attached the contacts after cleaving the surface. The thermal conductivity was measured by the standard steady-state method in a dilution refrigerator. Hall and Seebeck measurements were performed on another crystal ( m3).
Above 10 K, the magnetoresistance exhibits a ( dependence without saturation (Fig. S3A), which demonstrates the nearly perfect compensation, i.e., an equal density of electrons and holes, . In a compensated metal, the magnetoresistance is given by , where is the cyclotron frequency for carriers with mass and scattering time [S3]. The suffixes e and h denote “electron” and “hole”, respectively. At K we estimate at 10 T, indicating the high mobility of charge carriers.
Figure S3B shows the temperature dependence of the Hall coefficient in the zero-field limit. Above 100 K, is close to zero. Below 60 K, is negative and strongly temperature dependent. In a compensated metal, the Hall coefficient is given by [S3]. The strong dependence of indicates that the electron and hole mobilities are of the same order [S4], which is consistent with the QPI results.
Figure S3C shows the temperature dependence of the Seebeck coefficient divided by , . Below 40 K, is negative. The Seebeck coefficient in the single-band case is expected to be -linear in the zero-temperature limit and linked to by . In a multiband system with both electrons and holes contributing with opposite signs to the overall Seebeck response, the single-band formula sets an upper limit to the Femi energy of the dominant band [S5]. From V/K2 at low temperatures above , we estimate the upper limit of to be 10 meV.
4 SI3–London penetration depth
To determine the absolute value of the in-plane London penetration depth in a small single crystal reliably, we combined the high-precision tunnel diode oscillator (TDO) (resonant frequency of 13 MHz) and the microwave cavity perturbation ( 28 GHz) techniques [S6].
For the TDO technique, we can determine the change of the London penetration depth by the change of the resonant frequency , . The calibration factor is determined from the geometry of the sample. We measured down to 100 mK.
For the microwave cavity perturbation technique, we used a superconducting cavity resonator with high -factor (). We measured the microwave surface impedance in the Meissner state down to 4.2 K, where and are the surface resistance and reactance, respectively (Fig. S4A). In the present frequency range, the complex conductivity in the skin-depth regime is given by through the relation:
| (S1) |
In the Hagen-Rubens limit, , where is the microwave frequency and is the scattering rate, is related to by . In Fig. S4B, the blue circles show K), which represent the normalized superfluid density . The solid lines represent obtained from assuming several different values. The best fit is obtained for nm.
5 SI4–Quasiparticle interference
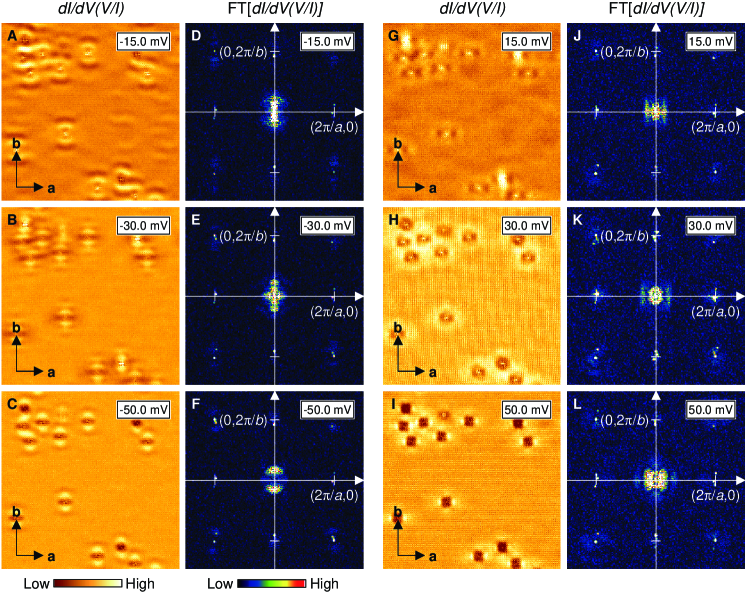
Figures S5A-L show the energy dependent QPI patterns at 12 T. Figures S5A-C display the normalized conductance images of occupied states. In order to avoid the so-called set-point effect associated with the spatial variation of the integrated density of states [S7], raw conductance data is normalized by , where and are tunneling current and bias voltage, respectively [S8]. The nearest-neighbor Fe-Fe distance is larger along the axis than along the axis. Figures S5D-F display Fourier-transformed images of Figures S5A-C. Figures S5G-I display the normalized conductance images of unoccupied states. Figures S5J-L display Fourier-transformed images of Figures S5G-I.
Figure S6A shows STM topographic image of the dumbbell-shaped impurity. Figure S6B shows STS spectra at the impurity (blue) and at the position far from the impurity (red). A sharp peak at meV in the STS spectrum (blue) arises from the impurity bound state, which gives rise to the -independent dispersion shown in Figs. 2B-E.
6 SI5–Magnetic torque
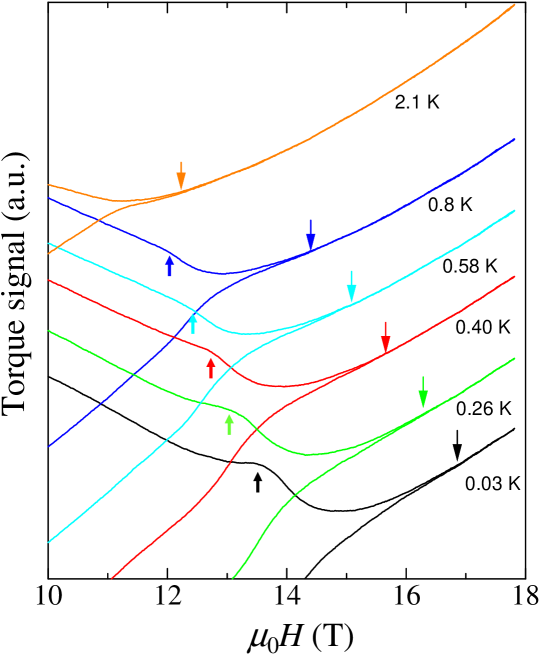
The magnetic torque was measured using a piezo-resistive micro-cantilever technique down to 30 mK and up to 17.8 T. A small single crystal of approximately m3 was mounted on the lever with a tiny amount of Apiezon grease. The field is slightly tilted away from the axis. Figure S7 shows the field dependence of the torque signal. The irreversibility field is defined by the point where the hysteresis loop has closed to a level of 0.3% (arrows pointing down). We note that determined by the magnetic torque coincides well with the defined by the zero resistivity as shown in Fig. 4 in the main text. A broad peak effect associated with the order-disorder transition of the flux-line lattice is observed after subtraction of a smooth background (arrows pointing up indicate the maximum). The peak field is seen to be strongly temperature dependent, in contrast to the line.
References
- [S1] Böhmer AE, et al. (2013) Lack of coupling between superconductivity and orthorhombic distortion in stoichiometric single-crystalline FeSe. Phys Rev B 87:180505(R).
- [S2] Terashima T, et al. (2014) Anomalous Fermi surface in FeSe seen by Shubnikov-de Haas oscillation measurements. Phys Rev B 90:144517.
- [S3] Pippard AB (1989) Magnetoresistance in metals (Cambridge University Press, Cambridge, U.K.).
- [S4] Kasahara Y, et al. (2007) Exotic superconducting properties in the electron-hole-compensated heavy-Fermion “semimetal” URu2Si2. Phys Rev Lett 99:116402.
- [S5] Pourret A, et al. (2011) Strong correlation and low carrier density in Fe1+yTe0.6Se0.4 as seen from its thermoelectric response. Phys Rev B 83:020504(R).
- [S6] Hashimoto K, et al. (2012) A sharp peak of the zero-temperature penetration depth at optimal composition in BaFe2(As1-xPx)2. Science 336:1554-1557.
- [S7] Chen CJ (2008) Introduction to scanning tunneling microscopy (Oxford Press).
- [S8] Feenstra RM, Stroscio JA, & Fein AP (1987) Tunneling spectroscopy of the Si(111)2 1 surface. Surf Sci 181:295-306.