Sunspot Waves and Triggering of Homologous Active Region Jets
Abstract
We present and discuss multi-wavelength observations of five homologous recurrent solar jets that occurred in active region NOAA 11133 on 11 December, 2010. These jets were well observed by the Solar Dynamic observatory (SDO) with high spatial and temporal resolution. The speed of the jets ranged between 86 and 267 km s-1. A type III radio burst was observed in association with all the five jets. The investigation of the over all evolution of magnetic field in the source regions suggested that the flux was continuously emerging on longer term. However, all the jets but J5 were triggered during a local dip in the magnetic flux, suggesting the launch of the jets during localised submergence of magnetic flux. Additionally, using the PFSS modelling of the photospheric magnetic field, we found that all the jets were ejected in the direction of open field lines. We also traced sunspot oscillations from the sunspot interior to foot-point of jets and found presence of 3 minute oscillations in all the SDO/AIA passbands. The wavelet analysis revealed an increase in amplitude of the oscillations just before the trigger of the jets, that decreased after the jets were triggered. The observations of increased amplitude of the oscillation and its subsequent decrease provides evidence of wave-induced reconnection triggering the jets.
keywords:
Sun: jets – Sun: magnetic field – Sun: sunspots – Sun: magnetic reconnection – oscillations1 Introduction
Solar jets are active phenomena in the solar atmosphere observed as collimated ejection of plasma. Jets were first discovered in the observations recorded by the Soft X-ray telescope (Tsuneta & Acton, 1991) onboard Yohkoh. Several studies have been performed on the estimation of different physical parameters of jets such as length, width, velocity and lifetime etc (see e.g., Shimojo et al., 1996; Shimojo & Shibata, 2000; Uddin et al., 2012; Schmieder et al., 2013). The typical length of the jets ranges between 104 to 105 km, and the width varies from 103 to 105 km with a typical speed of about 200 km s-1. Often, these X-ray jets are observed along with surges observed in H filtergrams, which are essentially the cooler counterparts of the hot jets, observed at chromospheric temperatures (Schmieder et al., 1995; Canfield et al., 1996; Uddin et al., 2004; Chandra et al., 2006). However, their different observational manifestations may not be temporally and spatially aligned (Chae et al., 1999; Liu & Kurokawa, 2004).
Observations across a range of wavelengths have provided evidences in support of magnetic reconnection models as the trigger of solar jets (Heyvaerts et al. 1977; Yokoyama et al. 1995; Isobe Tripathi 2006; Chifor et al. 2008a,b; Moreno-Insertis et al. 2008; Isobe et al. 2007; Pariat et al. 2009, 2010; Archontis Hood 2012; Guo et al. 2013; Mulay et al. 2014). Using the observations recorded by Hinode/EIS, Chifor et al. (2008a) studied the recurring jets of 15 & 16 January, 2007 and measured temperature, Doppler shift, density, and filling factor in the jets. Their results of high density, small filling factor along with red and blue shifted emissions suggested the occurrence of multiple small-scale magnetic reconnection events leading to the production of observed jets.The models for Quasi-Separatrix Layers (QSLs) (Mandrini et al., 1996) and null point reconnection (Török et al., 2009) have also been considered for the initiation of jets.
In a statistical study of active region jets, Shimojo et al. (1996) found that the jets are most often observed towards the western side of the leading spot. Later Shimojo & Shibata (2000) and Pariat et al. (2010) found multi-polar magnetic field configuration in the source regions, often having anemone magnetic structure (Shibata et al., 1992; Shimojo et al., 1996; Török et al., 2009). An anemone magnetic structure is a type of active region where one magnetic polarity is surrounded by opposite polarity regions. It was later suggested that observations of jets in active regions with anemone magnetic topology provides strong indication of 3D null point coronal magnetic reconnection (Török et al., 2009).
Occasionally, jets show recurring and successive occurrence at the same location with very similar morphological features. Such type of jets are called homologous jets. By performing a 3D modeling of homologous jets, it was shown that the homology of jets can be produced due to reconnection at 3D null points (Pariat et al., 2010). According to Pariat et al. (2010), the homology of the jets is the result of formation of 3D null-point topology system driven continuously by twisted motion. However, there are studies, where the recurrent homologous jets occur without null point topology (Mandrini et al., 1996; Schmieder et al., 1997; Guo et al., 2013). Therefore, the cause of recurring homologous jets is a matter of strong debate.
While analysing quiet Sun transition region explosive events, Ning et al. (2004) found that in some cases, explosive events within a burst were separated by 3-5 min, and suggested the role of the wave-induced reconnection in triggering the individual events. MHD simulations (e.g., Chen & Priest, 2006; Heggland et al., 2009) have suggested that wave-induced reconnection is a viable mechanism for initiation of jets. Recently Innes et al. (2011) reported the relationship between the triggering of a jet and sunspot oscillations. However, the role of the oscillations played in triggering of these jets is are still not clear.
In this paper, we present a multi-wavelength observations of homologous jets occurring in NOAA AR 11133 on 11 December, 2010. The active region was located at N15W23 on the solar disk on 11 December, 2010. In section 2, we present the observational characteristics of the jets followed by the structure and evolution of magnetic field in the source regions in Section 3. The associated type III radio bursts as observed by WIND/WAVES are presented in section 4. We discuss the dynamics of the associated sunspot and associated wave in section 5. Finally, we discuss and conclude our results in section 6.
2 Morphological, temporal and spatial evolution of jets
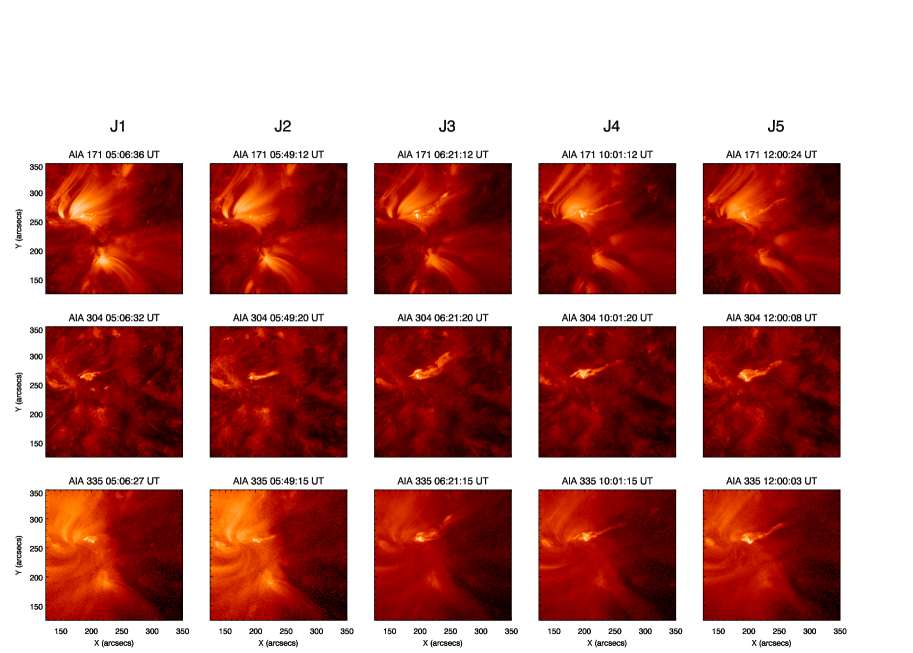
The Atmospheric Imaging Assembly (AIA, Lemen et al., 2012) onboard the Solar Dynamic Observatory (SDO, Pesnell et al., 2012) observes the full disk of the Sun using seven different UV-EUV filters with an average cadence of 12 sec and pixel size of 0.6″. For the present study, we have used the observations recorded by 171 Å, 304 Å and 335 Å filters. Figure 1 displays the images of the five jets observed at 171 Å (first row), 304 Å (second row), and 335 Å (third row). The five jets are labelled in the figure as J1, J2, J3, J4 and J5. The AIA observations are processed using standard processing software as provided in the solar software distribution. The AIA observations show that all the observed five jets are homologous. They originate from the same location and ejected in the same north-west direction except the jet J3, which was directed a bit northward than the others.
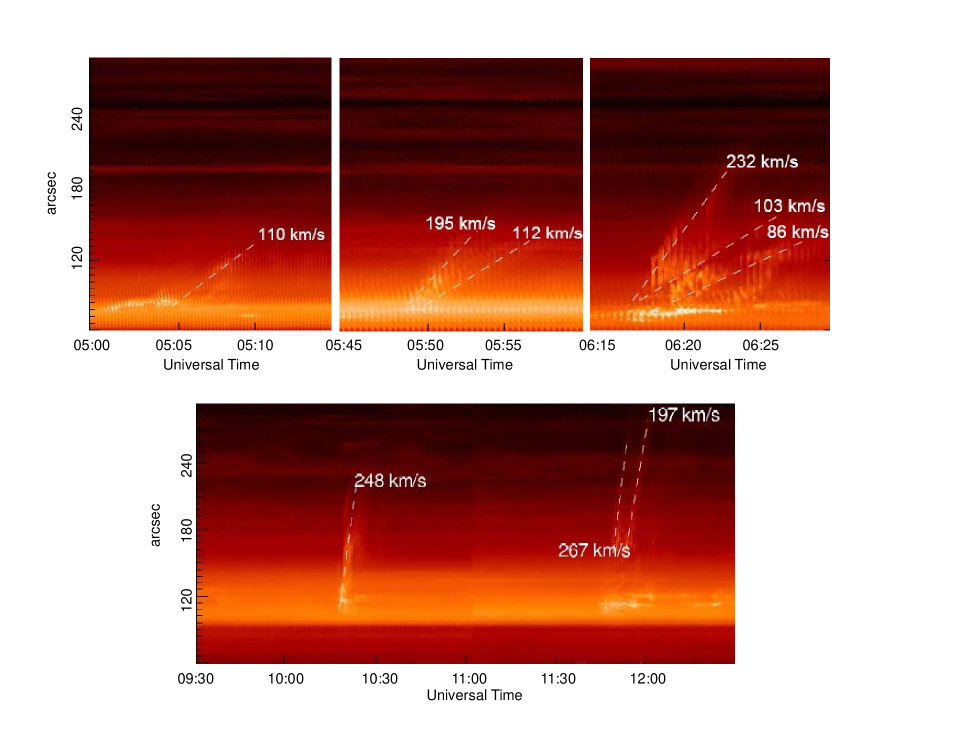
In order to estimate the speeds of the jets, we have performed the study of kinematics of the jets by using the time-slice techniques on the 171 Å data. As mentioned earlier, since all the five jets are not exactly in the same direction, it is not feasible to employ a slit in one fixed direction, which can study the time-slice analysis for all given jets. Therefore, it is mandatory to employ different slits for different jets. For all the jets, the slit is aligned along the direction of plasma flow and centred on the jet. Figure 2 show the height–time diagram for all five jet events as obtained by time-slice analysis. For the first jet ‘J1’ (shown in the top left panel), the speed is 110 km s-1 and the projected height of the jet is 95 Mm. In the case of ‘J2’ jet, the computed speeds are 195 and 112 km s-1 and the projected height is 96 Mm, which is close to the projected height of jet ‘J1’. Jet ‘J3’ shows the time-slice pattern of different speeds ranging from 86 to 232 km s-1. The maximum height attained by the jet ‘J3’ is 143 Mm. The projected speeds for jets ‘J4’ and ‘J5’ are 248 and 267 km s-1 and the maximum heights ares 165 and 204 Mm respectively. Our above computed speeds are comparable to earlier observed speeds (see e.g., Shimojo et al., 1996; Cirtain et al., 2007; Patsourakos et al., 2008; Schmieder et al., 2013).

3 Evolution of Magnetic field
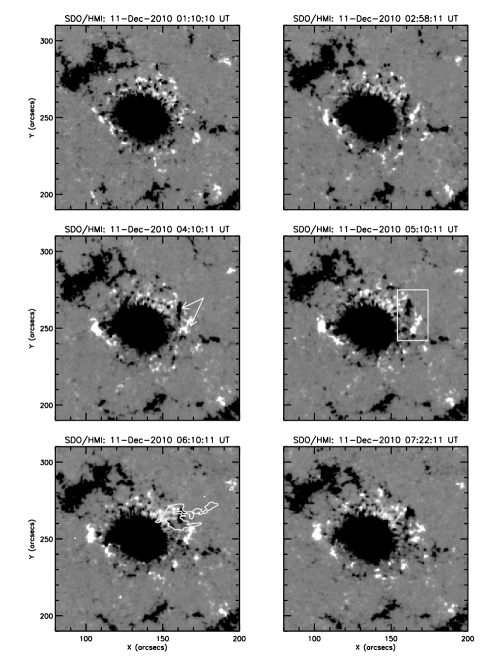
In order to understand the magnetic cause of the jets, we studied the photospheric magnetic field configuration in their source regions using the observations recorded by the Helioseismic and Magnetic Imager (HMI) onboard SDO. Here we only study the line of sight component of the magnetic field, shown in Figure 3. The active region in which the jets were observed appeared on the east limb on 04 December, 2010 and went over the west limb on 16 December, 2010. The active region is comprised of a main negative polarity surrounded by numerous small positive polarity regions, similar to the moat regions of sunspots during their decay phase. (Brooks et al. 2007). A negative part of the sunspot is detached from the main polarity and increased in size and flux. Then it progressively cancelled with positive polarities. These observations are similar to those reported by Pariat et al. (2004) from Flare Genesis Experiment.
The time evolution of the HMI magnetograms reveals emergence of both positive as well as negative fluxes co-spatial to the location of the jets. The emergence of magnetic flux at the jet location is shown by white arrow in Figure 3 at 04:10:11 UT on 11 December, 2010. The foot-points of all the five jets were located at the western edge of the active region. As an example, the location of one of the jets (J3) is overlaid on magnetic field image at 06:10:11 UT as contour in the bottom left panel of Figure 3.
In order to quantify the magnetic flux at the jet basis, we have computed the flux in a box, shown in the middle right panel of Figure 3. The evolution of the magnetic flux is shown in Figure 4. The plot shows overall trend of flux emergence upto 20:00 UT on 11 December, 2010 including the time interval of the jets. However, a closer look at the flux evolution and the times of jets appearance, we find that the jets ‘J1’, ‘J2’, ‘J3’ and ‘J4’ were launched during the decrease in both positive and negative magnetic fluxes, where as jet ‘J5’, was launched during the enhancement of magnetic flux.
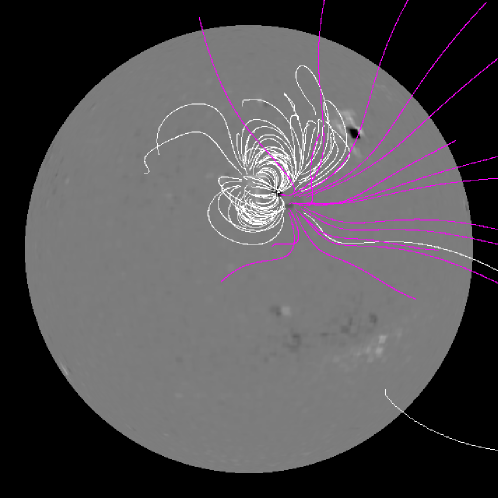
We have also investigated the overall magnetic topology of the active region using the Potential Field Source Surface (PFSS) extrapolation of photospheric magnetic field observed by HMI at 00:04:00 UT using the software provided in SSW. The PFSS extrapolation is presented in figure 5 and reveals the presence of close as well as open field lines in the active region. A close comparison of the EUV observations with the extrapolated field reveals that the jets are ejected in the direction of open field lines.
4 Associated type III radio bursts
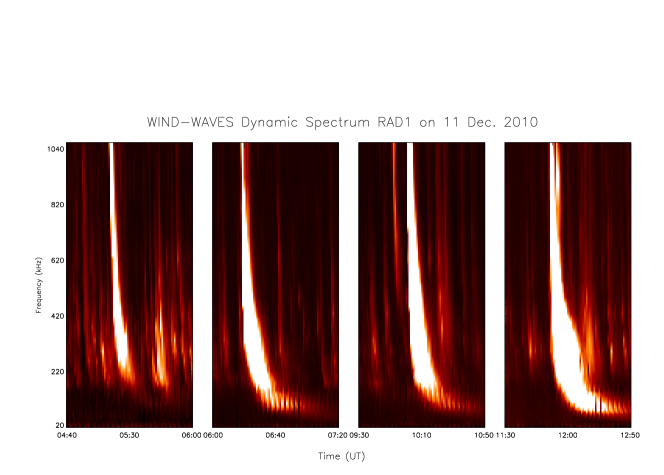
Observations of type III radio bursts represent the escaping non-thermal electrons along the open field lines and provides evidence of magnetic reconnection. We compared our observation with those recorded with WIND/WAVES (Bougeret et al., 1995). The dynamic spectrum from 20 to 1040 kHz as observed by WIND/WAVE using RAD 1 instrument is displayed in Figure 6. The 1st panel corresponds to J1 and J2, while the 2nd, 3rd and 4th panels correspond to J3, J4 and J5. The comparison between the jet start time and detection time of type III burst reveals a strong correlation. We find that all the jets are associated with type III radio burst.
5 Sunspot oscillations
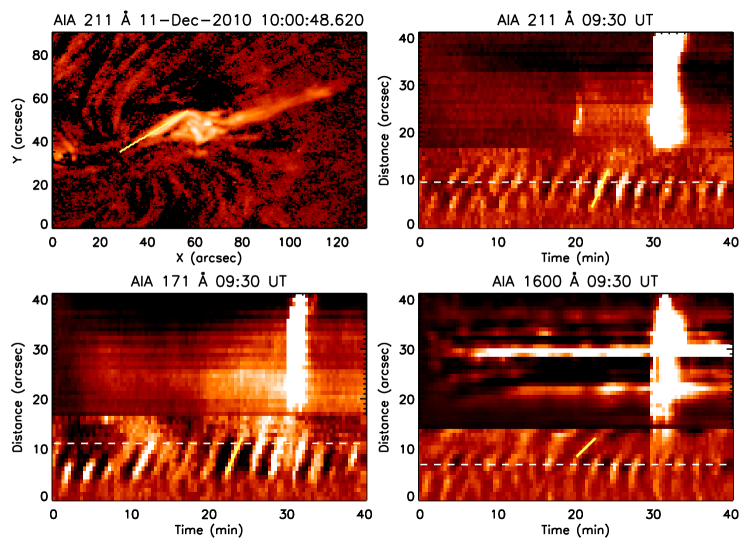
In order to understand the relationship between sunspot waves and jets, we studied sunspot oscillations originating from the interior and propagating towards the location of the jet. We have performed this analysis for the all five jet events. However, we present the results for the jet J4 as this is the strongest among all (see Figure 7).
We drew artificial slit originating from sunspot interior and covering the jet beam and obtained time-distance maps along the slit in AIA 211 Å, 171 Å, and 1600 Å passbands (see Figure 7). Two parts of time-distance maps obtained from artificial slit (a part covering sunspot and another covering jet beam) are processed differently so as to bring out the propagating features unambiguously. The time-distance maps obtained in different passbands reveal the presence of quasi-periodic propagating disturbances originating from sunspot and propagating towards the jet foot-point. The propagation speeds of the waves are 46 km s-1, 44 km s-1 and 18 km s-1 observed in AIA 211 Å 171 Å and 1600 Å respectively as obtained from the slope of bright ridges.
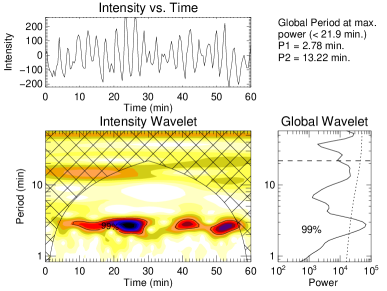
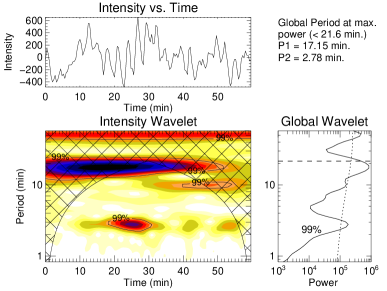
In order to further understand the characteristics of the sunspot oscillations, we have also performed wavelet analysis (Torrence & Compo, 1998) with the time series obtained at the locations marked with dashed lines on the time-distance maps. We have performed the analysis with all the three passbands, but show only 211 Å (left panel) and 171 Å (right panel) passbands. Figure 8 displays the obtained results. The top panels show the variation of intensity with time. Note that a 50 point running average has been subtracted from the original curve to bring out the oscillations more clearly. The bottom left panels are wavelet power spectrum (colour inverted) with 99% confidence levels and bottom right panels are global wavelet power spectrum with 99% global confidence. As expected, the wavelet power spectrum clearly reveals the presence of 3 min oscillations in all the passbands.
Moreover, a very interesting and unique feature is observed in this data set, i.e. an increase in the amplitude of the oscillation in all the passbands right before the jets were triggered. This can be visualised in the wavelet time-series plots where an increase in oscillatory power is observed from 10 minutes onwards (see top left panel in Fig. 8). To understand this phenomena in greater details, we chose small interval of the time series and plotted in Figure 9. A linear fit to obtain the trend in the intensity variation for this small time interval is applied to the intensity variation and over plotted. Relative intensity variations with time were obtained after subtracting the linear trend (fit) from the original intensity for the different AIA passbands, which clearly shows the increase in the amplitude of oscillations prior to the jet event J4. A similar characteristic was observed for all the other jets.

6 Summary and Discussion
In this study, we have investigated multi-wavelength observations of five recurrent homologous jets. These jets occurred in the active region NOAA AR 11133. The main results of our study are summarized as follows:
-
•
The observed jets occurred in the western periphery of the active region similar to the observations by Shimojo et al. (1996) and are homologous. All the five jets are observed in all the channels of AIA suggesting multi-temperature structure of the jets. The time distance analysis provided the speed of the jets which ranges between 86 and 267 km s-1. These speeds are similar to those reported earlier.
-
•
The magnetic field data show continuous evolution with emerging and submerging flux regions around the sunspot. Both positive and negative flux regions emerged at the location of jets just before the appearance of the first jet. There are various scattered small scale field regions (both positive and negative) observed around the strong negative polarity sunspot. On a close comparison of jet timings with evolution of magnetic flux, we found that the jets ‘J1’, ‘J2’, ‘J3’ and ‘J4’ were associated with flux cancellation, while the jet ‘J5’ was observed during the period of emerging magnetic flux. Additionally, the direction of ejection of jets are closely related to the open field lines as was revealed by the PFSS extrapolation of the photospheric magnetic field.
-
•
All the jets were associated with type III radio bursts. It is believed that the non-thermal particles are accelerated at reconnection site in the current sheet, which forms between closed and open magnetic field lines (Shibata et al., 1992; Innes et al., 2011) and excite the plasma oscillations (Langmuir waves). These plasma oscillations are further converted to escaping electromagnetic radiation by non-linear wave-wave interactions and produce its signatures in the radio dynamic spectrum as a ’Type III radio burst’. Therefore, the strong association between jets and type III radio bursts provides further evidence in support of magnetic reconnection models in the production of jets.
-
•
The analysis of the sunspot waves revealed a 3 minute oscillatory pattern. The analysis further revealed that an increase in the amplitude of the oscillations prior to the triggering of the jet. This was observed for all the events and all the three AIA channels studied here. The oscillatory amplitudes decreased after the launch of the jets.
The emergence and submergence of the magnetic flux regions in close temporal and spatial association with the jets along with the observations of type III burst provides strong evidence supporting the reconnection model for the triggering of the jets. The observations of the increasing and decreasing oscillatory power of the sunspot waves before and after the triggering of the jets respectively, provide evidence of wave induced magnetic reconnection (e.g., Chen & Priest, 2006; Heggland et al., 2009). Increase of oscillatory power is related to increase of wave amplitude. The increasing and decreasing of wave amplitude can be interpreted as expansion and contraction of flux tube. The increase in the amplitude will therefore bring the neighbouring magnetic field lines closer, which may induce reconnection leading to the formation of jets. Similar wave induced reconnection phenomena have also been speculated by Ning et al. (2004) while studying the quiet Sun transition region explosive events. Sych et al. (2009) also found a gradual increase in the amplitude of the 3-min oscillatory train in the sunspot before the triggering of flares. It was proposed that flaring energy release was triggered by 3-min slow magneto-acoustic wave leakage from the sunspots, similar to our observations of jet triggering. Thus, study of propagation of sunspot waves provide an important clue in our understanding of triggering of jet events at the boundary of active regions.
Acknowledgments
We thank the anonymous referee for valuable and helpful comments and suggestions. The authors thanks the open data policy of SDO, and WIND/WAVES teams. RC acknowledges support from ISRO/RESPOND project no. ISRO/RES/2/379/12-13. GRG acknowledges Department of Science and Technology (DST), India for INSPIRE Faculty Fellowship. SM and DT acknowledge support from DST under the Fast Track Scheme (SERB/F/3369/2012/2013).
References
- Archontis & Hood (2012) Archontis V., Hood A. W., 2012, A A, 537, A62
- Bougeret et al. (1995) Bougeret J.-L., Kaiser M. L., Kellogg P. J., Manning R., Goetz K., Monson S. J., Monge N., Friel L., Meetre C. A., Perche C., Sitruk L., Hoang S., 1995, Space Sci. Rev., 71, 231
- Brooks et al. (2007) Brooks D. H., Kurokawa H., Berger T. E., 2007, ApJ, 656, 1197
- Canfield et al. (1996) Canfield R. C., Reardon K. P., Leka K. D., Shibata K., Yokoyama T., Shimojo M., 1996, ApJ, 464, 1016
- Chae et al. (1999) Chae J., Qiu J., Wang H., Goode P. R., 1999, ApJL, 513, L75
- Chandra et al. (2006) Chandra R., Jain R., Uddin W., Yoshimura K., Kosugi T., Sakao T., Joshi A., Deshpande M. R., 2006, SoPh, 239, 239
- Chen & Priest (2006) Chen P. F., Priest E. R., 2006, SoPh, 238, 313
- Chifor et al. (2008a) Chifor C., Isobe H., Mason H. E., Hannah I. G., Young P. R., Del Zanna G., Krucker S., Ichimoto K., Katsukawa Y., Yokoyama T., 2008a, A A, 491, 279
- Chifor et al. (2008) Chifor C., Young P. R., Isobe H., Mason H. E., Tripathi D., Hara H., Yokoyama T., 2008b, A A, 481, L57
- Cirtain et al. (2007) Cirtain J. W., Golub L., Lundquist L., van Ballegooijen A., Savcheva A., Shimojo M., DeLuca E., Tsuneta S., Sakao T., Reeves K., Weber M., Kano R., Narukage N., Shibasaki K., 2007, Science, 318, 1580
- Guo et al. (2013) Guo Y., Démoulin P., Schmieder B., Ding M. D., Vargas Domínguez S., Liu Y., 2013, A A, 555, A19
- Heggland et al. (2009) Heggland L., De Pontieu B., Hansteen V. H., 2009, ApJ, 702, 1
- Heyvaerts et al. (1977) Heyvaerts J., Priest E. R., Rust D. M., 1977, ApJ, 216, 123
- Innes et al. (2011) Innes D. E., Cameron R. H., Solanki S. K., 2011, A A, 531, L13
- Isobe & Tripathi (2006) Isobe H., Tripathi D., 2006, A A, 449, L17
- Isobe et al. (2007) Isobe H., Tripathi D., Archontis V., 2007, ApJL, 657, L53
- Lemen et al. (2012) Lemen J. R., Title A. M., Akin D. J., et al., 2012, SoPh, 275, 17
- Liu & Kurokawa (2004) Liu Y., Kurokawa H., 2004, ApJ, 610, 1136
- Mandrini et al. (1996) Mandrini C. H., Démoulin P., van Driel-Gesztelyi L., Schmieder B., Cauzzi G., Hofmann A., 1996, SoPh, 168, 115
- Moreno-Insertis et al. (2008) Moreno-Insertis F., Galsgaard K., Ugarte-Urra I., 2008, ApJ, 673, L211
- Mulay et al. (2014) Mulay S., Subramanian S., Tripathi D., Isobe H., Glesener L., 2014, ApJ, 794, 78
- Ning et al. (2004) Ning Z., Innes D. E., Solanki S. K., 2004, A A, 419, 1141
- Pariat et al. (2004) Pariat E., Schmieder B., Georgoulis M. K., Rust D. M., Bernasconi P. N. 2004, ApJ, 614, 1099
- Pariat et al. (2009) Pariat E., Antiochos S. K., DeVore C. R., 2009, ApJ, 691, 61
- Pariat et al. (2010) Pariat E., Antiochos S. K., DeVore C. R., 2010, ApJ, 714, 1762
- Patsourakos et al. (2008) Patsourakos S., Pariat E., Vourlidas A., Antiochos S. K., Wuelser J. P., 2008, ApJL, 680, L73
- Pesnell et al. (2012) Pesnell W. D., Thompson B. J., Chamberlin P. C., 2012, SoPh, 275, 3
- Schmieder et al. (1997) Schmieder B., Aulanier G., Démoulin P., van Driel-Gesztelyi L., Roudier T., Nitta N., Cauzzi G., 1997, A A, 325, 1213
- Schmieder et al. (2013) Schmieder B., Guo Y., Moreno-Insertis F., Aulanier G., Yelles Chaouche L., Nishizuka N., Harra L. K., Thalmann J. K., Vargas Dominguez S., Liu Y., 2013, A A, 559, A1
- Schmieder et al. (1995) Schmieder B., Shibata K., van Driel-Gesztelyi L., Freeland S., 1995, SoPh, 156, 245
- Shibata et al. (1992) Shibata K., Nozawa S., Matsumoto R., 1992, PASJ, 44, 265
- Shimojo et al. (1996) Shimojo M., Hashimoto S., Shibata K., Hirayama T., Hudson H. S., Acton L. W., 1996, PASJ, 48, 123
- Shimojo & Shibata (2000) Shimojo M., Shibata K., 2000, ApJ, 542, 1100
- Sych et al. (2009) Sych R., Nakariakov V. M., Karlicky M., Anfinogentov S., 2009, A A, 505, 791
- Török et al. (2009) Török T., Aulanier G., Schmieder B., Reeves K. K., Golub L., 2009, ApJ, 704, 485
- Torrence & Compo (1998) Torrence C., Compo G. P., 1998, Bulletin of the American Meteorological Society, 79, 61
- Tsuneta & Acton (1991) Tsuneta S., Acton L., 1991, in Uchida Y., Canfield R. C., Watanabe T., Hiei E., eds, Flare Physics in Solar Activity Maximum 22 Vol. 387 of Lecture Notes in Physics, Berlin Springer Verlag, Soft X-ray Telescope (SXT) (Extended Abstract). p. 18
- Uddin et al. (2004) Uddin W., Jain R., Yoshimura K., Chandra R., Sakao T., Kosugi T., Joshi A., Despande M. R., 2004, SoPh, 225, 325
- Uddin et al. (2012) Uddin W., Schmieder B., Chandra R., Srivastava A. K., Kumar P., Bisht S., 2012, ApJ, 752, 70
- Yokoyama & Shibata (1995) Yokoyama T., Shibata K., 1995, Nature, 375, 42