Resolving the Bright HCN(1-0) Emission toward the Seyfert 2
Nucleus of M51:
Shock Enhancement by Radio Jets and Weak Masing by Infrared Pumping?
Abstract
We present high angular resolution observations of the HCN(1 – 0) emission (at or pc), together with CO J = 1 – 0, 2 – 1, and 3 – 2 observations, toward the Seyfert 2 nucleus of M51 (NGC 5194). The overall HCN(1 – 0) distribution and kinematics are very similar to that of the CO lines, which have been indicated as the jet-entrained molecular gas in our past observations. In addition, high HCN(1 – 0)/CO(1 – 0) brightness temperature ratio of about unity is observed along the jets, similar to that observed at the shocked molecular gas in our Galaxy. These results strongly indicate that both diffuse and dense gases are entrained by the jets and outflowing from the AGN. The channel map of HCN(1 – 0) at the systemic velocity shows a strong emission right at the nucleus, where no obvious emission has been detected in the CO lines. The HCN(1 – 0)/CO(1 – 0) brightness temperature ratio at this region reaches , a value that cannot be explained considering standard physical/chemical conditions. Based on our calculations, we suggest infrared pumping and possibly weak HCN masing, but still requiring an enhanced HCN abundance for the cause of this high ratio. This suggests the presence of a compact dense obscuring molecular gas in front of the nucleus of M51, which remains unresolved at our ( pc) resolution, and consistent with the Seyfert 2 classification picture.
Subject headings:
galaxies: individual (M51, NGC 5194), galaxies: ISM, galaxies: jets, galaxies: nuclei, galaxies: Seyfert, ISM: jets and outflows1. Introduction
Active Galactic Nuclei (AGNs) are generally believed to consist of supermassive black holes (SMBHs) surrounded by dense material (i.e., molecular gas and dust) in a disk or a torus configuration (e.g., Antonucci, 1993). At spatial scales of pc, a number of observations toward nearby AGN host galaxies in molecular gas have uncovered strong concentrations of dense molecular gas at the location of AGNs (e.g., Kohno et al., 2001, 2008a), and these nuclear components often show smooth velocity gradients, suggestive of rotating disks or tori around AGNs (e.g., Jackson et al., 1993; Kohno et al., 1996; Hsieh et al., 2008; Hicks et al., 2009; Sani et al., 2012).
At finer spatial scales of pc, however, molecular gas observations toward some of the previously observed AGNs revealed very different images from the past results observed at larger spatial scales. The nuclear molecular gas shows very disturbed features, such as jet-entrained or outflowing motions from AGNs (Matsushita et al., 2007; Krips et al., 2011; Combes et al., 2013) or infalling motions toward AGNs (Davies et al., 2009; Müller Sánchez et al., 2009), with little evidence of obscuring rotating disks or tori at this spatial scale. Where is the obscuring material? In this paper, we target one of the nearest Seyfert galaxies, M51 (NGC 5194), to tackle these questions.
M51 hosts a Seyfert 2 nucleus (Ho et al., 1997) with a pair of radio jets (Ford et al., 1985; Crane & van der Hulst, 1992). It is located at a distance of 7.1 Mpc (Takáts & Vinkó, 2006), which is about one half that of NGC 1068 (14.4 Mpc; Tully, 1988), and therefore a very suitable target to observe nuclear molecular gas that requires very high linear resolution. The molecular gas around the nucleus of M51 is dense ( cm-3; Kohno et al., 1996) and warm ( K; Matsushita et al., 1998, 2004). The molecular gas distribution and kinematics within ( pc) from the AGN are complex, showing no clear evidence for a disk or torus, but instead two separated features located at the eastern and western sides of the nucleus (Matsushita et al., 2007). The western clump shows a velocity gradient along the radio jets, and its value matches well with that of the ionized gas along the jets (Bradley et al., 2004), strongly indicating that the western clump is entrained by the jets and outflowing from the nucleus (Matsushita et al., 2007).
These previous resolution studies, however, have only been done with CO lines, which might trace different gas components, including diffuse molecular gas, and may confuse our view of the gas distribution and kinematics close to the nucleus. On the other hand, previous resolution HCN(1 – 0) image (Kohno et al., 1996, 2008b) is not high resolution enough to resolve the detailed structures that have been resolved with the CO observations. In addition, Aalto et al. (2012) reported an HCN(1 – 0) emission enhancement in the molecular outflows of Mrk 231 at a scale of about 1 kpc, suggesting that the HCN emission can be a good tool for tracing outflows. Observations toward the nucleus of M51 using the HCN(1 – 0) line at or better resolution are therefore essential to understand the physical and chemical interactions between molecular gas and AGN jets. Here, we present resolution HCN(1 – 0), HCO+(1 – 0), and HNC(1 – 0) data toward the nuclear region of M51, together with the resolution CO (1 – 0), (2 – 1), and (3 – 2) data, and compare the distributions and kinematics of these lines. We then discuss the possible emission mechanism of the HCN line from the nuclear region of M51.
2. Observation and Data Reduction
2.1. PdBI Observations
We observed the HCN(1 – 0), HCO+(1 – 0), and HNC(1 – 0) lines simultaneously toward the nuclear region of M51 using the IRAM Plateau de Bure Interferometer (PdBI). The array was in the A configuration, and the observation was carried out on February 1st, 2009. The system temperatures in SSB were in the range 80 – 400 K, depending mostly on the elevation angle (i.e., atmospheric absorption). Three 160 MHz ( km s-1) bandwidth correlators were configured to cover each line. Five 320 MHz units were configured primarily to cover nearby line-free frequencies for continuum observations and calibrations. MWC 349 (catalog ) was observed for the flux calibration, the strong quasar 3C273 (catalog ) was used for the bandpass calibration, and the quasars J1310+323 (catalog ) and J1419+543 (catalog ) were used for the phase and amplitude calibrations. The uncertainty in the absolute flux scale is estimated to be around 5%.
The data were calibrated using GILDAS, and were imaged using AIPS. We did not detect any significant emission for the HCO+(1 – 0) and HNC(1 – 0) lines with the upper limit of 2.0 mJy beam-1 in each 20 km s-1 channel for both lines within the velocity range of 350 – 550 km s-1. We also did not detect any continuum emission at 90 GHz with the upper limit of 0.87 mJy beam-1.
2.2. SMA Observations
The CO(3 – 2) line was observed with the Submillimeter Array (SMA; Ho et al., 2004)111The Submillimeter Array is a joint project between the Smithsonian Astrophysical Observatory and the Academia Sinica Institute of Astronomy and Astrophysics, and is funded by the Smithsonian Institution and the Academia Sinica.. The observation was performed on April 18, 2005, and six out of eight 6 m antennas were used in the extended configuration. The correlator was configured to a 2 GHz bandwidth with a 0.8125 MHz channel resolution, and the line was located at the upper side band (USB). Titan was observed as a flux calibrator, and Uranus, Ganymede, 3C279, and 3C345 were used as bandpass calibrators. J1153+495 and 3C345 were observed every minutes for the phase and amplitude calibrations. The uncertainty in the absolute flux scale is estimated to be around 15%.

The data calibrations were done using the software package MIR, adapted for SMA222http://www.cfa.harvard.edu/$∼$cqi/mircook.html. This extended configuration dataset was combined with the previous compact configuration data set (Matsushita et al., 2004) in the plane. The combined data were CLEANed and the images were produced using AIPS.
2.3. Matching Ranges
In this paper, we compare the newly obtained HCN(1 – 0) and CO(3 – 2) data with the previously obtained PdBI A configuration CO(1 – 0) data (Matsushita et al., 2007) in various ways, including line ratios. For this purpose, we need to match the shortest lengths and the beam sizes of all the datasets, so that they all sample the same structures (i.e., the same spatial frequency components obtained by interferometers). Note that matching the beam size has the same effect as matching the longest lengths. The shortest length common to all datasets is imposed by the CO(1 – 0) data, for which the shortest length is 37 k (i.e., we can image the structure smaller than ). We then convolved all the images to the largest beam size among our data of with the position angle (P.A.) of . We note here that this range matching does not significantly change the images from the unlimited ones. We did not match the range for the CO(2 – 1) data, since there is a small overlap in the range with other data (i.e., CO J = 2 – 1 data has the shortest length twice longer than that of J = 1 – 0 data, since those data are taken simultaneously with PdBI). As we will show, the CO(2 – 1) line traces the same features, and is shown for reference, although it is not included in the line ratio calculations.
3. Results
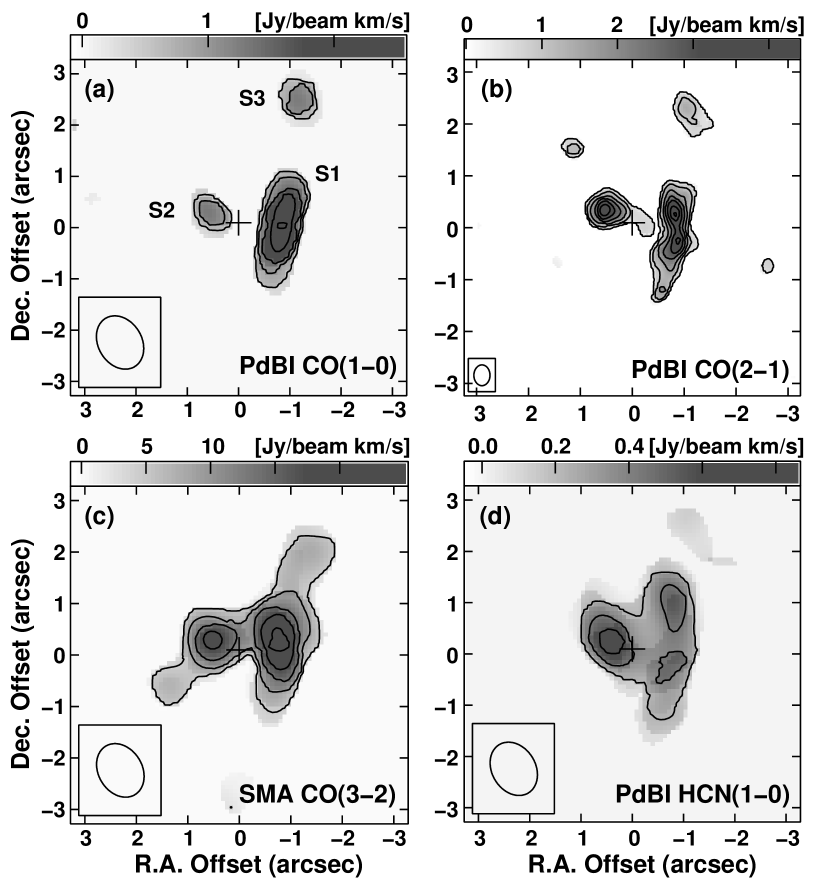
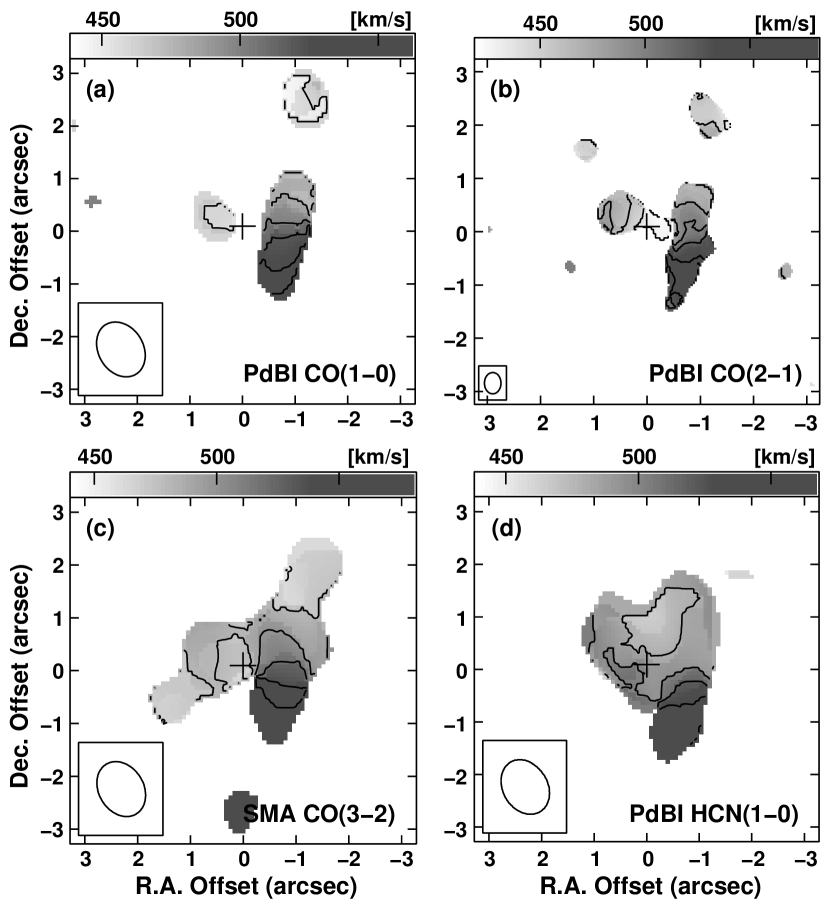
In Fig. 1, we show the central ( pc) region integrated intensity maps of the CO(1 – 0), CO(2 – 1), CO(3 – 2), and HCN(1 – 0) lines. All the data except CO(2 – 1) are and beam matched images as mentioned above. The spatial resolution in CO(2 – 1) is more than a factor of two higher than other images (Matsushita et al., 2007), and is shown here for reference. All the images appear to have similar overall molecular gas distributions and kinematics: There are two clumps located at the western and eastern sides of the nucleus (hereafter clumps S1 and S2, respectively; see Fig. 1a), whereby the western clumps S1 are elongated along the north-south direction. The intensity-weighted velocity maps for all the lines are shown in Fig. 2. In all the maps, the eastern clump S2 shows increasingly higher blueshifted velocities toward the nucleus, and the western clump S1 shows clear velocity gradient in the north-south direction, as was previously reported by Matsushita et al. (2007). The similarity in the kinematics for all the lines suggests that the overall molecular gas distribution and kinematics at the central does not depend on the molecular species (both CO and HCN) or properties (both diffuse and dense gas, and from lower-J to higher-J lines). As mentioned in Sect. 1, the S1 clump is the jet-entrained molecular gas, so that the similarity of the distribution and kinematics between the CO and HCN data strongly indicates that the both diffuse and dense molecular gas is entrained by the jets and outflowing from the AGN.

With a detailed inspection of the channel maps, however, a distinct difference between the CO and HCN distributions can be seen in a channel map at the systemic velocity ( km s-1 Shetty et al., 2007). Fig. 3 displays three channel maps centered at the velocity of 460, 480, and 500 km s-1, each with a width of km s-1. In the channel maps at the velocity of 460 and 500 km s-1 (i.e., adjacent to the channel at the systemic velocity), all the lines show the emission peaks at either or both eastern and western sides of the nucleus (some emissions elongate toward the nucleus, but do not peak there). On the other hand, in the channel maps at the velocity of 480 km s-1, which includes the systemic velocity of km s-1, the HCN(1 – 0) line clearly exhibits a peak at the nucleus, where CO lines show no peak if any detectable emission at the nucleus. To further confirm this systemic velocity HCN emission peak, we plot the spectra toward the nucleus of M51 for all four lines in Fig. 4. As can be seen, all the CO lines exhibit at best emission at the level, but the HCN(1 – 0) line shows a peak only at the systemic velocity channel of 480 km s-1. This therefore indicates that the central HCN(1 – 0) emission is highly related to the molecular gas around the systemic velocity.
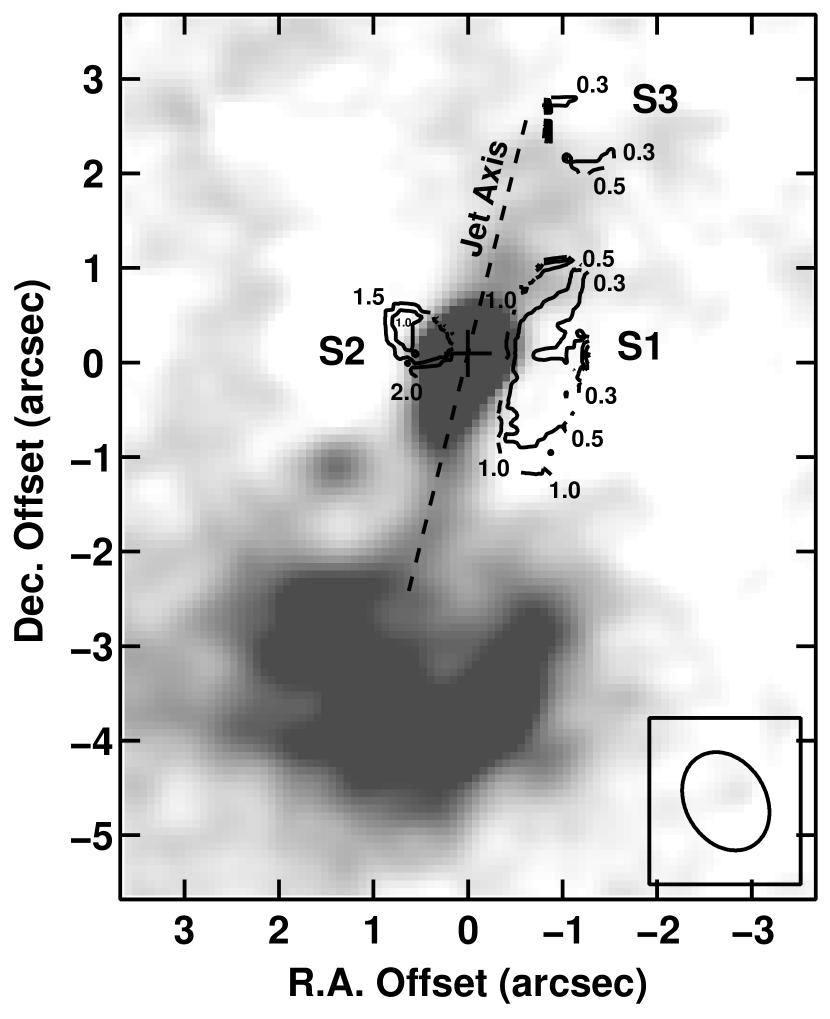
After converting the integrated intensity maps of the CO(1 – 0) and HCN(1 – 0) lines in Fig. 1 into brightness temperature maps, we made the HCN(1 – 0)/CO(1 – 0) brightness temperature ratio map in Fig. 5 overlaid on the VLA 6 cm continuum map (Crane & van der Hulst, 1992). All the molecular gas clumps show the HCN/CO ratios of more than 0.1, and the clumps closer in projection either to the AGN or to the jet tend to have higher ratios. Indeed, the highest ratio of more than 2.0 is located at the AGN (western) side of the clump S2. More interestingly, all the eastern side of the clump S1 has higher ratio of than the western side of , and this side is where the radio jets are running through, which can be clearly seen in Fig. 5.
The average ratios of the clumps S1, S2, and S3 are calculated as 0.6, 1.5, and 0.3, respectively. On the other hand, since the CO(1 – 0) emission totally lacks at the nucleus (see Fig. 1a), the HCN/CO ratio at the nucleus cannot be calculated in the ratio map. But since the HCN(1 – 0) emission does exist at the nucleus with the integrated intensity of 0.422 Jy beam-1 km s-1, the lower limit of the HCN/CO brightness temperature ratio at the nucleus can be calculated as using the upper limit of CO of 0.744 Jy beam-1 km s-1. This is also true in the channel map at the velocity of 480 km s-1; in Fig. 3, no clear emission in CO(1 – 0) toward the nucleus with noise level of 0.45 K, while HCN(1 – 0) is detected with 1.5 K ().
The radial tendency of the HCN/CO ratio is more clearly seen in the radial ratio plot. Fig. 6(a) plots the radial integrated intensity distributions of HCN(1 – 0) and CO(1 – 0) in unit of K km s-1. It is obvious that the HCN(1 – 0) emission is centrally concentrated, while the CO(1 – 0) emission exhibits deficiency at the nucleus. From these two radial distributions, we made the radial HCN(1 – 0)/CO(1 – 0) integrated intensity ratio plot in Fig. 6(b). This figure clearly displays that the HCN/CO ratio is higher at the nucleus and decreases monotonically as the distance from the nucleus increases out to .

As mentioned in Sect. 2.1, we did not detect the HCO+(1 – 0) and HNC(1 – 0) lines and therefore the maps for these lines are not presented in this paper. The brightness temperature ratios for both HCN(1 – 0)/HCO+(1 – 0) and HCN(1 – 0)/HNC(1 – 0) are therefore using upper limits for these non-detected lines.
4. Discussion
4.1. High HCN/CO Ratios at the Nucleus and Outflowing Gas
Our high spatial resolution molecular gas images toward the Seyfert 2 nucleus of M51 clearly exhibit higher HCN(1 – 0)/CO(1 – 0) ratios in the molecular gas clumps located close to the AGN than those in other galaxies; the jet-entrained molecular gas clump (clump S1; projected distance of pc from the nucleus) has an averaged HCN/CO ratio of 0.6, and the nearest clump from the AGN (clump S2; projected distance pc) a ratio of 1.5. The clump S3, which located farthest from the AGN, has a ratio of 0.3.
In normal and starburst galaxies, the HCN(1 – 0)/CO(1 – 0) ratios are (e.g., Solomon et al., 1992; Helfer & Blitz, 1993; Aalto et al., 1995; Sorai et al., 2002; Gao & Solomon, 2004; Kohno et al., 2008a; Matsushita et al., 2010). The ratios in our Galaxy and M31 are also low, around 0.01 – 0.03 for Giant Molecular Clouds (GMCs) in the galactic disks (Helfer & Blitz, 1997; Brouillet et al., 2005), and up to at the Galactic center (Jackson et al., 1996). The ratios can be up to for the case of molecular gas located around Seyfert nuclei (e.g., Kohno et al., 2008a; Krips et al., 2007, 2011). Based on these values, the averaged HCN/CO ratio of the clump S1 is similar to those of other Seyfert galaxies, and that of the clump S3 is at the high end of normal or starburst galaxies. The clump S2 is exceptional; the HCN intensity is brighter than that of CO, and this has never been observed in other galaxies in the past.
4.2. Shocked Molecular Gas Outflow along the Radio Jets
As shown in Sect. 3 and in Fig. 5, the S1 clump show a high HCN/CO ratio of around unity only at the side where the radio jets overlap. In addition, this clump is known to be an outflow that is entrained by the radio jets (Matsushita et al., 2007). Such a high ratio has been observed at shocked regions of molecular outflows from young stellar objects in our Galaxy.
Umemoto et al. (1992) observed a highly collimated outflow in the dark cloud L1157 with the 12CO(1 – 0), 13CO(1 – 0), and HCN(1 – 0) lines. In their 12CO spectrum, two (narrow and broad) components can be seen, which are tracing quiescent and outflowing gas, respectively. In the 13CO spectrum, only a narrow component has been detected, but on the contrary, only a broad component has been detected in the HCN spectrum. Using their data, we derive the line ratios with assuming that the HCN emission is only from the outflow component and the 13CO emission from quiescent component. For the 12CO line, we fit a Gaussian to each component to derive the integrated intensity. We integrate all the hyperfine components of the HCN line, since our M51 data cannot distinguish these lines. From these data, we calculated the HCN/12CO and HCN/13CO ratios for the outflowing (shocked) gas as 0.9 and (using upper limit for the 13CO data), respectively. Interferometric HCN and 12CO line observations of the Orion-KL high velocity outflow (Wright et al., 1996) also show high HCN/12CO ratios ranging between . The ratios in the Orion-KL outflow is lower than that in the L1157 outflow, possibly due to more complex nature (and therefore larger contamination) in the massive star forming regions than in the low mass star forming regions.
The ratio and the condition of the clump S1, especially the side close to the radio jets, is very similar to that of the outflowing (shocked) molecular gas in L1157. This strongly supports the idea that the high HCN/CO ratio along the radio jets in M51 is caused by the strong interaction (i.e., shock) between the jets and the outflowing molecular gas. Furthermore, it is worth mentioning that the averaged HCN/CO ratio of 0.6 is very similar to the dense molecular gas outflow observed toward Mrk 231 of (Aalto et al., 2012). Since their spatial resolution of kpc is lower than ours, it is possible that the actual HCN/CO ratio in Mrk 231 is higher.
4.3. Infrared Pumping with Weak Maser at Circumnuclear Molecular Gas?
The clump S2 shows extremely high HCN/CO ratio of 1.5 on average, and more than 2 at the nucleus as shown in Fig. 6. As mentioned above, such high ratios have not been observed in extragalactic molecular gas, but observed in molecular gas around Asymptotic Giant Branch (AGB) stars.
We observed the high mass-loss carbon AGB stars, IRC, with 12CO(1 – 0), 13CO(1 – 0), and HCN(1 – 0) for the intensity calibrations of our past observations (see Matsushita et al., 2010, for details). The resultant 12CO/13CO, HCN/12CO, and HCN/13CO integrated intensity ratios are , 1.3, and 15, respectively. Note again that we integrate all the HCN hyperfine lines for this calculation. The high HCN/12CO and HCN/13CO ratios are due to the infrared (IR) pumping (Dinh-V-Trung & Nguyen-Q-Rieu, 2000).
This result suggests that the extremely high HCN/CO ratio can be due to the IR pumping. In the following subsections, we discuss what is the possible excitation mechanism for the clump S2.
4.3.1 Excitation Mechanisms of the HCN Emission: I. LTE/non-LTE Conditions
We start by assuming that both molecules are excited solely by collisions with H2 molecules, which is typically the case in Galactic GMCs. The opacity ratio under the local thermal equilibrium (LTE) can be expressed as
| (1) | |||||
where is the filling factor, is the dipole moment, is the rotational constant, is the Planck constant, is the rotational transition frequency, and is the Boltzmann constant. The HCN and CO molecular abundances relative to H2 are expressed as [HCN] and [CO], respectively. Adopting , which is already an extreme case compared to the Galactic GMCs where , , , GHz, GHz, GHz, GHz, [HCN] (Irvine et al., 1987), and [CO] , the opacity ratio can be calculated as under a large range of molecular gas temperature condition ( K). The brightness temperature ratio can therefore be expressed as
| (2) | |||||
and this ratio ranges between 0.18 (optically thin limit) and 1 (optically thick limit), which cannot realize HCN(1 – 0)/CO(1 – 0) .
If is times larger than , then it is possible to obtain the observed ratio, but it is physically unlikely; the critical density of the HCN molecule is more than an order of magnitude larger than that of the CO molecule, so that wherever the HCN molecules can emit, the CO molecules can also emit, and cannot be larger than . A simple way to reproduce the observed HCN/CO ratio would be if the [HCN]/[CO] abundance ratio is increased by a factor of . In either case, the CO emission should be optically thin. This is also true even for the non-LTE radiation transfer modeling using the large-velocity-gradient (LVG) approximation; without changing the HCN abundance, the HCN/CO ratio can be at most around unity under very limited temperature or density range (see Sect. 4.3.2 below and Fig. 7c).
4.3.2 Excitation Mechanisms of the HCN Emission: II. Infrared Pumping
In addition to the collisional excitation, here we also consider the possibility of IR radiative pumping (Morris, 1975; Carrol & Goldsmith, 1981; Deguchi & Uyemura, 1984), since this mechanism can enhance the HCN intensity as mentioned for the case of IRC in Sect. 4.3. This mechanism is to pump the population of a rotational level to higher levels via vibrational transitions; in a strong IR radiation field, some molecules that have vibrational transitions at IR wavelength will be pumped to higher vibrational levels and radiate back to lower levels, but to higher rotational levels than before. This process increases the population at higher rotational levels and therefore makes the rotational transition emission stronger than general molecular clouds (no strong IR field), which only have collisional pumping. This is particularly relevant when a luminous source is present (e.g., AGN) in the background, such that optical/UV radiation is absorbed by dust and reradiated in IR. The vibrational transition of HCN molecule is at m, where the radiation from warm dust irradiated by AGNs is strong, and therefore this is one of the possible mechanisms to explain the high HCN/CO ratio toward AGNs. The absorption line of the HCN m transition can be seen in several IR luminous galaxies (Lahuis et al., 2007; Farrah et al., 2007). Recent interferometric observations toward those galaxies have indeed displayed vibrationally excited HCN lines toward their IR luminous nuclei (Salter et al., 2008; Sakamoto et al., 2010; Imanishi et al., 2013).
To check whether IR pumping of HCN can occur near the nucleus, we need to estimate the radiative excitation in this region. The condition for the IR pumping to be effective is when the probability of the HCN vibrational transition absorption at m, (s-1), is larger than that of the HCN J = 1 – 0 rotational transition spontaneous emission, (s-1), namely,
| (3) |
where is the average intensity of the radiation field at m. This equation can be re-written as
| (4) |
where is the speed of light, is the Planck constant, and is the frequency. We use s-1 (Harris et al., 2006) from the GEISA spectroscopic database (Jacquinet-Husson et al., 2011) and s-1 (Dumouchel et al., 2010) from RADEX (Van der Tak et al., 2007) for this calculation.
To estimate the radiation field at m around the nucleus of M51, we use the recent high resolution images taken with the photometric bands S11 (m) and L15 (m) of the AKARI Infrared Camera (Egusa et al., 2013). Both images show a point-like source at the nucleus of M51 at a spatial resolution of , and well separated from the surrounding spiral arms (i.e., no contamination from the emission of the spiral arms; see Fig. 2 of Egusa et al., 2013). We therefore assume that the point-like emission at the nucleus of M51 in these images originates from the compact Seyfert 2 nucleus. The flux densities of the nuclear emission at S11 and L15 are Jy and Jy, respectively. With linear interpolation between S11 and L15 flux densities, we estimate a m flux density, , of Jy.
can be calculated using as
| (5) |
where is the solid angle of the source at m. Since the compact infrared nuclear source of M51 has not been resolved so far, we adopt the size of the infrared source as a few () pc, which is the same as that of the thick dust disk observed toward the nucleus of the prototypical Seyfert 2 galaxy NGC 1068 (Jaffe et al., 2004). Substituting the above values into eqs. (5) and (4), the left-hand side of the eq. (4) is calculated as s-1, which is larger than the right-hand side of the equation of s-1. This indicates that IR pumping can occur in the molecular gas surrounding the Seyfert 2 nucleus of M51.
We then included the infrared pumping effect in our LVG calculations. We use the above calculated m intensity for the radiation coming from the background infrared source. Here, we adopt the infrared source size of 3 pc. We also assume that the molecular gas has a temperature of 100 K. Note that in general higher molecular gas temperature induces more collision, and therefore decreases the effect of infrared pumping. But under the high temperature condition, the effect of infrared pumping to lower transitions is insensitive to changes in the molecular gas temperature, since most of population is at higher transitions; a factor of a few change in temperature gives almost no difference in the calculation results.
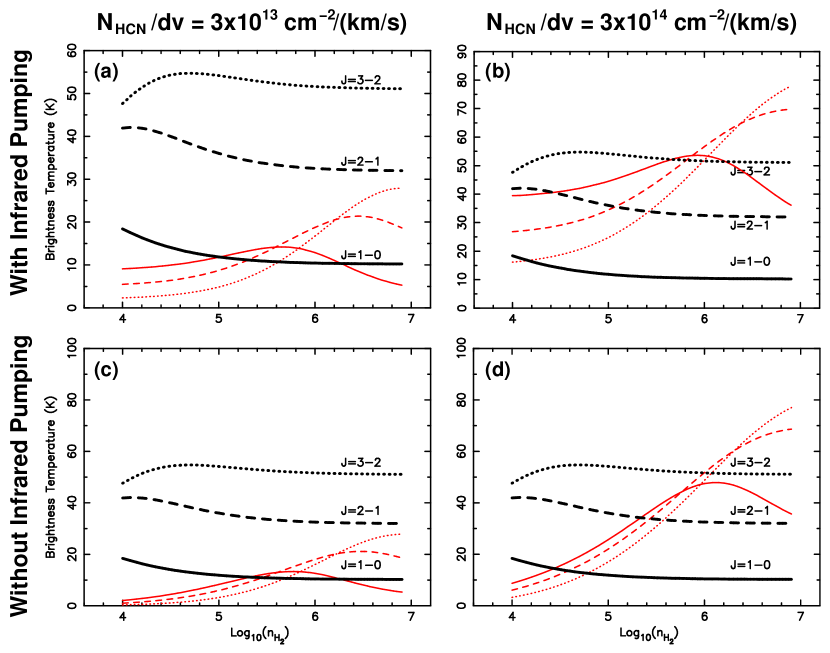
In the first calculation, we use the H2 column density per velocity of cm-2, which corresponds to the H2 column density toward the nucleus of M51 ( cm-2; Matsushita et al., 2007) divided by the typical velocity width of the extragalactic molecular clouds of km s-1 (Combes & Becquaert, 1997). We also assume that the column densities per velocity for CO and HCN, and , are cm-2 (km s and cm-2 (km s, respectively. These column densities for CO and HCN correspond to the normal abundance ratio mentioned in Sect. 4.3.1 relative to the H2 column density mentioned above. The results for the brightness temperatures of CO (black curves) and HCN (red curves) lines are shown in Fig. 7(a), with the comparison of the results without infrared pumping (Fig. 7c). As can be seen, using the normal abundance of HCN and CO, the HCN(1 – 0)/CO(1 – 0) ratio of at most about unity can be realized under very limited condition of cm-3, but cannot realize HCN(1 – 0)/CO(1 – 0) both with and without infrared pumping.
We then repeated the calculations by increasing the HCN abundance by an order of magnitude, namely changing to cm-2 (km s. The calculation results are displayed in Fig. 7(b), with the comparison of the results without infrared pumping (Fig. 7d). In both cases, high HCN(1 – 0)/CO(1 – 0) ratio of can be obtained at dense condition ( cm-3). On the other hand, when including infrared pumping, HCN(1 – 0)/CO(1 – 0) can also be obtained even at low density condition, namely it is possible at large density range.
Note that with the H2 column density per velocity we used, the CO brightness temperatures, especially J = 1 – 0, are much lower than the assumed molecular gas temperature of 100 K, since CO is already thermalized and the population is at higher-J transitions, which makes the lower-J lines optically thin and therefore low brightness temperatures. This is consistent with the non-detection of the CO lines toward the nucleus under the current noise level of K at upper limit (see Fig. 3) and the detection of the HCN(1 – 0) line.
In summary, infrared pumping does not need to be invoked to realize high HCN(1 – 0)/CO(1 – 0) ratio of , but with infrared pumping, it is easier to realize. Since this is not conclusive only with the LVG calculations, we discuss the possibility of infrared pumping with other observational results in the next subsection.
4.3.3 Possible Causes of High HCN Abundance
Based on the radiative transfer calculations above, it is necessary to have high HCN abundance to realize high HCN(1 – 0)/CO(1 – 0) ratio. There are several ways in which the HCN abundance may be enhanced. One possibility is due to high X-ray radiation from AGNs. Since X-ray radiation penetrates much deeper and denser regions than UV radiation, the chemical reactions exhibits different pathways compared with Photo-Dissociated Region (PDR). The molecular gas region that is irradiated by X-ray is called X-ray Dominated Region (XDR; Maloney et al., 1996), and some radiative transfer calculations of XDR succeeded to enhance the HCN abundance (Lepp & Dargarno, 1996; Lintott & Viti, 2006), but some do not (Meijerink & Spaans, 2005; Meijerink et al., 2007). Second possibility is energetic particles (i.e., cosmic rays) either from AGNs or radio jets. This possibility, however, reduces the HCN and HNC abundances, and increases the HCO+ abundance (Bayet et al., 2010), which do not match with our results. Another possibility is the high temperature gas phase chemistry as recently suggested by Harada et al. (2010, 2013). This radiative transfer calculation includes the time-dependent interstellar chemical gas-phase reaction network, so that this calculation gives resultant molecular gas abundances under strong heating by X-ray irradiation. The calculation results show high HCN abundance, which matches with our observations. Furthermore, the HNC abundance increase is an order of magnitude less than that for the HCN abundance, and the HCO+ abundance shows decrement under this model, which again matches with our results of non-detection for the HCO+(1 – 0) and HNC(1 – 0) lines. Indeed, the HCO+ vibrational absorption line at m has not been detected toward the luminous infrared galaxies from which the HCN vibrational absorption line at m has been detected (Imanishi et al., 2010). Since the HCO+ vibrational transition is located at a similar wavelength and has a similar Einstein coefficient as that of the HCN vibrational transition, non-detection of the HCO+ absorption line suggests that the HCN abundance has enhanced compared to that of the HCO+, consistent with this model. In addition, high HCN/HNC abundance ratios have been observed toward active star forming cores (Goldsmith et al., 1986; Schilke et al., 1992), and low ratios in starless cores (Hirota et al., 1998) in our Galaxy, which is again consistent with this model. Our results therefore strongly support the model presented in Harada et al. (2010, 2013).
On the other hand, the radiative transfer calculation results in Sect. 4.3.2 cannot realize HCN(1 – 0)/CO(3 – 2) above unity even under the HCN abundance enhanced conditions; in the CO(3 – 2) map (Fig. 3), contours at the level of , namely K, are at the nucleus, but no intensity peak has been observed as in the HCN map, if we consider the beam size. This suggests that HCN(1 – 0) is stronger than CO(3 – 2) at the nucleus, which is inconsistent with the calculation results in Fig. 7. One possible mechanism to make the HCN(1 – 0) emission strong is weak HCN masing. The infrared pumping can invert the population at the HCN(1 – 0) transition and possible to produce the maser emission at this transition (Dinh-V-Trung & Nguyen-Q-Rieu, 2000). The HCN(1 – 0) masers have indeed been observed toward various carbon stars (Izumiura et al., 1987, 1995; Olofsson et al., 1993). Under this excitation condition, and if the HCN molecule is distributed as an edge-on torus or disk that is similar to the water maser disk in NGC 4258 (Miyoshi et al., 1995), it is possible to create HCN maser emission at the systemic velocity. This matches well with the strong HCN(1 – 0) nuclear emission only at the systemic velocity channel (Figs. 3 and 4). Similar explanation has been discussed for the strong spike in the HNC(3 – 2) emission for the western nucleus of Arp 220 (Aalto et al., 2009), although our observation has not been detected any HNC emission, probably due to the high temperature gas phase chemistry in our case, as mentioned above.
Our results therefore suggest that there is a compact dense molecular gas in front of the type 2 AGN in M51 that cannot be resolved in our spatial resolution of ( pc). This component can be the obscuring material for the type 2 nucleus of M51; assume this component has a size of pc (i.e., much smaller than the spatial resolution of our observations) along the line of sight and a density of cm-3 (i.e., consistent with the radiative transfer calculation results in Sect. 4.3.2), then the column density along the line of sight will be calculated as cm-2. This value is consistent with the column density of cm-2 for the absorption material in front of the nuclear X-ray source (i.e., AGN) of M51 (Fukazawa et al., 2001). It is highly required to observe with HCN lines with resolution toward M51 to directly image the obscuring material in front of the AGN, which may give us knowledge about the still-unknown obscuring and feeding mechanisms of AGNs.
5. Summary
Our newly obtained ( pc) resolution HCN(1 – 0) image toward the Seyfert 2 nucleus of M51 (NGC 5194) revealed the following results:
-
•
The overall HCN(1 – 0) distribution and kinematics are similar to those of the CO lines. Since it is known that the kinematics derived from the CO lines indicates the jet-entrained nature, this similarity indicates that the dense gas is also entrained by the jets and outflowing from the AGN.
-
•
HCN(1 – 0)/CO(1 – 0) brightness temperature ratio is stronly enhanced along the jets with the value around unity, and the value is similar to that of the shocked gas in the outflows from young stellar objects in our Galaxy, suggesting that the HCN enhancement along the jets are highly related to shock.
-
•
A strong HCN(1 – 0) emission has been detected toward the nucleus only at the systemic velocity channel. No CO emission has been detected at this region and at this velocity, and therefore the ratio turned out to be more than 2. To realize this high ratio, it is suggested from our radiative transfer model that weak HCN maser triggered by the infrared pumping with HCN abundance enhancement is the possible mechanism. The most plausible configuration for emitting the HCN maser is a rotating edge-on dense molecular gas disk or torus around the AGN, similar to the water maser disks in other Seyfert 2 galaxies. If this disk or torus has the size of pc and the density of cm-2, then it is possible to explain the nuclear obscuration for this type 2 AGN in M51.
-
•
Cause of the high HCN abundance can be due to high temperature gas phase chemistry. Non-detection of the HCO+(1 – 0) and HNC(1 – 0) lines in our observations also support this model.
References
- Aalto et al. (1995) Aalto, S., Booth, R. S., Black, J. H., & Johansson, L. E. B. 1995, A&A, 300, 369
- Aalto et al. (2012) Aalto, S., Garcia-Burillo, S., Muller, S., Winters, J. M., van der Werf, P., Henkel, C., Costagliola, F., & Neri, R. 2012, A&A, 537, A44
- Aalto et al. (2009) Aalto, S., Wilner, D., Spaans, M., Wiedner, M. C., Sakamoto, K., Black, J. H., & Caldas, M. 2009, A&A, 493, 481
- Antonucci (1993) Antonucci, R. R. J. 1993, ARA&A, 31, 473
- Bayet et al. (2010) Bayet, E., Hartquist, T. W., Viti, S., Williams, D. A., & Bell, T. A. 2010, A&A, 521, A16
- Bradley et al. (2004) Bradley, L. D., Kaiser, M. E., & Baan, W. A. 2004, ApJ, 603, 463
- Brouillet et al. (2005) Brouillet, N., Muller, S., Herpin, F., Braine, J., & Jacq, T. 2005, A&A, 429, 153
- Carrol & Goldsmith (1981) Carrol, T. J., & Goldsmith, P. F. 1981, ApJ, 245, 891
- Combes & Becquaert (1997) Combes, F., & Becquaert, J.-F. 1997, A&A, 326, 554
- Combes et al. (2013) Combes, F., García-Burillo, S., Casasola, V., et al. 2013, A&A, 558, A124
- Crane & van der Hulst (1992) Crane, P. C., & van der Hulst, J. M. 1992, AJ, 103, 1146
- Davies et al. (2009) Davies, R. I., Maciejewski, W., Hicks, E. K. S., Tacconi, L. J., Genzel, R., & Engel, H. 2009, ApJ, 702, 114
- Deguchi & Uyemura (1984) Deguchi, S., & Uyemura, M. 1984, ApJ, 285, 153
- Dinh-V-Trung & Nguyen-Q-Rieu (2000) Dinh-V-Trung, & Nguyen-Q-Rieu 2000, A&A, 361, 601
- Dumouchel et al. (2010) Dumouchel, F., Faure, A., & Lique, F. 2010, MNRAS, 406, 2488
- Egusa et al. (2013) Egusa, F., Wada, T., Sakon, I., Onaka, T., Arimatsu, K., & Matsuhara, H. 2013, ApJ, 778, 1
- Farrah et al. (2007) Farrah, D., Bernard-Salas, J., Spoon, H. W. W., et al. 2007, ApJ, 667, 149
- Ford et al. (1985) Ford, H. C., Crane, P. C., Jacoby, G. H., Lawrie, D. G., & van der Hulst, J. M. 1985, ApJ, 293, 132
- Fukazawa et al. (2001) Fukazawa, Y., Iyomoto, N., Kubota, A., Matsumoto, Y., & Makishima, K. 2001, A&A, 374, 73
- Gao & Solomon (2004) Gao, Y., & Solomon, P. M. 2004, ApJ, 606, 271
- Goldsmith et al. (1986) Goldsmith, P. F., Irvine, W. M., Hjalmarson, A., & Ellder, J. 1986, ApJ, 310, 383
- Hagiwara et al. (2001) Hagiwara, Y., Henkel, C., Menten, K. M., & Nakai, N. 2001, ApJ, 560, L37
- Harada et al. (2010) Harada, N., Herbst, E., & Wakelam, V. 2010, ApJ, 721, 1570
- Harada et al. (2013) Harada, N., Thompson, T. A., & Herbst, E. 2013, ApJ, 765, 108
- Harris et al. (2006) Harris, G. J., Tennyson, J., Kaminsky, B. M., Pavlenko, Ya. V., & Jones, H. R. A. 2006, MNRAS, 367, 400
- Helfer & Blitz (1993) Helfer, T. T., & Blitz, L. 1993, ApJ, 419, 86
- Helfer & Blitz (1997) Helfer, T. T., & Blitz, L. 1997, ApJ, 478, 233
- Hicks et al. (2009) Hicks, E. K. S., Davies, R. I., Malkan, M. A., Genzel, R., Tacconi, L. J., Müller Sánchez, F., & Sternberg, A. 2009, ApJ, 696, 448
- Hirota et al. (1998) Hirota, T., Yamamoto, S., Mikami, H., & Ohishi, M. 1998, ApJ, 503, 717
- Ho et al. (1997) Ho, L. C., Filippenko, A. V., & Sargent, W. L. W. 1997, ApJS, 112, 315
- Ho et al. (2004) Ho, P. T. P., Moran, J. M., & Lo, F. 2004, ApJ, 616, L1
- Hsieh et al. (2008) Hsieh, P.-Y., Matsushita. S., Lim, J., Kohno, K., & Sawada-Satoh, S. 2008, ApJ, 683, 70
- Imanishi et al. (2013) Imanishi, M., & Nakanishi, K. 2013, AJ, 146, 91
- Imanishi et al. (2010) Imanishi, M., Nakanishi, K., Yamada, M., Tamura, Y., & Kohno, K. 2010, PASJ, 62, 201
- Irvine et al. (1987) Irvine, W. M., Goldsmith, P.F., & Hjalmarson, A. 1987, in Interstellar Process, ed. D. J. Hollenbach & H. A. Thronson (Dordrecht: Reidel), 585
- Izumiura et al. (1987) Izumiura, H., Ukita, N., Kawabe, R., Kaifu, N., Tsuji, T., Unno, W., & Koyama, K. 1987, ApJ, 323, L81
- Izumiura et al. (1995) Izumiura, H., Ukita, N., & Tsuji, T. 1995, ApJ, 440, 728
- Jackson et al. (1996) Jackson, J. M., Heyer, M. H., Paglione, T. A. D., & Bolatto, A. D. 1996, ApJ, 456, L91
- Jackson et al. (1993) Jackson, J. M., Paglione, T. A. D., Ishizuki, S., & Nguyen-Q-Rieu 1993, ApJ, 418, L13
- Jacquinet-Husson et al. (2011) Jacquinet-Husson, N., Crepeau, L., Armante, R., et al. 2011, J. Quant. Spec. Radiat. Transf., 112, 2395
- Jaffe et al. (2004) Jaffe, W., Meisenheimer, K., & Röttgering, H. J. A. 2004, Nature, 429, 47
- Kohno et al. (1996) Kohno, K., Kawabe, R., Tosaki T., & Okumura S. K. 1996, ApJ, 461, L29
- Kohno et al. (2001) Kohno, K., Matsushita, S., Vila-Vilaró, B., et al. 2001, ASP Conf. Ser. 249, 672
- Kohno et al. (2008a) Kohno, K., Muraoka, K.. Hatsukade, B., et al. 2008, in EAS Publ. Ser. 31, 65
- Kohno et al. (2008b) Kohno, K., Nakanishi, K., Tosaki, T., Muraoka, K., Miura, R., Ezawa, H., & Kawabe, R. 2008, Ap&SS, 313, 279
- Krips et al. (2011) Krips, M., Martín, S., Eckart, A., et al. 2011 ApJ, 736, 37
- Krips et al. (2007) Krips, M., Neri, R., García-Burillo, S., et al. 2007, A&A, 468, L63
- Lahuis et al. (2007) Lahuis, F., Spoon, H. W. W., Tielens, A. G. G. M., et al. 2007, ApJ, 659, 296
- Lepp & Dargarno (1996) Lepp, S., & Dalgarno, A. 1996, A&A, 306, L21
- Lintott & Viti (2006) Lintott, C., & Viti, S. 2006, ApJ, 646, L37
- Maloney et al. (1996) Maloney, P. R., Hollenbach, D. J., & Tielens, A. G. G. M. 1996, ApJ, 466, 561
- Matsushita et al. (2010) Matsushita, S., Kawabe, R., Kohno, K., Tosaki, T., & Vila-Vilaró, B. 2010, PASJ, 62, 409
- Matsushita et al. (1998) Matsushita, S., Kohno, K., Vila-Vilaró, B., Tosaki, T., & Kawabe, R., 1998, ApJ, 495, 267
- Matsushita et al. (2007) Matsushita, S., Muller, S., & Lim, J. 2007, A&A, 468, L49
- Matsushita et al. (2004) Matsushita, S., Sakamoto, K., Kuo, C.-Y., et al. 2004, ApJ, 616, L55
- Meijerink & Spaans (2005) Meijerink, R., & Spaans, M. 2007, A&A, 436, 397
- Meijerink et al. (2007) Meijerink, R., Spaans, M., & Israel, F. P. 2007, A&A, 461, 793
- Miyoshi et al. (1995) Miyoshi, M., Moran, J., Herrnstein, J., Greenhill, L., Nakai, N., Diamond, P., & Inoue, M. 1995, Nature, 373, 127
- Morris (1975) Morris, M. 1975, ApJ, 197, 603
- Müller Sánchez et al. (2009) Müller Sánchez, F., Davies, R. I., Genzel, R., Tacconi, L. J., Eisenhauer, F., Hicks, E. K. S., Friedrich, S., & Sternberg, A. 2009, ApJ, 691, 749
- Olofsson et al. (1993) Olofsson, H., Eriksson, K., Gustafsson, B., & Carlstrom, U. 1993, ApJS, 87, 305
- Sakamoto et al. (2010) Sakamoto, K., Aalto, S., Evans, A. S., Wiedner, M. C., & Wilner, D. J. 2010, ApJ, 725, L228
- Salter et al. (2008) Salter, C. J., Ghosh, T., Catinella, B., et al. 2008, AJ, 136, 389
- Sani et al. (2012) Sani, E., Davies, R. I., Sternberg, A., et al. 2012, MNRAS, 424, 1963
- Schilke et al. (1992) Schilke, P., Walmsley, C. M., Pineau Des Forets, G., Roueff, E., Flower, D. R., & Guilloteau, S. 1992, A&A, 256, 595
- Scoville et al. (1998) Scoville, N. Z., Yun, M. S., Armus, L., & Ford, H. 1998, ApJ, 493, L63
- Shetty et al. (2007) Shetty, R., Vogel, S. N., Ostriker, E. C., & Teuben, P. J. 2007, ApJ, 665, 1138
- Solomon et al. (1992) Solomon, P. M., Downes, D., & Radford, S. J. E. 1992, ApJ, 387, L55
- Sorai et al. (2002) Sorai, K., Nakai, N., Kuno, N., & Nishiyama, K. 2002, PASJ, 54, 179
- Takáts & Vinkó (2006) Takáts, K., & Vinkó, J. 2006, MNRAS, 372, 1735
- Tully (1988) Tully, R. B. 1988, Nearby Galaxies Catalog (Cambridge: Cambridge Univ. Press)
- Umemoto et al. (1992) Umemoto, T., Iwata, T., Fukui, Y., Mikami, H., Yamamoto, S., Kameya, O., & Hirano, N. 1992, ApJ, 392, L83
- Van der Tak et al. (2007) Van der Tak, F. F. S., Black, J. H., Schöier, F. L., Jansen, D. J., & van Dishoeck, E. F. 2007, A&A, 468, 627
- Wright et al. (1996) Wright, M. C. H., Plambeck, R. L., & Wilner, D. J. 1996, ApJ, 469, 216