Evolution of grain size distribution in high-redshift dusty quasars: Integrating large amounts of dust and unusual extinction curves
Abstract
The discoveries of huge amounts of dust and unusual extinction curves in high-redshift quasars () cast challenging issues on the origin and properties of dust in the early universe. In this Letter, we investigate the evolutions of dust content and extinction curve in a high- quasar, based on the dust evolution model taking account of grain size distribution. First, we show that the Milky-Way extinction curve is reproduced by introducing a moderate fraction (0.2) of dense molecular-cloud phases in the interstellar medium for a graphite-silicate dust model. Then we show that the peculier extinction curves in high- quasars can be explained by taking a much higher molecular-cloud fraction (0.5), which leads to more efficient grain growth and coagulation, and by assuming amorphous carbon instead of graphite. The large dust content in high- quasar hosts is also found to be a natural consequence of the enhanced dust growth. These results indicate that grain growth and coagulation in molecular clouds are key processes that can increase the dust mass and change the size distribution of dust in galaxies, and that, along with a different dust composition, can contribute to shape the extinction curve.
keywords:
dust, extinction – galaxies: evolution – galaxies: ISM – galaxies: general – ISM: clouds – stars: formation1 Introduction
There are some pieces of evidence that the extinction curves observed for high-redshift () quasars are different from those for the lower-redshift counterparts. Maiolino et al. (2004) found that the quasar SDSS J1048+4637 (hereafter J1048+4637) at exhibits an unusual UV extinction curve, being flat at wavelengths Å and rising at Å. Gallerani et al. (2010) showed that the UV extinction curves in seven reddened quasars at 3.9–6.4 have no 2175 Å bump and are flatter than those in quasars at which are described by the extinction curve in the Small Magellanic Cloud (SMC) (Richards et al. 2003; Hopkins et al. 2004). It has also been suggested that the extinction laws in the quasars CFHQS J1509–1749 at (Willott et al. 2007) and SDSS J1044–0125 at (Maiolino et al. 2004) are similar to that in the quasar J1048+4637 (but see Hjorth et al. 2013). The UV extinction curve in J1048+4637 is successfully reproduced by the models of dust produced by Type II supernovae (SNe II) (Maiolino et al. 2004; Hirashita et al. 2005; Bianchi & Schneider 2007; Hirashita et al. 2008), which seems to support the idea that the interstellar dust in such early epochs was predominantly supplied by SNe II generating from massive stars with short lifetimes.
On the other hand, a significant fraction of high- quasars, including J1048+4637, manifest the presence of dust mass in excess of in their host galaxies (e.g. Calura et al. 2014). Such huge amounts of dust grains can be explained by dust production in SNe II if one SN ejects more than 1 of dust (Dwek, Galliano, & Jones 2007; Dwek & Cherchneff 2011) and/or if the stellar initial mass function (IMF) is biased to a much higher mass than the local one (Valiante et al. 2009; Gall, Andersen, & Hjorth 2011a, 2011b). However, many studies have argued that, in addition to the contributions from SNe II and asymptotic giant branch (AGB) stars, grain growth via accretion of gaseous metals in the interstellar medium (ISM) is required to account for the observed dust mass (Michalowski et al. 2010; Pipino et al. 2011; Mattsson 2011; Valiante et al. 2011; Kuo & Hirashita 2012). Thus, if grain growth is the dominant process for increasing the dust mass, as is considered in the Milky Way (MW) (Dwek & Scalo 1980; Zhukovska, Gail, & Trieloff 2008; Inoue 2011; Hirashita & Kuo 2011; Asano et al. 2013a), then the observed unusual extinction curves may not necessarily reflect the SN origin of dust in high- quasars.
Most of the dust evolution models focused only on reproducing the observed dust mass by estimating the contributions of dust formation and destruction to the total dust budget in galaxies. These models assumed a representative grain size or a specific grain size distribution throughout the galaxy evolution, and thus cannot make any prediction on extinction curves. In addition, the efficiencies of dust destruction and grain growth, as well as the efficiency of extinction by dust, heavily depend on the size distribution of the dust grains. In particular, the efficiency of grain growth is higher for a smaller surface-to-volume ratio of the grains, and the efficient production of small grains through shattering by grain-grain collisions is found to be necessary for boosting the mass of dust via grain growth (Hirashita & Kuo 2011; Kuo & Hirashita 2012; Asano et al. 2013b). Hence, to model properly the evolution of dust mass and to predict the extinction curves, it is essential to clarify how the size distribution of grains changes in the course of galaxy evolution.
Recently, Asano et al. (2013b) constructed an evolution model of grain size distribution taking into account the fundamental physical processes of formation and destruction of dust. This model enables us to predict the extinction curves in galaxies as a function of time (Asano et al. 2014). In this Letter, we apply their dust evolution model to investigate the evolution of grain size distribution and the expected extinction curves in high- quasars.111 As in the previous studies, we here assume that the extinction curves of high- quasars are shaped by the interstellar dust in the host galaxies. However, it may be possible that they reflect the properties of dust in the local environments such as the nuclear tori (e.g., Gaskwell et al. 2004). In Section 2, we briefly describe our dust evolution model, and illustrate how the MW extinction curve is reproduced by our model. In Section 3, we present the results for the evolution of dust and extinction curves in high- dusty quasars. In Section 4, we provide the conclusions. Throughout this Letter, we assume dust grains to be spherical.
2 Dust evolution model and reproduction of extinction curve in the Milky Way
2.1 Review of the adopted model
In this study, we adopt the evolution model of dust in galaxies constructed by Asano et al. (2013b). This model self-consistently treats the time variation of size distribution of interstellar dust caused by the following dust processes: dust formation by SNe II and AGB stars, grain growth due to the accretion of gaseous metals, dust destruction by interstellar shocks, shattering and coagulation due to grain-grain collisions in the ISM.
In the model, the composition, size distribution, and mass of dust ejected by SNe II are taken from the calculations of dust formation in the ejecta and dust destruction in the reverse shocks by Nozawa et al. (2003, 2007). The masses of various grain species produced by AGB stars are taken from Zhukovska et al. (2008), assuming that the size distributions of those grains are lognormal with a peak at a grain radius m. The initial stellar mass ranges of SNe II and AGB stars are set to be 8–40 and 1–7 , respectively, under the Salpeter IMF in the stellar mass range of 0.1–100 . The star formation rate at a time is calculated as , where is the total mass of gas and dust in the ISM, and is the timescale of star formation.
In this dust evolution model, the size distributions of grain species except for carbonaceous grains are summed up so that they are integrated as silicate grains. This corresponds to the fact that two dust species, carbonaceous (graphite) and silicate grains, are taken as major components of interstellar dust, to simplify the calculations of grain growth, shattering, and coagulation, as well as the calculations of extinction curves. For the growth process of grains, the accretion of refractory elements onto pre-existing grains is calculated with the sticking probability of unity, by following the prescription in Hirashita & Kuo (2011). As for the destruction of interstellar dust in high-velocity shocks driven by supernovae, the modification of grain size distribution by sputtering is computed on the basis of the formulae in Yamasawa et al. (2011).
The model also takes into account the processing of dust through shattering and coagulation in the interstellar turbulence (Hirashita & Yan 2009). It is assumed that shattering occurs if the relative velocity of grains is higher than 1.2 and 2.7 km s-1 for carbonaceous and silicate grains, respectively (Jones, Tielens, & Hollenbach 1996). Coagulation occurs for the relative velocities lower than – km s-1, depending on the composition and radius of grains (Chokshi, Tielens, & Hollenbach 1993). Grain velocities in turbulence are taken from the results of magnetohydrodynamic calculations by Yan, Lazarian, & Draine (2004).
In order to follow the contributions of shattering and coagulation in different phases of the ISM, multiple phases are considered within a framework of the one-zone closed model; the contributions of dust processes in each phase are weighted by a mass fraction of each ISM phase , where denotes the phase of the ISM. Asano et al. (2013b) considered a two-phase model of the ISM: warm neutral medium (WNM, with gas temperature K, and hydrogen number density ) and cold neutral medium (CNM, K, ) with . In this two-phase model, grain growth, whose rate is proportional to the gas density, occurs only in the CNM. Shattering due to collisions between grains occurs in the WNM, whereas coagulation due to collisions between grains occurs predominantly in the CNM.
We also calculate the extinction curves following Asano et al. (2014), who used the optical constants of graphite and silicate taken from Draine & Lee (1984). In this Letter, we also adopt the optical constants of amorphous carbon (see Section 3).
2.2 New features in this work
Asano et al. (2014) found that the extinction curve derived from the dust evolution model by Asano et al. (2013b) shows too steep a UV slope and too large a 2175 Å bump to be consistent with that in the MW (see Figure 6 in Asano et al. (2014)). This indicates that the grain size distribution predicted by this model is largely overabundant in small grains, compared with the interstellar dust models deduced from the fitting to the average MW extinction curve (Mathis, Rumpl, & Nordsieck 1977; Weingartner & Draine 2001; Zubko, Dwek, & Arendt 2004). The classical interstellar dust model by Mathis et al. (1977) has a power-law size distribution in the range of 0.005–0.25 m, while the grain size distribution by Asano et al. (2013b) has a bump at 0.01–0.03 m.
Asano et al. (2014) argued that one of the reasons for this overabundance of small grains (underabundance of large grains) might be inefficient coagulation resulting from the unreasonably low threshold velocities of coagulation. Thus, they also examined a case where the threshold velocity of coagulation is removed, keeping the other parameters unchanged ( Gyr and ). However, as shown in Figure 1, the resulting extinction curve at Gyr is still too steep with too strong a UV bump, although it is nearer to the observed MW extinction curve than the original model with the coagulation threshold. The absence of coagulation threshold is supported by the studies of the variation of extinction curves in the MW (Hirashita & Voshchinnikov 2014).
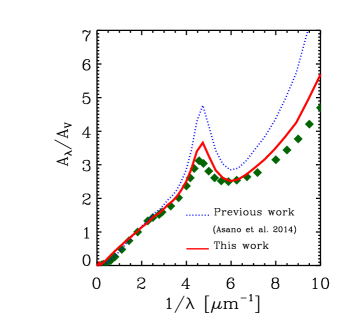
To overcome this defect, in the present calculations, we include the third phase of the ISM, molecular clouds (MC, K, cm-3), where the gas density is high enough to increase the efficiency of coagulation. In fact, a three-phase ISM model is suggested, for which the MC phase has a similar mass fraction to the CNM (e.g. Whittet 2003). The solid line in Figure 1 shows the extinction curve for the three-phase ISM with , , and . The extinction curve becomes flatter thanks to the enhanced production of large grains by coagulation (and grain growth) in MCs, and much better agrees with the MW extinction curve, although the agreement is not perfect. Nevertheless, given the variety of extinction curves along the lines of sight (Fitzpatrick & Massa 2007; Nozawa & Fukugita 2013), we regard that the agreement is satisfactory. This allows us to conclude that our dust evolution model can reproduce the MW extinction curve with a reasonable choice of if the coagulation threshold velocity is excluded. In what follows, we assume no threshold velocity for the calculation of coagulation.
3 Dust evolution in high-redshift quasars
In the last section, we demonstrated that the evolution model of grain size distribution reasonably reproduces the MW extinction curve. Thus, it is a powerful tool with which we can discuss the difference in the extinction curve, according to the properties and ages of galaxies. In this section, we apply this model to high- dusty quasars to investigate the evolution of dust grains and extinction curves in such young systems. It should also be emphasized that a mass fraction of each ISM phase is important in regulating the size distribution of interstellar dust grains, as shown in Section 2.2.
For high- dusty quasars, it is deduced from their extremely high far-infrared luminosities that intense starbursts are ongoing with the star formation rates of yr-1 (e.g., Bertoldi et al. 2003). This implies that a huge amount of dense molecular clouds, in which stars are born, are present in their host galaxies. In fact, according to the compilation of high- quasars in Calura et al. (2014), a mass fraction of H2 molecules to the total hydrogen (H + H2) is in the range of 70–97 %, suggesting that a mass fraction of the MC phase is significantly high in these quasar hosts. Therefore, in the calculations of dust evolution in high- quasars, we adopt a two-phase model of WNM and MC with and .
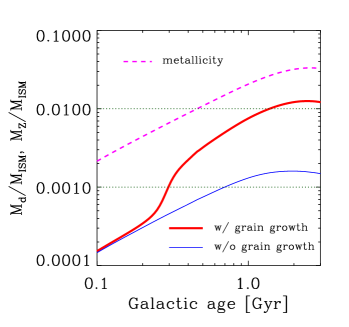
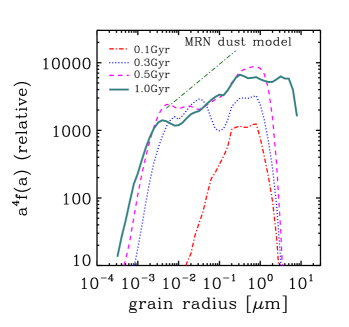
Figure 2 (left panel) shows the evolutions of dust-to-gas mass ratios () and metallicity () calculated by our dust evolution model. Since the star formation rates are found to be very high for high- dusty quasars, we here adopt Gyr, which is ten times shorter than in the case of the MW. At the initial phases of the galaxy evolution ( Gyr), stellar ejecta enrich the ISM with dust grains of 0.1–1 m (see the right panel of Figure 2). Then, shattering becomes effective at Gyr, producing a large number of small grains. Since the ISM is considerably enriched with metals ( ) by this epoch, these small grains efficiently grow through the accretion of gaseous metals in MCs, enhancing the dust-to-gas mass ratio quickly. Around Gyr, the dust mass produced by grain growth accounts for more than 80 % of the total dust mass, and the dust-to-gas mass ratio increases up to 0.01. Given that these high- quasars have the ISM mass well above (Calura et al. 2014), this result can fully explain the observed masses of dust in excess of .
Figure 2 also presents the evolution of dust-to-gas mass ratio without grain growth (thin solid line). If grain growth does not work, the dust-to-gas mass ratio reaches only at 1–2 Gyr. This value exceeds a lower limit of dust-to-gas mass ratios (), derived by taking the dynamical mass as the total mass of the ISM (Kuo & Hirashita 2012). However, the dynamical mass includes all components (gas, stars, and dark matter), so this lower limit is likely to underestimate largely the dust-to-gas mass ratio for most of the high- quasars. Although we could not completely reject the model without grain growth, the model with grain growth more robustly explains the large dust-to-gas ratio in high- quasars (see also Valiante et al. 2011).
Figure 3 shows the time evolution of the UV extinction curve (normalized to the extinction at ) corresponding to the dust evolution with grain growth given in Figure 2. At Gyr, when SNe II predominantly inject large grains into the ISM, the extinction curve is flat. From Gyr, at which small grains are produced due to shattering, the extinction curve becomes steep, and its shape is regulated by the dust processes in the ISM (shattering and grain growth) not by the properties of dust supplied by stellar sources. After that, the UV extinction curve becomes flatter again due to the increase in large grains by efficient coagulation in MCs. At Gyr, the extinction curve has the prominent 2175 Å bump, but its overall slope is much flatter than the SMC extinction curve, which is considered to be valid for low- quasars.
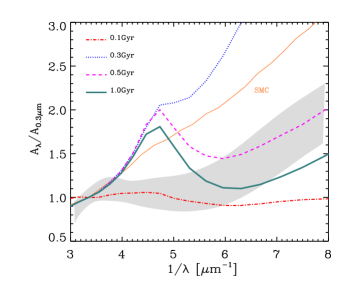
We note that, if SNe II are only the sources of interstellar dust (i.e. without grain growth) throughout the galaxy evolution, the resulting extinction curves remain too flat, like the one at Gyr (dot-dashed line) in Figure 3. Such flat extinction curves would be inconsistent with the extinction curve (see also Hirashita et al. 2008). Furthermore, it is hard to explain the observed dust content only by dust production in SNe II. Thus, the above results indicate that the high dust-to-gas mass ratio and the tendency that extinction curves are moderately flat in high- quasars can be simultaneously explained only by introducing a large molecular-cloud fraction which leads to high rates of grain growth and coagulation.
It should be noticed here that the calculated extinction curves show the prominent 2175-Å bump, which disagrees with the extinction curves observed for high- quasars. This might be a discrepancy arising from the grain material rather than from the grain size distribution. We used graphite to fit the 2175-Å bump, but it has been suggested that the carrier of this UV bump is polycyclic aromatic hydrocarbons (PAHs) (Joblin, Leger, & Martin 1992; Weingartner & Draine 2001). PAHs are likely to form through photo-fragmentation of small amorphous hydrocarbon (Jones 2009) and/or shattering of large carbonaceous grains (Seok, Hirashita, & Asano 2014), while PAHs are efficiently destroyed by SN shocks and/or UV radiation from massive stars, which is not included in our model. The observations of some carbonaceous features including mid-infrared PAH emissions in high- galaxies may give us a clue to the properties of carbonaceous dust in the early universe (e.g. Riechers et al. 2014).
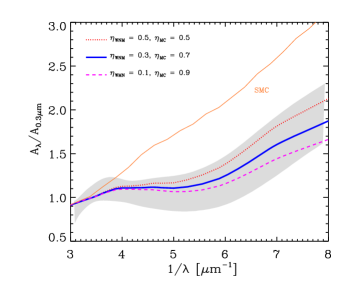
Because of poor knowledge on the properties of carbonaceous materials in high- galaxies, we also calculate the extinction curves by adopting the optical constants of amorphous carbon by Zubko et al. (1996), instead of graphite. The results are shown in Figure 4, where the extinction curves at Gyr are plotted for the cases of , , and . For a higher , the extinction curve is flatter because more efficient coagulation is realized. As is evident from Figure 4, changing the properties of carbonaceous materials with a large () leads to a successful fit to the high- quasar extinction curve represented by the one in SDSS J1048+4637.
The above results imply that the primary form of carbonaceous grains in high- dusty quasars is amorphous carbon, and that the fraction of molecular clouds is higher than 0.5 in the host galaxies. Although the origin of the different composition of carbonaceous materials in high- galaxies from those in the local galaxies cannot be resolved by our dust evolutin model, the absence of the 2175-Å bump in high- extinction curves may suggest inefficient formation and/or efficient destruction of small size of graphite and PAHs. Furthermore, a high fraction of molecular clouds is the key in explaining a high dust-to-gas mass ratio in high- quasars, since molecular clouds are unique sites in which dust mass growth by accretion, as well as dust size growth by coagulation, occurs efficiently.
4 Conclusion
We investigated how the massive amounts of dust and the extinction curves in high- dusty quasars can be reproduced in a self-consistent manner, and discussed the difference in the ISM condition between the Milky Way (MW) and the high- quasars. First, we found that the MW extinction curve is successfully reproduced by our dust evolution model with a three-phase ISM including the phase of molecular clouds. We also showed that our model can simultaneously account for the large amount of dust and the peculiar extinction curves in high- quasars if a large fraction of the ISM mass is in molecular clouds. These results demonstrate that grain growth and coagulation in molecular clouds are the key processes to detemine the properties of interstellar dust both in the MW and high- galaxies. In addition, the optical properties of carbonaceous dust are needed to be changed: graphite is used for the MW, while amorphous carbon is applied for the high- quasars. This indicates the difference in the property of carbonaceous dust between the MW and the high- galaxies.
Acknowledgments
We are grateful to the anonymous referee for critical comments. We are also grateful to Y. Matsuoka and T. Minezaki for useful comments. We thank R. Maiolino for kindly providing us with the data on the extinction curve of SDSS J1048+4637. TN and TTT are supported by JSPS KAKENHI (22684004, 23224004, 23340046, 26400223). HH thanks the support from the Ministry of Science and Technology (MoST) grant 102-2119-M-001-006-MY3.
References
- Asano et al. (2013a) Asano R. S., Takeuchi T. T., Hirashita H., Inoue A. K., 2013a, Earth Planets and Space, 65, 213
- Asano et al. (2013b) Asano R. S., Takeuchi T. T., Hirashita H., Nozawa T., 2013b, MNRAS, 432, 637
- Asano et al. (2014) Asano R. S., Takeuchi T. T., Hirashita H., Nozawa T., 2014, MNRAS, 440, 134
- Bertoldi et al. (2003) Bertoldi F., Carilli C. L., Cox P., Fan X., Strauss M. A., Beelen A., Omount A., Zylka R., 2003, A&A, 406, L55
- Bianchi & Schneider (2007) Bianchi S., Schneider R., 2007, MNRAS, 378, 973
- Calura et al. (2014) Calura F., Gilli R., Vignali C., Pozzi F., Pipino A., Matteucci F., 2014, MNRAS, 438, 2765
- Chokshi, Tielens, & Hollenbach (1993) Chokshi A., Tielens A. G. G. M., Hollenbach, D., 1993, ApJ, 407, 806
- Draine & Lee (1984) Draine B. T., Lee H. M., 1984, ApJ, 285, 89
- Dwek & Scalo (1980) Dwek E., Scalo, J. M., 1980, ApJ, 239, 193
- Dwek et al (2007) Dwek E., Galliano F., Jones A. P., 2007, ApJ, 662, 927
- Dwek & Cherchneff (2011) Dwek E., Cherchneff I., 2011, ApJ, 727, 63
- Fitzpatrick & Massa (2007) Fitzpatrick E. L., Massa D., 2007, ApJ, 663, 320
- Gall et al. (2011a) Gall C., Andersen A. C., Hjorth J., 2011a, A&A, 528, 13
- Gall et al. (2011b) Gall C., Andersen A. C., Hjorth J., 2011b, A&A, 528, 14
- Gallerani et al. (2010) Gallerani S., et al., 2010, A&A, 523, 85
- Gaskwell et al. (2004) Gaskwell C. M., Goosmann R. W., Antonucci R. R. J., Whysong D. H., 2004, ApJ, 616, 147
- Hirashita et al. (2005) Hirashita H., Nozawa T., Kozasa T., Ishii T. T., Takeuchi T. T., 2005, MNRAS, 357, 1077
- Hirashita et al. (2008) Hirashita H., Nozawa T., Takeuchi T. T., Kozasa T., 2008, MNRAS, 384, 1725
- Hirashita & Yan (2009) Hirashita H., Yan H., 2009, MNRAS, 394, 1061
- Hirashita (2011) Hirashita H., Kuo T.-M., 2011, MNRAS, 416, 1340
- Hirashita & Voshchinnikov (2014) Hirashita H., Voshchinnikov N. V., 2014, MNRAS, 437, 1636
- Hjorth et al. (2013) Hjorth J., Vreeswijk P. M., Gall C., Watson D., 2013, ApJ, 768, 173
- Hopkins et al. (2004) Hopkins P. F., et al., 2004, AJ, 128, 1112
- Inoue (2011) Inoue A. K., 2011, Earth Planets and Space, 63, 1
- Joblin, Leger, & Martin (1992) Joblin C., Leger A., Martin P., 1992, ApJ, 393, L79
- Jones, Tielens & Hollenbach (1996) Jones A. P., Tielens A. G. G. M., Hollenbach D. J., 1996, ApJ, 469, 740
- Jones (2009) Jones A. P., 2009, in Henning Th., Grün E., Steinacker J., eds, ASP Conf. Ser. Vol. 414, Cosmic Dust – Near and Far. Astron. Soc. Pac., San Francisco, p. 473
- Kuo & Hirashita (2012) Kuo T.-M., Hirashita H., 2012, MNRAS, 424, L34
- Maiolino et al. (2004) Maiolino R., Schneider R., Oliva E., Bianchi S., Ferrara A., Mannucci F., Pedani M., Roca Sogorb, M., 2004, Nature, 431, 533
- Mathis, Rumpl & Nordsieck (1977) Mathis J. S., Rumpl W., Nordsieck, K. H., 1977, ApJ, 217, 425
- Mattsson (2011) Mattsson L., 2011, MNRAS, 414, 781
- Michałowski et al. (2010) Michalowski M. J., Murphy E. J., Hjorth J., Watson D., Gall C., Dunlop J. S., 2010, A&A, 522, 15
- Nozawa et al. (2003) Nozawa T., Kozasa T., Umeda H., Maeda K., Nomoto K., 2003, ApJ, 598, 785
- Nozawa et al. (2007) Nozawa T., Kozasa T., Habe A., Dwek E., Umeda H., Tominaga N., Maeda K., Nomoto, K., 2007, ApJ, 666, 955
- Nozawa & Fukugita (2013) Nozawa T., Fukugita, M., 2013, ApJ, 770, 27
- Pipino et al. (2011) Pipino A., Fan X. L., Matteucci F., Calura F., Silva L., Granato G., Maiolino, R., 2011, A&A, 525, 61
- Richards et al. (2003) Richards G. T., et al., 2003, AJ, 126, 1131
- Riechers et al. (2014) Riechers D. A., et al., 2014, ApJ, 786, 31
- Seok, Hirashita, & Asano (2014) Seok J. Y., Hirashita H., Asano, R. S., 2014, MNRAS, 439, 2186
- Valiante et al. (2009) Valiante R., Schneider R., Bianchi S., Andersen A. C., 2009, MNRAS, 397, 1661
- Valiante et al. (2011) Valiante R., Schneider R., Salvadori S., Bianchi S., 2011, MNRAS, 416, 1916
- Weingartner & Draine (2001) Weingartner J. C., Draine B. T., 2001, ApJ, 548, 296
- Whittet (2003) Whittet D. C. B., 2003, Dust in the Galactic Environments, 2nd edn. IoP Publishing, Bristol, P. 76
- Willott et al. (2007) Willott C. J., et al., 2007, AJ, 134, 2435
- Yamasawa et al. (2011) Yamasawa D., Habe A., Kozasa T., Nozawa T., Hirashita H., Umeda H., Nomoto K., 2011, ApJ, 735, 44
- Yan et al. (2004) Yan H., Lazarian A., Draine B. T., 2004, ApJ, 616, 895
- Zhukovska, Gail, & Trieloff (2008) Zhukovska S., Gail H. P., Trieloff M., 2008, A&A, 479, 453
- Zubko et al. (1996) Zubko V. G., Mennella V., Colangeli L., Bussoletti E., 1996, MNRAS, 282, 1321
- Zubko, Dwek, & Arendt (2004) Zubko V., Dwek E., Arendt R. G., 2004, A&A, ApJS, 152, 211