Royal Holloway, University of London, UK \PACSes\PACSit14.65ha
Studies of top quark production with the ATLAS detector at the LHC
Abstract
A review is presented of the most recent measurements of top quark strong and electroweak production performed by using data collected with the ATLAS detector in proton-proton collisions at = 7 and 8 TeV at the Large Hadron Collider corresponding to integrated luminosities of up to about 4.7 and 20 , respectively.
1 Why top quark?
The top quark () is the most massive known elementary particle. Its large expected Yukawa coupling with the newly discovered Higgs boson gives it a prominent role in the electroweak symmetry breaking mechanism. The measurement of its production and decay at colliders is then a crucial test of the standard model (SM) and a probe for new physics. On one hand understanding top quark production allows to control a crucial background both to Higgs boson production and to possible new physics like supersymmetry. On the other hand, many new physics scenarios, from the presence of extra dimensions to the existence of new strong forces, require direct or indirect couplings of new particles to top quarks that could modify the SM top quark production cross section.
2 Top producer and observer
Abundant production of top quarks is desirable for a detailed study of their properties.
The Large Hadron Collider [1] is a prolific top quark
producer. During its first run period (Run 1), the LHC collided
protons at the unprecedented center-of-mass
energies () of 7 and 8 TeV, respectively in 2010-2011 and in
2012. Run 1 was characterized by smooth running conditions and a
vertiginous increase in peak luminosity from in 2010 to the
peak value of in
2012. The integrated luminosity
(Ldt) delivered per collision point was about 5 in 2011 and 22
in 2012, respectively 100 and 440 times larger than the one
delivered in 2010 (50 pb-1).
The ATLAS detector [2] is an excellent top observer.
A multi-purpose composite detector with cylindrical symmetry around the
line of collision of the proton beams, it covers nearly the
entire solid angle surrounding the collision point.
From the innermost layer outwards, it features an inner tracking
detector, surrounded by a thin superconducting solenoid magnet producing a 2 T
axial magnetic field, followed by electromagnetic and hadronic
calorimeters and by an external muon
spectrometer incorporating three large toroid magnet assemblies.
The full detector is at play in reconstructing events with top quarks, efficiently
selected by a three-level trigger system which reduces the overall event rate to
about 400 Hz into storage.
3 Top quark production and decay at LHC: predictions
In LHC proton-proton collisions top quarks are predominantly strongly
produced in top-antitop () pairs. At = 7 (8) TeV the largely enhanced gluon-gluon fusion
process dominates over the quark-quark annihilation process (85% vs 15% of the total
cross section at leading order) and it boosts the production cross
section, , to a value that is 25 (35) times larger than
that foreseen and observed in proton-antiproton collisions at = 1.96 TeV
at the Tevatron. The predicted value of is now known at the level of
about 4% thanks to recent breakthrough calculations including all
Quantum Chromodynamics (QCD) effects at NNLO, complemented with NNLL resummation [3].
At a rate of about half the production [4, 5, 6], the top quark is
also produced singly; such production is described (at leading order) by three
electroweak processes. The boson mediated - and -channel account respectively for
75% and 5% of the total single top quark production cross section,
, while the remaining 20% is accounted for by the
associated production of a single top quark and a boson, mediated
by a -quark.
Thanks to the large top quark production cross sections, the LHC
produced about 5.4 (0.96) million events and 2.5 (0.47)
million single top quark events at = 8 (7) TeV.
As the top quark decays to a boson and a -quark about 100% of the times,
the final state of a event is characterized by the number of
bosons decaying
to a lepton-neutrino pair 111The () decay takes place 32.4% (67.6%) of the times where
is a light quark, is a lepton, is the
corresponding lepton neutrino..
The case when both bosons decay hadronically represents 45.7% of
the events (fully hadronic channel), while 44.1% of the events feature
only one boson decaying to a lepton () and the corresponding neutrino
() ( 34.3% of the times is an electron () or a muon
(), or a tau () decaying to an or ) (single lepton
channels). The leptonic decay of both bosons to , or takes place 6.5% of the
time while the remaining 3.7% corresponds to hadronic
decays associated with a lepton.
The final state consists of -jets from -quark production, high jets from hadronic boson decays, at least one or two high
leptons and large missing transverse energy
() due to the neutrino in boson leptonic decays.
The and single top quark final states have similar backgrounds (single
bosons (, ) plus jets, dibosons and multi-jet events)
and they are background to each other.
4 Top quark pair production
4.1 Inclusive at = 8 TeV
The latest ATLAS measurement of [7] uses dilepton events selected from the full dataset collected at = 8 TeV (Ldt = 20.3 ) by requiring a pair of central, high momentum, opposite-sign and . The dominant single top quark background in the -channel is derived from simulation. The estimates of the smaller fake lepton and backgrounds are data-driven by extrapolating the content of background-enriched control regions in same sign lepton pair events and in events respectively. The contents of the two highly -pure samples obtained
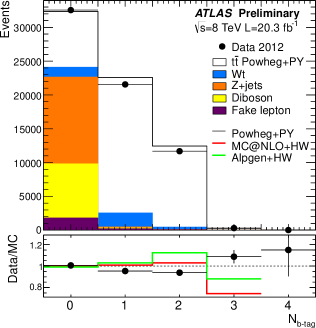
by requiring exactly one and two -tagged jets (shown in
fig. 1) are expressed as functions of and the efficiency to
select, reconstruct and -tag a jet, . A simultaneous
fit to the content of the two samples is performed to extract and
and to use the data information to constrain
jet-related and -tagging systematic uncertainties.
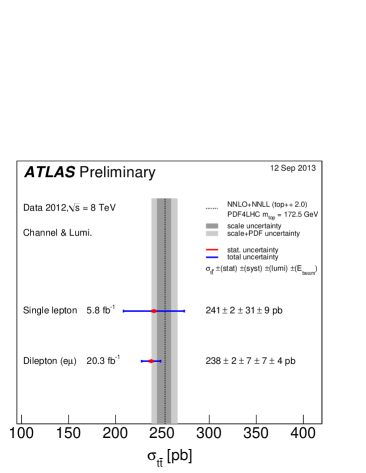
The resulting cross section is
in agreement with the SM prediction.
The relative total uncertainty of 4.8% is dominated by systematic
effects originating mostly from the limited knowledge of
the total integrated luminosity and of the beam energy, with the other
two major contributions coming from modelling and electron
isolation efficiency.
4.2 Summary of inclusive at = 7 and 8 TeV
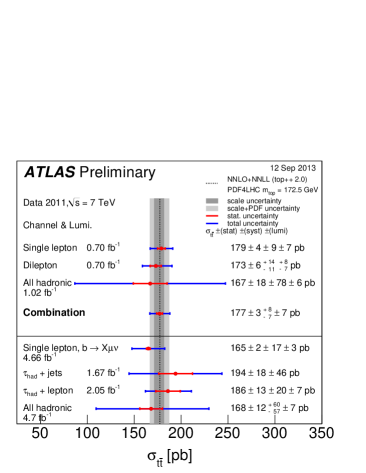
The very precise dilepton measurement of outlined in sect. 4.1 is one of the many results obtained using a variety of final state samples at = 7 and 8 TeV [8, 9] and illustrated in fig. 2. The measurements are dominated by systematic uncertainties and they are well consistent with the latest NNLO+NNLL QCD predictions [3]. The relative uncertainty, /, of the most precise results, the ATLAS combination at = 7 TeV (/ = 6.2%) and the dilepton measurement at = 8 TeV (/ = 4.8%) is comparable with the theoretical relative uncertainty of about 4%. ATLAS also contributes to the first LHC combination [10] at = 7 TeV which gives with a relative total uncertainty of 5.8%.
4.3 at = 7 TeV
Going to a more exclusive final state, the cross section for the production of a top quark pair in association with at least one - or - quark is extracted using the full dataset collected at = 7 TeV (Ldt = 4.7 ) [11]. The + or + X final state is the main background to the associate production of a top quark pair with a Higgs boson decaying to a quark pair. Events are selected in the dilepton channel by requiring two opposite-sign leptons (, ) and at least two central high jets. Appropriate requirements on large boson transverse mass (), dilepton mass and , the sum of the of all jets and leptons in the event, are used to select same flavour (, ) and opposite flavour () leptons. The backgrounds are estimated and subtracted in a similar way as those for the dilepton measurement outlined in sect. 4.1. Two main ingredients are then determined. In the subset of events with at least three -tagged jets the cross section for the production of a pair in association with heavy flavours (at least one - or -quark) is calculated as = in fiducial form such that the acceptance correction is calculated with respect to a phase space volume close to the experimentally selected one. The number of -tagged jets arising from additional heavy flavours with respect to the system, , is obtained by a maximum likelihood fit of templates of jets with different origin ( additional heavy flavour, non- and mis-tagged jets) to the two dimensional distribution of -tagged jet and displaced vertex mass. The distribution of the latter variable, displayed in fig. 3, is shown to be sensitive to - , -jet and light jet content.
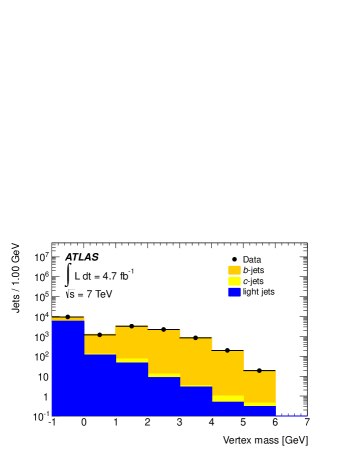
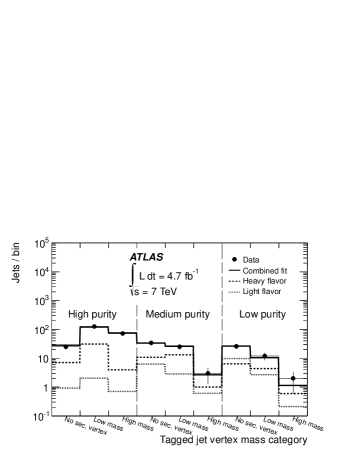
The fit is carried out using three samples with increasing -tagging purity to enhance the separation between light and heavy flavour jets (as shown in fig. 3 on the right). The selected 106 events feature about 325 jets whose large uncertainty on the - and -jet separation content only allows to measure the combined heavy flavour content. The value is then converted into by scaling it with and the simulation-derived efficiency for selecting events with at least three - or -matched jets (two of which come from the pair). The second ingredient is the fiducial cross section for the production of a top quark pair associated with at least one additional jet, = . The value of is determined by counting , the number of events with at least three jets, at least two of which are -tagged, and by scaling it with and the simulation-derived efficiency for selecting events with at least three jets (two of which come from the pair). The two ingredients are then combined to produce the cross section ratio which is consistent with SM predictions ranging from 3.4% (ALPGEN) to 5.2% (POWHEG). The relative uncertainty is dominated by systematic uncertainties on -tagging efficiency ( 21%), hadronization ( 10%) and flavour composition( 6%).
4.4 Differential in lepton plus jets events at = 7 TeV
The large number of events allows to measure differential cross sections in the lepton plus jets sample using the full dataset collected at = 7 TeV [12]. Events are selected by requiring at least one isolated high lepton ( or ), large and , consistent with only one leptonically decaying boson, plus at least four high central jets and at least one -tagged jet, due to the full hadronic decay of one top quark and the one -jet in the decay of the other top quark. After estimating the dominant background with data-driven techniques (using the charge-asymmetric boson production at LHC) and the remaining small background with a mix of simulation (for single top quark and dibosons) and data-driven techniques (for events with fake leptons), the full topology is reconstructed with a kinematic likelihood fit incorporating the knowledge of the boson mass and the constraint of same mass for top and antitop quarks.
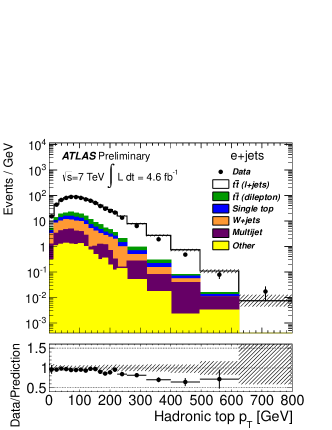
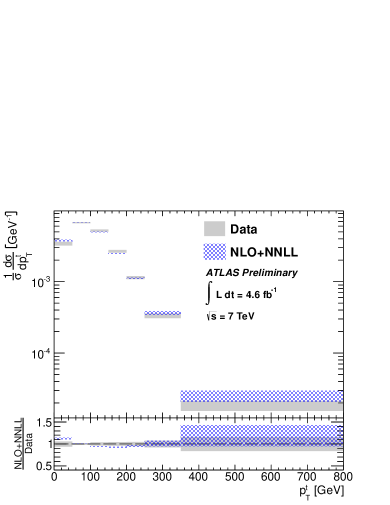
After background subtraction the distribution of the number of events is determined as a function of kinematic variables: the of the individual top quark, , the mass (), the rapidity () and transverse momentum () of the system. The distributions are corrected for detector and acceptance effects (unfolded) to the full parton phase space, normalized to their integral (the total measured cross section) and the the corresponding normalized differential cross section are extracted. An example for is shown in fig. 4 illustrating the data-prediction comparison for the reconstructed distribution and the comparison of the unfolded result to the approximate NNLO prediction. The final normalized differential cross sections are obtained by combining the results in the and in the samples
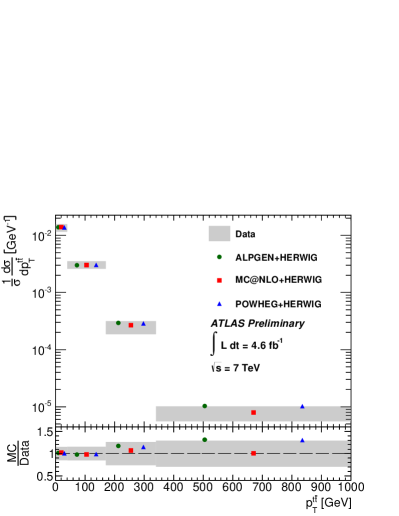
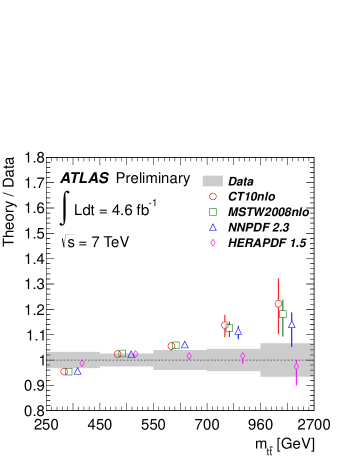
using a minimum covariance estimator including correlations. Systematic uncertainties are propagated through the unfolding corrections by modifying the migration matrix and acceptances while keeping the data fixed in the measurement. The results are dominated by systematic uncertainties varying from 2% to 20% depending on the bin and the observable. The highlights of a large number of comparisons with predictions produced with NLO and LO generators matched to parton showers and NLO and approximate NNLO calculations are shown in fig. 5. The analyses show potential sensitivity to differences in predictions and in choices of parton distribution functions (PDFs): the figure on the left indicates a qualitative tendency to measure smaller cross sections at higher values compared to most predictions, while the figure on the right shows a qualitative preference of the data for the HERA-based PDF.
5 Single top quark production cross section
5.1 Inclusive single top t-channel cross section at = 7 and 8 TeV
Single top quark production was initially observed in the -channel with an integrated luminosity of 1.04 collected at = 7 TeV [13] by requiring events with one isolated high central lepton ( or ), exactly two or three jets within a large pseudorapidity range () resulting from the -quark, and the accompanying jet(s) and large and from the leptonic boson decay. The dominant and backgrounds are obtained from simulation while the fake lepton contribution is derived by data-driven techniques. The value of the t-channel single top quark production cross section, , is obtained using a binned maximum likelihood fit to the distributions of the output of a neural network (NN) encapsulating the properties of 12 and 18 kinematic variables in two- and three-jet event samples, respectively. The resulting is consistent with the SM prediction and its uncertainty (24% relative precision) is dominated by systematic effects, particularly by initial and final state radiation ( 9 %) and jet energy scale ( 7%). The value of the CKM matrix element relating the measured and the predicted SM -channel cross sections is found to be .
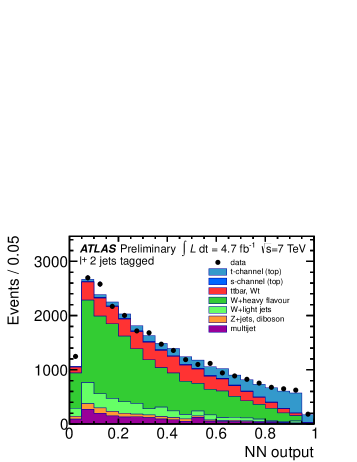
Using the full dataset collected by ATLAS at = 7 TeV, the separate production cross sections for single top and single antitop are obtained [14] by using the fit to the same NN output distribution, but for samples containing negative and positive leptons, respectively. An example of data-prediction comparison for the NN ouput distribution is shown in fig. 6 (left) for events with positive leptons. The results are and . They are consistent with the SM predictions and have a relative precision of 20% and 25% respectively, dominated again by jet-related systematic uncertainties. The cross section ratio = /
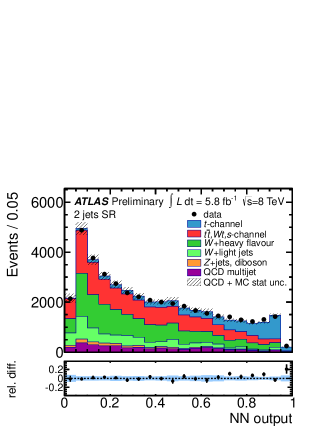
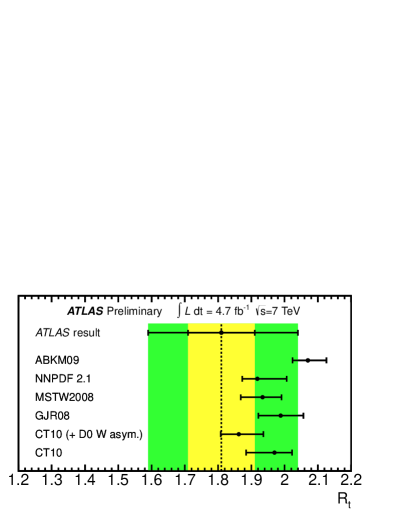
(sensitive to the ratio of the -quark to -quark PDFs) is also fitted by including correlation effects to provide a reduced uncertainty value The uncertainty on is dominated by systematic effects (from higher order radiation modelling and experimental jet-related effects) as one can observe in fig. 6 (right): the measured value is compared to predictions using different NLO PDFs and its statistical uncertainty, the spread of the predictions and their uncertainties are of the same order of magnitude. Finally the same strategy as was used at = 7 TeV is exploited to select inclusive -channel events in a dataset of Ldt = 5.8 collected at = 8 TeV [15] and to estimate the corresponding backgrounds. The corresponding value and the background normalizations are derived with a binned maximum likelihood fit to the distribution of an NN output (shown in fig. 7) in two- and three-jet samples. The NN exploits 11 kinematic variables to measure . With a relative uncertainty of 19%, the result is still dominated by radiation and jet energy scale (JES) systematic uncertainties. The value of is found to be and if is required to be smaller than unity, it is found that at 95% confidence level.
5.2 Inclusive single top quark Wt-channel cross section at = 8 TeV
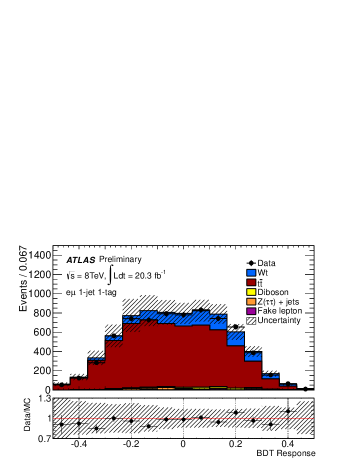
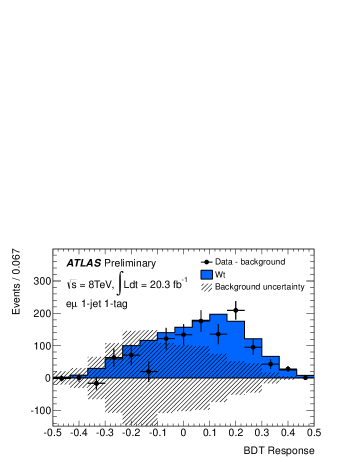
The full dataset at = 8 TeV is used to recognize -single top quark production [16]. Events are selected by requiring an opposite sign - pair with one or two high central jets and at least one -tagged jet. The dominant background is estimated from simulation like the small diboson and contributions, while fake leptons are derived with a matrix-method data-driven technique. The cross section, and the background normalizations are derived using a binned maximum likelihood fit to the distributions of the outputs of Boosted Decision Trees (BDT) trained with 19 and 20 kinematic variables in samples with one and two-jets, respectively. Fig. 8 shows the data-prediction comparison for the BDT output distribution (left) and the background-subtracted result (right). The latter shows a clear enhancement due to events standing out above the overall background uncertainty. The resulting provides a 4.2 standard deviation evidence for single top quark production. The relative uncertainty of 22% is dominated by systematic effects relative to the generator and hadronization models. The uncertainties related to -tagging and two JES components are constrained by the data with a profile-likelihood approach.
The value of the CKM matrix element is found to be , clearly consistent with the = 7 and 8 TeV results reported in sect. 5.1. If is required to be smaller than unity, it is found that at 95% confidence level.
5.3 Single top production cross section summary
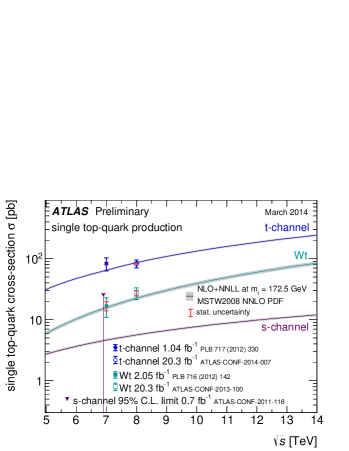
ATLAS has been measuring single top quark production cross sections at both = 7 TeV and = 8 TeV. As summarized in fig. 9, all the results are consistent with SM predictions calculated at approximate NNLO [9]. The -channel production is observed and is measured with a relative uncertainty ranging between 19% and 25%. There is evidence for -channel production with measured with 20% to 30% relative uncertainty. An upper limit at 95% confidence level is placed on -channel production cross section using 0.7 of the full 4.7 at = 7 TeV. Using about 5.8 of integrated luminosity collected at = 8 TeV ATLAS also contributes to the first LHC combination to derive [17] with an improved relative precision of 14%.
6 Conclusions
The study of top quark production in ATLAS is in full swing thanks to the combined high quality performance of both the detector and the LHC: a very rich programme is well under way. By exploiting the large dataset delivered by the LHC, ATLAS is testing top quark strong and electroweak inclusive production at an unprecedented precision level. Consistency with the SM predictions is observed for all measurements of top quark strong and electroweak production that use data collected by ATLAS in LHC proton-proton collisions at = 7 and 8 TeV corresponding to integrated luminosities of up to about 4.7 and 20 , respectively. The relative uncertainty is as low as 4.8% compared to 4% relative uncertainty for the latest NNLO+NNLL predictions. The relative uncertainties for and are 19% and 25% respectively. There is still room for improvement for the observation of -channel single top quark events, so far only searched for by using a fraction of the data available at = 7 TeV. Differential cross section measurements provide major SM tests in a completely new phase space and complement new physics searches with 10%-20% relative uncertainties, presently only using the full dataset at = 7 TeV. Updated results are expected for both inclusive and differential cross sections using the full datasets at = 7 and 8 TeV. The uncharted kinematic phase space to be explored in LHC Run 2, starting in spring 2015, will allow further improvement of these results by exploiting the nearly tripled top quark production cross sections to perform higher precision inclusive, exclusive and differential cross section measurements.
References
- [1] \BYL. Evans \atqueP. Bryant (editors) \INJINST3 S080012008.
- [2] \BYATLAS Collaboration \INJINST3 S080032008.
-
[3]
\BYM. Czakon, P. Fiedler and A. Mitov \INPhys. Rev. Lett.1102013252004 [arXiv:
1303.6254 [hep-ph]]. - [4] \BYN. Kidonakis \INPhys. Rev. D 83 2011091503 [arXiv:1103.2792 [hep-ph]].
- [5] \BYN. Kidonakis \INPhys. Rev. D822010054018 [arXiv:1005.4451 [hep-ph]].
- [6] \BYN. Kidonakis \INPhys. Rev. D812010054028 [arXiv:1001.5034 [hep-ph]].
- [7] \BYATLAS Collaboration \TITLEATLAS-CONF-2013-097, https://cds.cern.ch/record/1600596
-
[8]
\BYATLAS Collaboration \TITLEHistoric
versions of tt_xsec_7TeV from the ATLAS Top physics group,
https://atlas.web.cern.ch/Atlas/GROUPS/PHYSICS/CombinedSummaryPlots/
TOP/tt_xsec_7TeV/history.html -
[9]
\BYATLAS Collaboration \TITLESummary plots
from ATLAS group, https://atlas.web.cern.ch/
Atlas/GROUPS/PHYSICS/CombinedSummaryPlots/TOP/ - [10] \BYATLAS and CMS Collaborations \TITLECMS-PAS-TOP-12-003, ATLAS-CONF-2012-134, https://cds.cern.ch/record/1478422
- [11] \BYATLAS Collaboration \INPhys. Rev. D892014072012 [arXiv:1304.6386 [hep-ph]].
- [12] \BYATLAS Collaboration \TITLEATLAS-CONF-2013-099 , http://cds.cern.ch/record/1600778
- [13] \BYATLAS Collaboration \INPhys. Lett. B7172012330, [arXiv:1205.3130 [hep-ex]].
- [14] \BYATLAS Collaboration \TITLEATLAS-CONF-2012-056, http://cds.cern.ch/record/1453783
- [15] \BYATLAS Collaboration \TITLEATLAS-CONF-2012-132, http://cds.cern.ch/record/1478371
- [16] \BYATLAS Collaboration \TITLEATLAS-CONF-2013-100, http://cds.cern.ch/record/1600799
- [17] \BYATLAS and CMS Collaborations \TITLECMS-PAS-TOP-12-002, ATLAS-CONF-2013-098, http://cds.cern.ch/record/1601029