Low-temperature structural investigations of the frustrated quantum antiferromagnets Cs2Cu(Cl4-xBrx)
Abstract
Powder X-ray diffraction (PXRD) and single-crystal neutron scattering were used to study in detail the structural properties of the Cs2Cu(Cl4-xBrx) series, good realizations of layered triangular antiferromagnets. Detailed temperature-dependent PXRD reveal a pronounced anisotropy of the thermal expansion for the three different crystal directions of the orthorhombic structure without any structural phase transition down to 20 K. Remarkably, the anisotropy of the thermal expansion varies for different , leading to distinct changes of the geometry of the local Cu environment as a function of temperature and composition. The refinement of the atomic positions confirms that for and 2, the Br atoms occupy distinct halogen sites in the [CuX4]-tetrahedra (X = Cl, Br). The precise structure data are used to calculate the magnetic exchange couplings using density functional methods for . We observe a pronounced temperature dependence of the calculated magnetic exchange couplings, reflected in the strong sensitivity of the magnetic exchange couplings on structural details. These calculations are in good agreement with the experimentally established values for Cs2CuCl4 if one takes the low-temperature structure data as a starting point.
pacs:
61.05.C- 75.10.Jm 75.50.EeI Introduction
Cs2CuCl4 and Cs2CuBr4 are experimental realizations of two-dimensional triangular-lattice spin- Heisenberg antiferromagnets which have been intensively studied in recent years due to their unconventional magnetic properties at low temperatures. Despite their structural similarities, Cs2CuCl4 shows a pronounced spin-liquid behavior at low magnetic fields as well as a Bose-Einstein condensation of magnons at a critical field,Coldea et al. (2001, 2002, 2003); Radu et al. (2005) whereas Cs2CuBr4 has localized magnetic excitations with well-defined plateaus in the magnetization. Ono et al. (2003, 2005) This situation indicates that the magnetic properties are highly sensitive to small details of the crystal structure, which, so far, has been established only at room temperature. Bailleul et al. (1991); Morosin and C (1960)
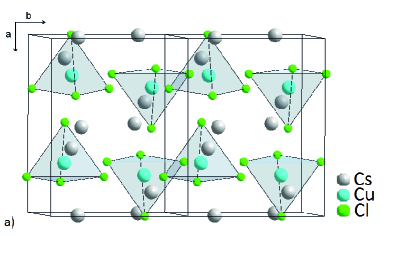
The important magnetic units in these systems are Jahn-Teller distorted (CuX4)-tetrahedra (X = Cl, Br) which are arranged in layers separated by the alkali atoms. A deep understanding of the relationship between crystal structure and electronic and magnetic behavior in the series Cs2Cu(Cl4-xBrx) requires a detailed structural analysis as a function of and temperature. Therefore, we started the crystal growth of the mixed system Cs2Cu(Cl4-xBrx) with a systematic substitution of Cl by Br for . It was shown that the orthorhombic structure type () characterized by triangular-lattice spin--layers can be obtained from aqueous solution over the whole range of if the growth temperature is above C. Krüger et al. (2010) The magnetic properties and sterical considerations suggested distinct magnetic regimes through a site-selective substitution of the Br atoms on the three different crystallographic halogen positions. Krüger et al. (2010); Cong et al. (2011) However, up to now no direct structural evidence for such a scenario has been given and the detailed crystal structures at low temperature have not been available except the lattice parameters for . Coldea et al. (2001, 2002)
The purpose of the present work is to gain detailed information on the structural properties of Cs2Cu(Cl4-xBrx) at low temperatures by means of X-ray and neutron diffraction experiments. In particular, we are specially interested in identifying any structural phase transition that might occur upon lowering the temperature as the orthorhombic structure was found to be metastable for .Krüger et al. (2010) Furthermore, we determine accurately the crystal structure parameters for , , , and . In addition, we perform density functional theory (DFT) calculations using the identified crystal structures and investigate the various superexchange couplings between Cu spins. In previous DFT calculations it was demonstrated that the superexchange couplings sensitively depend on fine structural details of the local Cu environment given by the [CuX4]-tetrahedra (X denotes the halogen atom, Cl or Br). Foyevtsova et al. (2011) This indicates that even in the absence of a structural phase transition, magnetic interactions in Cs2Cu(Cl4-xBrx) might be strongly modified by temperature-induced structural variations. One of the main findings of the present study is that the latter effect is indeed strong in Cs2CuCl4, and the DFT calculations with the correct low-temperature crystal structure can reproduce the experimental coupling constants.
The paper is organized in the following way: In Sec. II we provide experimental details of the crystal growth and the structural characterization. The low-temperature PRXD data of the Cs2Cu(Cl4-xBrx) mixed system are presented in Sec. III, followed by a detailed structural analysis of the local Cu environment in Sec. IV. Finally, we discuss the temperature dependence of the spin superexchange coupling constants of Cs2CuCl4 in Sec. V by performing DFT calculations using the 300 and 20 K crystallographic data, followed by our conclusions.
II Experimental Details
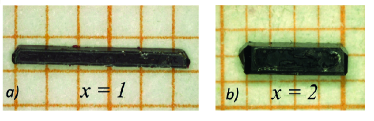
The Cs2Cu(Cl4-xBrx) crystals with an orthorhombic structure were grown from aqueous solution at C with the evaporation method. Krüger et al. (2010) Typical crystals for and are shown in Fig. 1, their growth time lasts around two months.
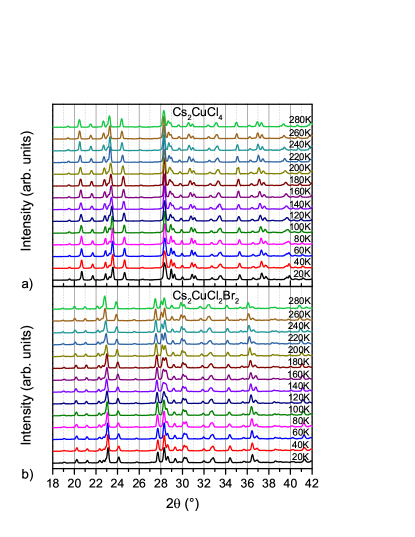
For the low-temperature powder X-ray diffraction (PXRD) a Siemens D500 diffractometer with Cu-radiation was used. Cooling of the powder was realized with a closed-cycle helium refrigerator. The measurements were started at 280 K followed by subsequent cooling in 20 K steps down to 20 K (see Fig. 2). At each temperature, , the sample holder with the powder was thermalized, prior to the measurement scan, employing an in-situ temperature controller. Each powder sample was obtained by milling one single crystal and mixing it with powder of silicon. The latter was used as an internal standard for the temperature dependent correction of the zero shift and the displacement of the powder. Structural parameters were refined from the PXRD data using the GSAS Suite of Rietveld programs. Larson and von Dreele (2000) The determination of the low-temperature structure was done for four different concentrations with nominal values of . Microprobe analysis confirmed that these nominal values are close to the actual ones (see Ref. Krüger et al., 2010).
The measurements of the uniaxial thermal expansion coefficient , where denotes the sample length, were conducted by employing a high-resolution capacitive dilatometer with a maximum resolution of , built after Ref. Pott and Schefzyk, 1983.
Neutron scattering experiments at 300 K were carried out for one single crystal with at the 4-circle-diffractometer HEIDI at the FRM II. A full sphere up to was measured with a neutron wavelength of Å (in total 1940 reflexes). The neutron data was refined using the software Jana2006. Petricek et al. (2014)
III Low-temperature structural characterization
PXRD was measured and analyzed from 280 to 20 K for selected members of the Cs2Cu(Cl4-xBrx) series. Besides the end members ( and 4), the compositions Cs2CuCl3Br1 and Cs2CuCl2Br2 were chosen for a detailed structural characterization, because for these compounds a partially ordered distribution of the halogen components with respect to the different crystallographic positions was suggested. Cong et al. (2011) The complete PXRD data for two of the four different concentrations are shown in Fig. 2. These data clearly indicate that the orthorhombic structure () of the crystals remains stable down to 20 K without any indication for a structural phase transition between 280 and 20 K. The high quality of these data allows for a detailed analysis of the structural parameters as function of temperature.
| Cs2CuCl4 | Cs2CuCl3Br1 | Cs2CuCl2Br2 | Cs2CuBr4 | |||||||||
| (Å) | 9.675(3) | 9.819(7) | 9.948(5) | 10.069(7) | ||||||||
| (Å) | 7.496(2) | 7.552(5) | 7.633(3) | 7.839(5) | ||||||||
| (Å) | 12.264(3) | 12.408(1) | 12.560(2) | 12.758(1) | ||||||||
| Atom | ||||||||||||
| Cs | 0.132(3) | 0.25 | 0.102(3) | 0.131(1) | 0.25 | 0.101(1) | 0.128(1) | 0.25 | 0.097(1) | 0.124(1) | 0.25 | 0.106(1) |
| Cs | 0.502(3) | 0.25 | 0.824(3) | 0.510(1) | 0.25 | 0.816(1) | 0.510(1) | 0.25 | 0.826(1) | 0.496(1) | 0.25 | 0.831(1) |
| Cu | 0.221(8) | 0.25 | 0.410(7) | 0.234(4) | 0.25 | 0.410(3) | 0.243(3) | 0.25 | 0.421(3) | 0.224(4) | 0.25 | 0.411(3) |
| Cl1 | 0.332(1) | 0.25 | 0.575(1) | 0.317(4) | 0.25 | 0.589(4) | - | - | - | - | - | - |
| Cl2 | -0.008(1) | 0.25 | 0.381(1) | - | - | - | - | - | - | - | - | - |
| Cl3 | 0.298(1) | -0.032(1) | 0.357(1) | 0.288(6) | 0.006(6) | 0.357(3) | 0.291(3) | -0.001(4) | 0.352(3) | - | - | - |
| Br1 | - | - | - | - | - | - | 0.345(2) | 0.25 | 0.580(2) | 0.343(2) | 0.25 | 0.585(2) |
| Br2 | - | - | - | -0.008(2) | 0.25 | 0.384(2) | -0.011(2) | 0.25 | 0.374(1) | -0.006(2) | 0.25 | 0.377(2) |
| Br3 | - | - | - | - | - | - | - | - | - | 0.298(1) | -0.013(3) | 0.357(1) |
| 3.20 | 3.12 | 2.95 | 2.91 | |||||||||
| wRp | 0.095 | 0.098 | 0.087 | 0.085 | ||||||||
| Rp | 0.072 | 0.069 | 0.062 | 0.065 | ||||||||
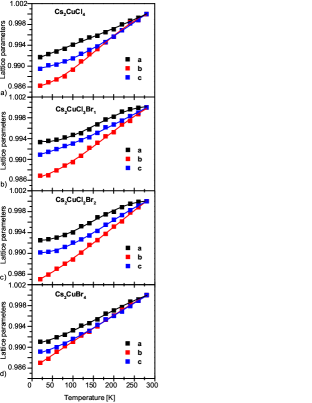
From the temperature-dependent PXRD data in Fig. 2 we derived the lattice parameters . The variation of these parameters with temperature is shown in Fig. 3 by plotting the data normalized to their values at 280 K, . The -dependence of the lattice parameters was fitted with a third-order polynomial function, because inflection points are apparent. These polynomial functions are later used to determine the coefficients of the thermal expansion and are shown as solid lines in Fig. 3. It is obvious from this figure that is anisotropic and changes drastically with increasing . For , is linear in temperature down to 20 K, which markedly changes for and 2. For this trend is reversed, since for we observe a strong deviation from a linear- dependence while as increases this dependence becomes more linear. The overall anisotropy of the normalized lattice parameters at 20 K is small for , but larger for , due to a larger and a smaller value. This is a further indication for a selective occupation of the halogen positions by Cl and Br as will be discussed in more detail in Sec. IV. Another reason for the pronounced anisotropy of the -dependence of the lattice parameters could be related to the fact that for the orthorhombic crystal structure is metastable, meaning that a structurally different polymorph exists, which is energetically more stable. This was explicitly shown for , where a tetragonal crystal structure () forms, when the crystals are grown from aqueous solution at lower temperatures. Krüger et al. (2010) Also for , we have found a tetragonal variant of Cs2CuCl4, if the crystal growth is carried out at C. Krüger et al. (2010); van Well (2014) For , the smaller anisotropy of indicates a more stable crystal structure, and indeed no different polymorph is known to exist so far for Cs2CuBr4.
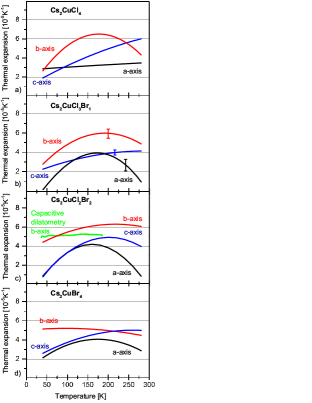
The coefficients of the linear thermal expansion, , are determined by taking the derivative of the normalized lattice parameters with respect to , i.e.,
We approximated these coefficients by using the fitted third-order polynomial function for in Fig. 3. As a consequence the accuracy at the high- and low-temperature ends (20 and 280 K) is limited. The -dependence of these calculated coefficients are shown in Fig. 4 for the four different concentrations. Representative error bars are shown in Fig. 4b, which are estimated from the deviation of the polynomial function from the data points in Fig. 3. In Fig. 4 the above discussed anisotropy is even more visible. For , a pronounced maximum at around 170 K is apparent for the -axis (Fig. 4a), whereas the coefficient for the -axis is nearly constant. Going to (Fig. 4b), the largest change appears for the -direction, where a broad maximum is observed above 150 K. We attribute this strongly anisotropic change to a preferred occupation of the Br-atoms on the X2-site, which is the crystallographic site pointing along the -direction of the tetrahedron (cf. Fig. 5), because statistically distributed Br over the three different lattice sites would probably lead to similar changes for the three thermal expansion coefficients. Fig. 4c presents the data for , here the most obvious change compared to the sample appears along the -direction. Also this behavior is in agreement with the site-selective occupation, because for , the X1-site is occupied by the Br-atoms, which is the crystallographic site along the -direction of the tetrahedron (cf. Fig. 5). Finally, in Fig. 4d the coefficients of the thermal expansion are shown for Cs2CuBr4 with an overall reduced anisotropy.
For Cs2CuCl4, we can compare our data with thermal expansion coefficients, reported in the literature (Fig. 3 in Ref. Tylczynski et al., 1992). These dilatometry data (not shown) were measured using a push-rod method Tylczynski et al. (1992) and the agreement with our data is satisfactorily good. Particularly, a broad maximum for the -direction ( in the notation of Ref. Tylczynski et al., 1992) was observed around 180 K in accordance with our results in Fig. 4a. In addition, we determined the thermal expansion coefficent for Cs2CuCl2Br2 along the -axis using capacitive dilatometry. Within the errors, this data is in agreement with the results from PXRD as shown in Fig. 4c.
| Neutron data | |||
| Atom | |||
| Cs | 0.13132(16) | 0.25 | 0.10183(13) |
| Cs | 0.49383(15) | 0.25 | 0.82403(11) |
| Cu | 0.23164(9) | 0.25 | 0.41767(7) |
| Cl1 | 0.34222(9) | 0.25 | 0.57575(8) |
| Br2 | 0.00292(10) | 0.25 | 0.38095(8) |
| Cl3 | 0.29338(7) | 0.01202(7) | 0.35627(6) |
| GOF | 1.29 | ||
| PXRD data | |||
| Atom | |||
| Cs | 0.132(1) | 0.25 | 0.098(1) |
| Cs | 0.510(1) | 0.25 | 0.826(1) |
| Cu | 0.221(3) | 0.25 | 0.425(3) |
| Cl1 | 0.337(4) | 0.25 | 0.562(4) |
| Br2 | -0.005(2) | 0.25 | 0.377(1) |
| Cl3 | 0.291(3) | 0.003(5) | 0.367(3) |
| GOF | 3.54 | ||
| Cs2CuCl4 | Cs2CuCl3Br1 | Cs2CuCl2Br2 | Cs2CuBr4 | |
|---|---|---|---|---|
| (Cu-X3-X3) , 280 K | 151.9 | 152.9 | 159.3 | 155.8 |
| (Cu-X3-X3) , 20 K | 154.9 | 155.1 | 152.8 | 153.9 |
| d(Cu-X3) (Å), 280 K | 2.204(8) | 2.121(4) | 2.312(3) | 2.307(4) |
| d(Cu-X3) (Å), 20 K | 2.336(8) | 2.032(4) | 2.154(3) | 2.300(4) |
| d(X3-X3) (Å), 280 K | 3.721(1) | 3.871(6) | 3.423(3) | 3.746(4) |
| d(X3-X3) (Å), 20 K | 3.262(1) | 3.865(6) | 3.799(3) | 3.721(4) |
| d(Cu-X3-X3-Cu) (Å), 280 K | 8.129(11) | 8.113(8) | 8.047(5) | 8.360(6) |
| d(Cu-X3-X3-Cu) (Å), 20 K | 7.934(11) | 7.929(8) | 8.107(5) | 8.321(6) |
IV Analysis of the [CuX4]-tetrahedra
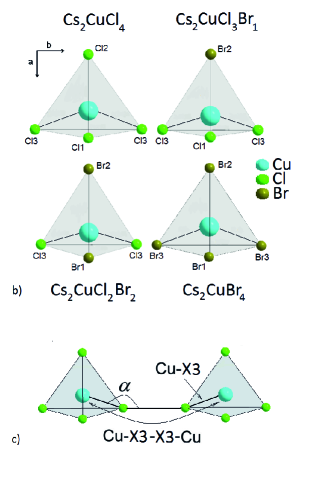
The structurally most important unit for the magnetic exchange interactions in these materials is the [CuX4]-tetrahedron (X = Cl, Br) which determines the local environment of Cu (see Fig. 5a). In this section we will analyze the form of the tetrahedron in more detail for the different compositions of Cs2Cu(Cl4-xBrx) with , refined from the low-temperature PXRD data. One important finding of our structural analysis is the site-selective occupation of the Br-atoms on the three different halogen sites, illustrated in Fig. 5b. This is already apparent from the development of the lattice parameters with , shown in the first lines of Table 1. Going from to 1, the largest relative change occurs along the -direction, whereas the relative change of is much smaller. Going from to 2, the smallest increase is again for the -direction, but much larger for and . The opposite is observed from to 4, here the largest increase is found for the -direction, but much smaller relative changes of the and -direction. Looking at the corners of the tetrahedron and its location within the crystal structure, it is clear that the X1-site will have the strongest influence for the -parameter (front corner), the X2-site for (top corner), and the X3-sites for (side corners) of the orthorhombic crystal structure as depicted in Fig. 5b. Similar behavior was observed in the room-temperature PXRD data in Ref. Krüger et al., 2010.
The atomic positions refined from the PXRD data at 20 K are summarized in Table 1. In a first attempt, a random distribution of the Cl and Br atoms was supposed for and 2. However, with this configuration it was not possible to get a reasonable agreement between the measured and simulated data. Therefore, in a second step, an ordered model with Br atoms on the X2 site for the Cs2CuCl3Br1 compound and with the Br atoms on the X1 and X2 site for Cs2CuCl2Br2 was assumed, as indicated from the development of the lattice parameters discussed above. With such a configuration, good agreement could be achieved with much lower values. Furthermore, no peculiarities were observed in the isotropic displacement parameters for the different atomic positions. Therefore, in Table 1 we have split the halogen positions for Cl and Br. However, within the resolution of our PXRD data we cannot completely rule out some Cl-Br site-disorder in these compounds. From several measurements on different powdered crystals we estimate an upper boundary of this site-disorder of about 10%. This means for Cs2CuCl2Br2 that at most every Br-atom might sit on a X3 site. We like to note that for crystals grown directly from the melt at around C (Bridgman-method), we could not observe this site-selective occupation of the Br-atoms, but only a random distribution of the halogen atoms on the three different crystallographic positions. van Well (2014) To confirm our extended temperature-dependent PXRD measurements, we carried out neutron diffraction on a single crystal with dimensions of mm3 of Cs2CuCl3Br1 (cf. Table 2). Obviously, the positions of the atoms could be refined with higher resolution compared to the PXRD data as shown in Table 2, where we compare the structural data at 300 K for both methods. More important is the fact that within the given errors both methods reveal similar crystallographic positions. Furthermore, the selective occupation of Br on the X2 site, was also observed in the neutron data.
In Fig. 5b we present the [CuX4]-tetrahedra for the four different Br-concentrations determined from the PXRD data at 20 K. The tetrahedra for and 4 are distorted due to the Jahn-Teller effect, which is well established in these materials. On top of the Jahn-Teller distortion, the site-selective occupation of the Br-atoms leads to an additional deformation for and 2 evident from Fig. 5b. Cs2CuCl3Br1 has the Br atom on the crystallographic X2 site, leading to a [CuCl3Br1]-tetrahedron elongated along , but compressed in its direction. Cs2CuCl2Br2 with the Br-atoms on the X1 and X2 sites presents a [CuCl2Br2]-tetrahedron stretched along and compressed along . This non-linear change with of the tetrahedra has direct consequences on the low-temperature magnetic properties of these materials, which are determined mainly by the two in-plane exchange interactions and . A first estimate of the dominant can be gained by considering the length of the superexchange path along the direction, depicted in Fig. 5c. This Cu-X3-X3-Cu distance is determined by the bonding angle and the distances Cu-X3 as well as X3-X3. These parameters are summarized in Table 3, where the non-linear development with becomes apparent, in combination with a strongly varying temperature dependence (including positive and negative -coefficients). In the last line of Table 3 the length of the spin superexchange path from Cu to Cu along the -direction at 20 K is shown. From this data one would expect a nearly unchanged value for and 1, followed by an increase of towards . This structural argument is in agreement with susceptibility data on the same type of single crystals. Cong et al. (2011) There it was shown that the maximum at around 3 K, which is primarily determined through , is nearly unchanged for , followed by a linear increase for .
In order to study the influence of these strong structural variations with and on the magnetic interactions in more detail, a more accurate calculation of the spin superexchange coupling constants using density functional methods would be insightful. In the next section, we present DFT calculations for Cs2CuCl4 with the low- structural data as input parameters and compare them with our earlier results, which were obtained from the room-temperature structure data.
V DFT-based derivation of exchange-coupling constants
To derive the spin superexchange coupling constants in Cs2CuCl4 within DFT, we employ the full-potential linearized augmented plane waves method as implemented in the WIEN2k code. Koepernik and Eschrig (1999) The exchange and correlation effects are treated within the generalized gradient approximation Perdew et al. (1996) with an additional orbital-dependent term that mimics the on-site Coulomb repulsion between the Cu 3 electrons. Eschrig et al. (2003) The coupling constants are calculated from the total energies of different Cu-spin configurations, assuming Ising-like interactions, see Foyevtsova et al. (Ref. Foyevtsova et al., 2011) for more technical details.
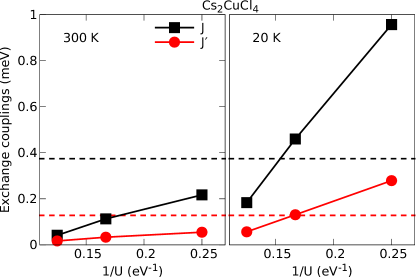
In Fig. 6, we compare the spin superexchange couplings in Cs2CuCl4 calculated using the experimental crystal structures at 300 and 20 K from the presented PXRD data. No further structural relaxation was performed within DFT. For both temperatures, the leading magnetic interactions are by far the nearest-neighbor couplings and within the triangular lattice. We calculated these two superexchange paths for three values of the on-site Coulomb repulsion and 8 eV. The realistic value is close to 6 eV ( 1/eV). The temperature dependence of and , however, is remarkable, because these couplings from the 20 K structure are by a factor of larger than those from the 300 K structure, while their ratio remains roughly unchanged. Noticeably, the exchange couplings calculated from the 20 K structure are in good agreement with experimental estimates (based on neutron scattering data at 0.3 K from Ref. Coldea et al., 2001), marked in Fig. 6 with horizontal lines of respective colors.
Comparing the structural data at 300 and 20 K, we can identify structural changes that can be responsible for such a pronounced variation of the leading exchange couplings. For instance, the interaction path between two consecutive [CuX4]-tetrahedra in the -direction is controlled by the Cu-X3-X3 angle , the Cu-X3 distance and the Cu-X3-X3-Cu path length (see Table 3). Remarkably, the variation with temperature of these particular structural parameters is significantly pronounced for Cs2CuCl4 and most probably the reason for the strong temperature dependence of and evident from Fig. 6.
VI Conclusions
We have presented a detailed low-temperature structural characterization of the triangular antiferromagnets Cs2Cu(Cl4-xBrx). Our measurements show a site-selective occupation of Br atoms on specific halogen sites, leading to a strong variation of the local Cu environment as a function of temperature and Br-concentration. The temperature-dependent experimental structure data was then used as a starting point for calculating the magnetic coupling constants using density functional methods. This joint experimental and theoretical study reveals a strong temperature dependence of the magnetic interactions in Cs2CuCl4. Such behavior is caused by both, a large sensitivity of the exchange interactions to the structural details as well as the particularly non-trivial temperature dependence of the crystal structure. We believe that considering the so far ignored role of temperature-induced variations of spin superexchange couplings in Cs2CuCl4 may improve the understanding of its magnetic properties.
Acknowledgements
The authors thank K.-D. Luther for technical assistance. We acknowledge discussions with A.-A. Haghighirad and K. Hradil. This work was supported by the Deutsche Forschungsgemeinschaft through SFB/TRR49.
References
- Coldea et al. (2001) R. Coldea, D. A. Tennant, A. M. Tsvelik, and Z. Tylczynski, Phys. Rev. Lett. 86, 1335 (2001).
- Coldea et al. (2002) R. Coldea, D. A. Tennant, K. Habicht, P. Smeibidl, C. Wolters, and Z. Tylczynski, Phys. Rev. Lett. 88, 137203 (2002).
- Coldea et al. (2003) R. Coldea, D. A. Tennant, and Z. Tylczynski, Phys. Rev. B 68, 134424 (2003).
- Radu et al. (2005) T. Radu, H. Wilhelm, V. Yushankhai, D. Kovrizhin, R. Coldea, Z. Tylczynski, T. Lühmann, and F. Steglich, Phys. Rev. Lett. 95, 127202 (2005).
- Ono et al. (2003) T. Ono, H. Tanaka, H. Aruga Katori, F. Ishikawa, H. Mitamura, and T. Goto, Phys. Rev. B 67, 104431 (2003).
- Ono et al. (2005) T. Ono, H. Tanaka, T. Nakagomi, O. Kolomiyets, H. Mitamura, F. Ishikawa, T. Goto, K. Nakajima, A. Oosawa, Y. Koike, et al., J. Phys. Soc. Jpn. 74, 135 (2005).
- Bailleul et al. (1991) S. Bailleul, D. Svoronos, P. Porcher, and A. Tomas, C. R. Hebd. Acad. Sci. 313, 1149 (1991).
- Morosin and C (1960) B. Morosin and L. E. C, Acta Crystallogr. 13, 807 (1960).
- Krüger et al. (2010) N. Krüger, S. Belz, F. Schossau, A. A. Haghighirad, P. Cong, B. Wolf, S. Gottlieb-Schoenmeyer, F. Ritter, and W. Assmus, Cryst. Growth Des. 10, 4456 (2010).
- Cong et al. (2011) P. T. Cong, B. Wolf, M. de Souza, N. Krüger, A. Haghighirad, S. Gottlieb-Schoenmeyer, F. Ritter, W. Assmus, I. Opahle, K. Foyevtsova, et al., Phys. Rev. B 83, 064425 (2011).
- Foyevtsova et al. (2011) K. Foyevtsova, I. Opahle, Y. Z. Zhang, H. Jeschke, and R. Valentí, Phys. Rev. B 83, 125126 (2011).
- Larson and von Dreele (2000) A. Larson and R. von Dreele, Los Alamos National Laboratory Report 86, 748 (2000).
- Pott and Schefzyk (1983) R. Pott and R. Schefzyk, J. Phys. E 16, 445 (1983).
- Petricek et al. (2014) V. Petricek, M. Dusek, and L. Palatinus, Z. Kristallogr. 229, 345 (2014).
- van Well (2014) N. van Well (2014), Dissertation, Goethe-University Frankfurt (2014).
- Tylczynski et al. (1992) Z. Tylczynski, P. Piskunowicz, A. N. Nasyrov, A. D. Karaev, K. T. Schodiev, and G. Gulamov, Phys. Stat. Sol. (a) 33, 133 (1992).
- Koepernik and Eschrig (1999) K. Koepernik and H. Eschrig, Phys. Rev. B 59, 1743 (1999).
- Perdew et al. (1996) J. P. Perdew, K. Burke, and M. Enzerhof, Phys. Rev. Lett. 77, 3865 (1996).
- Eschrig et al. (2003) H. Eschrig, K. Koepernik, and I. Chaplygin, J. Solid State Chem. 176, 482 (2003).