Evolution of induced earthquakes from dimensionless scaling
Abstract
Event counts are a powerful diagnostic for earthquake analysis.
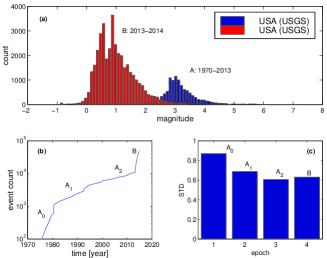
We report on a bimodal distribution of earthquake event counts in the U.S. since 2013. The new peak is about a magnitude M1 with a distribution very similar to that of induced earthquakes in Groningen, The Netherlands. The event count of the latter shows exponential growth since 2001 with a doubling time of 6.24 years at a relatively constant rate of land subsidence. We attribute this to internal shear stresses due to increased curvature. We demonstrate exponential growth as a function of dimensionless curvature in a tabletop crack formation experiment. An outcome of our model is a new method of parameter-free statistical
forecasting of induced events, that circumvents the need for a magnitude cut-off in the Gutenberg-Richter relationship.
Index terms: Induced earthquakes, crack formation, statistical forecasting, parameter-free estimation
1 Introduction
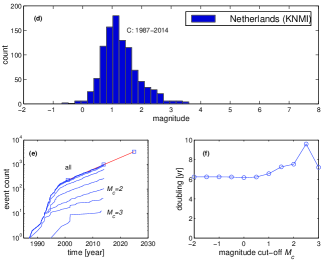
Increases in earthquake event rates are a modern phenomenon that may result from exploitation of natural energy resources or injection of waste (Rayleigh et al., 1976; Nicholson & Wesson, 1990; Frolich, 2012; Evans et al., 2012). These increases appear as discontinuities in event count rates in excess over historical trends in seismic activity. In the period 2001-2012, the central and eastern United States experienced an excess of over 300 events with magnitude greater than 3.0 above what would be expected based on natural seismic activity alone (Ellsworth, 2013). Fig. 1 shows what appears to be a similar increase in event rates in The Netherlands, generally attributed to the exploitation of the Groningen gas field.
Although induced earthquakes tend to be moderate in magnitude on average, they can, by their increasing frequency, act as physical stressors producing gradual degradation of the structural integrity of homes and buildings. These events can become endemic, when acting as a psychological stressor to a local population. Due to the earthquakes in Northeast Groningen, half of the inhabitants are now living with a feeling of anxiety or fear and wish to move out (De Kam, 2014). Most likely, the psychological impact caused by earthquakes is strengthened by their stochastic nature (Fonteyne et al., 2009; Grillon et al., 2004). With a population of about half a million inhabitants, the ubiquity of earthquakes in Groningen is currently a topic of considerable concern for the development of ameliorating policies (e.g. De Waard (2014)). However, ensuring safety of the population and preventing further damage to buildings by reducing earthquake events is challenging in view of the uncertainties in statistical forecasting (Nicholson & Wesson, 1990; Bakun et al., 2005; NAM, 2013a).
The Groningen gas field is monitored for reservoir pressure, subsidence and yearly production of natural gas covering an area of about 900 km2 (NAM, 2013a). Since 2001, the present trend in earthquake event counts is essentially exponential, shown by the red line in the cumulative event count in Fig. 1. (In case of exponential growth, cumulate event counts and event count rates both appear linearly on a logarithmic scale.) This type of ‘clock-work’ precision is robust in persisting over a broad range of the cut-off in magnitude, here expressed on the scale of Richter, showing a doubling time of 6.24 years, slightly above a previous estimate of 5 years (Dost et al., 2013)). The Groningen field, therefore, may be showing us a principle at work with possible implications for the interpretation of earthquake surveys elsewhere.
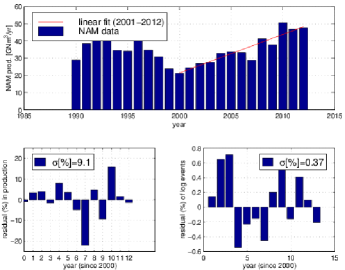
The Groningen gas field has been gradually developed over the last few decades. Fig. 2 shows the production levels of the Nederlandse Aardolie Maatschappij (NAM) in GNm3 per year from 1990-2011. As a result, reservoir pressures have steadily decreased to below 100 bar at present from about 150 bar in 2000 and starting at 350 bar at discovery in 1959. Over the last decade, the exploitation to the present level of about 50 billion Nm3 per year evolved with variations up to about 20% around a linear fit. The standard deviation of the relative variations in NAM production about this linear trend is 9.4%. There is no discernible correlation between the small fluctuations in the logarithm of the event counts to production.
Quite generally, earthquakes can be induced by reduction in well pressure or raising shear stresses (Hubbert & Rubey, 1959). They may occur at some distance away from industrial activity and with a considerable delay in time. Reviewed in (Ellsworth, 2013), Paradox Valley, Colorado, shows events at over ten kilometers away from injection wells with delays of well over a decade. The Salton Sea Geothermal Field shows, after some delay following the starting date of exploitation, a remarkable correlation of induced seismicity with net extracted volume of a few times m3 per month at a depth of about 1-2.5 km, defined as extracted minus injected fluid volume (Brodsky & Laipote, 2013). These observations suggest that induced seismic activity is associated with large area deformations measured in subsidence.
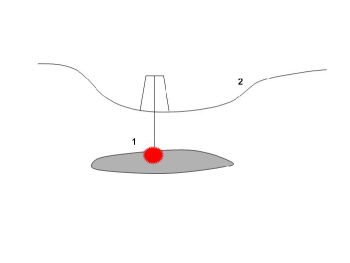
The observed subsidence of 0.5 to 2 cm per year in the Groningen area is a delayed response to the volumetric reduction in a gradual compactification in the reservoir (NAM, 2013a). The associated volume reduction m-3 per month is, within one order of magnitude, quantitatively similar to that in the Salton Sea Geothermal Field. Soil subsidence reflects a perturbation of internal stresses on large scales, particularly shear stresses associated with curvature induced strain, that may reach critical values for material failure or slip, e.g., as described by the Mohr-Coulomb law (Coulomb, 1976; Hubbert & Rubey, 1959). In the Groningen area, subsidence is presently taking the shape of a shallow bowl with a radius 15 km with a current depth of about 30 cm ((NAM, 2013a), schematically illustrated in Fig. 3 below). Relative to the radius of curvature, , it presents a dimensionless curvature .
Here, we present a physical mechanism for exponential growth in event counts from subsidence, resulting from curvature induced strain. The model gives a derivation of the associated Gutenberg-Richter relationship for statistical forecasting of the expected and maximum magnitude of events. We will apply our model to the Groningen data for a forecast up to 2025.
2 Exponential growth from large scale deformations
In the absence of discontinuities in cracks and slides, small perturbations in internal stress scale linearly with strain induced at a well. Strain then satisfies a linear elliptical equation, since propagation times of sound waves are negligible on the length scales of interest. The solution is determined by boundary conditions at the surface, where the tangential surface stress vanishes with pressure equilibration to ambient pressure. At the depth of the reservoir, e.g., 3 km in Groningen, the strain and pressure gradients are maximal at the well. In the presence of subsidence, the internal stresses are hereby a solution to a moving boundary problem. For relatively small variations in subsidence , these stresses hereby scale linearly with subsidence over the bulk of a region of volume , where is the length scale of the reservoir.
For arbitrary perturbations, however, the problem is nonlinear since internal shear stresses are susceptible to sudden discontinuities when exceeding a critical value , commonly described by the Mohr-Coulomb law of slippage. is dimensionless, representing a critical ratio . A large scale deformation, may be detected in subsidence . As a moving boundary, effectively tracks the evolution of internal shear stresses (Fig. 3). Earthquakes are triggered when , in the energetic release of stresses.
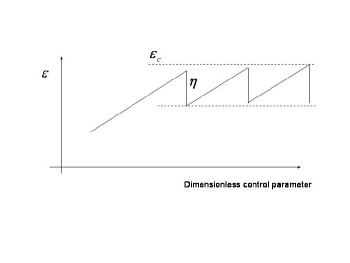
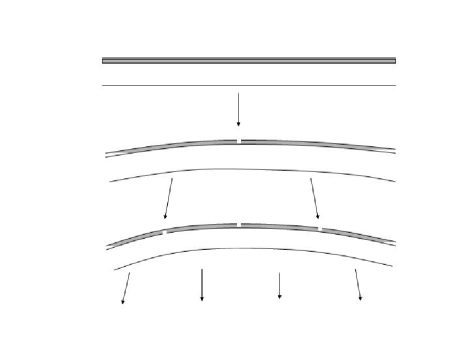
A sudden crack or slide partitions a region into two. It is followed by a relaxation , , that determines the strain after the crack comes to a halt in a sub-critical but stressed state. If subsidence continues, strain increases again, possibly back up to from . In approaching once more, regions in the new partition crack or slice into two once again. Effectively, the time-evolving strain is restricted to the range (Fig. 4)
| (1) |
A persistent increase in large scale deformation introduces a continuously growing dimensionless curvature, , as may be observed in subsidence and the association formation of a shallow bowl. The induced strain hereby extends over the macroscopic length scale and approximately uniformly so. The resulting evolution of partitions subject to (1), therefore, is one of exponential growth (Fig. 5)
| (2) |
between event counts, where is a material dependent dimensionless constant.
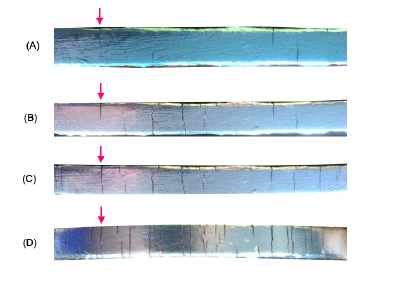
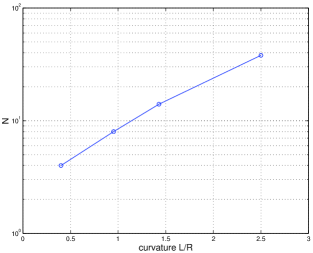
Fig. 6 shows a tabletop demonstration of exponential growth in cracks. Here, shear stresses in excess of are made visible in cracks in aluminum foil glued to a flexible substrate as a function of the dimensionless curvature , where 20 cm is the length of the bar and is the radius of curvature. The experiment demonstrates exponentiation in cracks driven by large scale deformations, here parametrized by curvature. In the field, large scale land deformations are commonly parametrized by subsidence with associated curvature evident in bowl shape indentation centered around the well.
The above scaling argument for exponential growth in the number of cracks or slides with land deformation is based on the dimensionless critical parameters and with no reference to an internal scale of length, area or volume. Exponentiation of earthquake number is hereby independent of dimension, by which our one dimensional experiment is meaningful also in three dimensions such as microfracturing experiments (Scholz, 1968).
The observed subsidence rate in the Groningen field is remarkably constant in time (NAM, 2013a). According to our mechanism, the number cracks or slides grows exponentially with subsidence. At a constant rate of the latter, the number of earthquakes hereby evolves exponentially in time, which accounts for the observed trend in the Groningen event count since 2001 (Fig. 1).
Our model describes a correlation between event counts and observed curvature, but does not address the problem of time delay, between the activity at the well and the evolution of subsidence. Time delays are notoriously varied in different locations, and their origin remains somewhat mysterious especially when delays are long, e.g., decades. In case of the Groningen gas field, we were not able to constrain or determine the time delay, given a complete lack of correlation between gas exploitation and event counts.
3 Parameter-free matching of the magnitude distribution
We next consider an earthquake event to be the sudden release of energy in a cluster of essentially contemporaneous events. In this case, the magnitude of the event is naturally attributed to the largest (with the largest ) in the cluster (cf. the composite source model of (Frankel, 1991)).
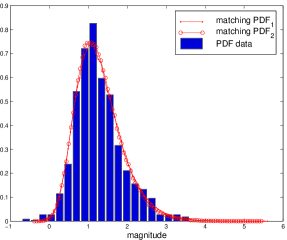
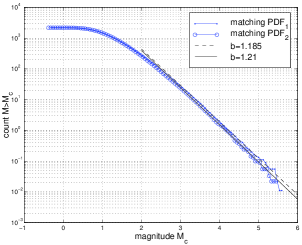
The distribution of maxima in large samples of an underlying normal distribution of has an intrinsic positive skewness, e.g., by a Monte Carlo simulation (cf. Fig. 3 in (van Putten et al., 2014)), which accurately matches in the observed distribution of the Groningen earthquake events in Fig. 1. The distribution of these maxima can be matched the observed distribution, here by matching their standard deviations. Fig. 4 shows two matching distributions of maxima of clusters of tries taken from normal distributions of . The matching distributions have exponential decay in the limit of large magnitude with a canonical Gutenberg-Richter value around 1 (Ishimoto & Lida, 1939; Gutenberg & Richter, 1944, 1954; Schorlemmer et al., 2005). Our mechanism obtains a value of shown in Fig. 7.
Our matching probability density functions (PDF) reproduce the mean and standard deviation of the PDF of the survey of observed magnitudes, not to a selected tail of magnitudes beyond a choice of cut-off. This procedure removes the cut-off as a free parameter, and ensures stability in estimating the tail at large magnitudes, which would otherwise be notoriously uncertain due to small number statistics.
4 Summary and outlook
We report on a bimodal distribution of events in the US since 2013, where the new peak around magnitude M1 is very similar to the distribution of induced events in the Groningen field. Most likely, the new peak in the US is of anthropogenic origin.
The induced events in The Netherlands reveal an exponential growth rate with a doubling time of 6.24 years and . In light of the observed formation of a shallow bowl due to a persistent rate of subsidence, we explain this result by an exponential relation in the number of cracks or slides as a function of dimensionless curvature, setting the leading order shape of the as a moving boundary in the elliptic problem for the internal strains in and around the reservoir. A slow large scale creep, delayed relative to production, is consistent with a striking lack of a correlation of yearly subsidence with gas production and reservoir pressure. The origin of the slow creep, however, remains mysterious.
The PDF of earthquake magnitudes has a positive skewness which is well approximated by the distribution of maxima in clusters of events, taken as large samples from a normal distribution. In taking into account the full survey data, this estimate produces a value with a relatively moderate variation of about 10%, somewhat tighter than obtainable by Gutenberg-Richter fits to low event counts in tails beyond a magnitude cut-off (e.g (Dost et al., 2013)). The exponential tail in the limit of large magnitude combined with the anticipation additional 2200 events up to 2025 points to events likely up to magnitude 4.2 but unlikely reaching magnitude 5.
The accurate fit of our model PDF to the data is perhaps surprising in light of the completeness problem in earthquake surveys, whereby the observed event counts represent a lower bound on the true event counts. Equivalently, the effective surface area of large events is larger than that of small events. However, events in the Groningen area are limited to a region limited within km2. It appears that the Groningen survey is rather complete for events around M1. The new peak B about M1 in the distribution of events in the US is a positive detection based on an overwhelmingly large number of events, where only the details of the event counts may be affected by finite completeness in the ANSSI Comprehensive catalogue.
Our analysis shows a mixed message: the number of earthquakes is rapidly increasing with the potential for significant continuing exposure to gradual degrading of the integrity of buildings and homes, even as the magnitude of earthquakes probably remains below 5. The regional impact is primarily economical and political and increasingly endemic as a psychological stressor on the local population, even as immediate risk to injury or death remains small. The lack of any correlation between gas exploitation and event rate points to a significant delay time, perhaps well over a decade, which challenges the formulation of effective policies and strategies to ameliorate this outlook in the immediate future.
The exponential growth highlighted in Groningen may be typical, since there appear to be similar epochs also in the large scale counts of seismic activity in the United States. Particularly striking are the events in group emerging suddenly in 2013. Although its exceptional growth remains to be determined in the coming years, its distribution already shows remarkable similarity to the Groningen field with a similar outlook, in regions where it overlaps with populated areas (cf. (van Eck et al., 2006; Peterson et al., 2008)).
We propose that an accurate hazard analysis of exposure of populated areas to induced earthquakes takes into account the exponential growth in event counts and the relatively high frequency spectrum of induced motions, as they fall in the range of eigenfrequencies of around 0.1-25 Hz of homes and buildings. For instance, the Fourier spectrum of induced events at the Hellisheidi Geothermal Powerplang in Iceland (Halldorsson et al., 2012) peaks at 10 Hz. This frequency is high compared to earthquakes of tectonic origin. It can be attributed to the relatively larger magnitude of the latter (Fig. 1) according to the scaling of frequency with magnitude (Aki, 1967; Bune, 1970; Kanamori & Anderson, 1975; Anderson, 2003; Aki & Richards, 1980). Frequent small magnitude events can hereby be disproportionally hazardous to homes and buildings over time.
5 Acknowledgments.
The first author thanks Tae Woong Chung for stimulating discussions.
6 Data and Resources
USGS data in Fig. 1 are obtained from the ANSS Comprehensive Catalogue at http://earthquake.usgs.gov/earthquakes/search/ (last accessed October 15 2014). ANSS Data were downloaded on October 15 2014 using the following search parameters in the USGS online portal: Magnitude: (minimum,maximum)=(-1,10), Depth: (minimum,maximum)=(-1,4) km, Geographic Region: (South,North)=(25,50), (West,East)=(-125,-65). Multiple time intervals were used to cover 1974-2014 because of the total number of 48747 events. The Supplementary material provides a complete list of ANSS data (ANSS-Table.pdf), a video clip of the magnitude histogram as a function of time (US500.mpg4) and the USGS search parameters (USGS-input.pdf).
KMNI data in Fig. 1 are obtained from http://www.knmi.nl/seismologie/aardbevingen-nederland.html (last accessed February 13 2014). Data were extracted from http://www.knmi.nl/seismologie/geinduceerde-bevingen-nl on February 13 2014.
NAM data in Fig. 2 are obtained from NAM Production profielen (2012-2036) at NL Olie en Gasportaal, http://www.nlog.nl/nl/home/NLOGPortal.html (last accessed May 13 2014) and extracted from www.nlog.nl/oil/oilGas/grafiek-productie-profielen-2013-2037-PUBLIC.xls on February 13 2014.
References
- Aki (1967) Aki, K. (1967), Scaling law of seismic spectra, J. Geophys. Res., 72, 1217-31
- Aki & Richards (1980) Aki, K., & Richards, P.G.,1980, Quantitative Seismology, Theory and Methods (W.H. Freeman and Co. San Francisco)
- Anderson (2003) Anderson, J.G., 2003, in Int. Handbook of Earthquake & Engineering Seismology, Part 2, W.H.K. Lee, H. Kanamori, P. Jennings an C. Kisslinger (eds.), Ch. 57, p937
- Bakun et al. (2005) Bakun, W.H., Aagaard, B., Dost, B., Ellsworth, W.L., Hardebeck, J.L., Harris, R.A., et al. (2005), Implications for prediction and hazard assessment from the 2004 Parkfield earthquake, Nature, 437, 969
- Brodsky & Laipote (2013) Brodsky, E.E., & Lajpote, L.J. (2013), Salton Sea Geothermal Field Anthropogenic Seismicity Rates and Operational Parameters at the Salton Sea Geothermal Field, Science, 1239213
- Bune (1970) Bune, J.N. (1970), Tectonic stress and the spectra of seismic shear waves from earthquakes, J. Geophys. Res., 75, 4997-5009; ibid. Correction, 76, 5002
- Coulomb (1976) Coulomb, C. A. (1776), Essai sur une application des règles des maximis et minimis à quelques problàmes de statique relatifs à l’architecture, Mem. Acad. Roy. Div. Sav., 7, 343-87
- De Kam (2014) De Kam, 2014, http://www.rug.nl/news-and-events/news/archief2014/nieuwsberichten/angst-voor-aardbevingen-onder-inwoners-aardbevingsgebied-sterk-gestegen?lang=en
- De Waard (2014) De Waard, P. (2014) De Volkskrant, January 14
- Dost et al. (2013) Dost, B., Caccavale, M., van Eck, T. & Kraaijpoel (2013), KNMI Report on expected PGV and PGA values for induced earthquakes
- Grillon et al. (2004) Grillon, C., Baas, J. P., Lissek, S., Smith, K., Milstein, J. (2004), Anxious responses to predictable and unpredictable aversive events, Behav. Neuroscience, 118, 916-24
- Gutenberg & Richter (1944) Gutenberg, B., & Richter, C.F. (1944), Frequency of earthquakes in California, Bull. Seismol. Soc. Am., 34, 185-88
- Gutenberg & Richter (1954) Gutenberg, B., & Richter, C.F., 1954, Seismicity of the Earth and Associated Phenomena (Princeton, N.J.: Princeton University Press)
- Ellsworth (2013) Ellsworth, W.L. (2013), Induced earthquakes, Science, 341, 1225942
- Evans et al. (2012) Evans, K.F., Zappone, A., Kraft, T., Deichmann, N., & Moia, F. (2012), A survey of the induced seismic responses to fluid injection in geothermal and CO2 reservoirs in Europe, Geothermics, 41, 30-54
- Fonteyne et al. (2009) Fonteyne, R., Vervliet, B., Hermans, D., Baeyens, F., & Vansteenwegen, D., (2009), Reducing chronic anxiety by making the threatening event predictable: An experimental approach, Behav. Res. and Therapy, 47, 830-39
- Frankel (1991) Frankel, A. J. (1991), High-frequency spectral falloff of strength of faults, Geophys. Res., 96, 6291-6302
- Frolich (2012) Frohlich, C. (2012), Two-year survey comparing earthquake activity and injection-well locations in the Barnett Shale, Texas, PNAS, 109, 12934-38
- Halldorsson et al. (2012) Halldorsson, B., Ólafsson, S., Snaebjörnsson, J.Th., Sigurosson, S.U., Rupakhety, R., & Sigbjörnsson, R., (2012), On the Effects of Induced Earthquakes due to Fluid Injection at Hellisheidi Geothermal Power Plant, Iceland, in Proc. 15th WCEE, Lissabon, Portugal
- Hubbert & Rubey (1959) Hubbert, M.K., & Rubey, W.W. (1959), Role of fluid pressure in mechanics of overthrust faulting, Geol. Surv. Bull, 70, 115
- Ishimoto & Lida (1939) Ishimoto, M., & Lida, K., (1939), Observations sur les ssmesenregistr par le microsismographe construit dermement, Bull. Earthquake Res. Inst., Tokyo Univ., 17, 443-78
- Kanamori & Anderson (1975) Kanamori, H., & Anderson, L. (1975), Theoretical basis of some empirical relations in seismology, Bull. Seismol. Soc. Am. , 65, 1073-95
- NAM (2013a) Nederlandse Aardolie Maatschappij (NAM) (2013), Technical Addendum to the Winningsplan Groningen, Subsidence, Induced Earthquakes and Seismic Hazard Analysis in the Groningen Field, http://www.rijksoverheid.nl/documenten-en-publicaties/rapporten/2014/01/17/bijlage-1-analyse-over-verzakkingen-geinduceerde-aardbevingen-en-seismische-risico-s.html
- Nicholson & Wesson (1990) Nicholson, C., & Wesson, R.L. (1990), Earthquake hazard associated with deep well injection, US Geol. Surv. Bull., 1951 pubs.usgs.gov/bul/1951/report.pdf
- Peterson et al. (2008) Peterson, M.D., Frankel, A.D., Harmsen, S.C., Mueller, C.S., Haller, K.M., Wheeler, R.L., et al. (2008), US Geol. Surv. Open-File Rep., 2008-1128
- Rayleigh et al. (1976) Rayleigh, C.B., Healy, J.H., & Bredehoeft (1976), An experiment in earthquake control at Rangely, Colorado, Science, 191, 1230-37
- Scholz (1968) Scholz, C.H. (1968), The frequency-magnitude relation of microfracturing in rock and its relation to earthquakes, Bull. Seismol. Soc. Am., 58, 399-415
- Schorlemmer et al. (2005) Schorlemmer, D., Wiemer, S., & Wyss, M. (2005), Variations in earthquake-size distribution across different stress regimes, Nature, 437, 539-542
- van Eck et al. (2006) van Eck, T., Goutbeek, F., & Haak, H., & Dost, B. (2006), Seismic hazard due to small-magnitude, shallow-source, induced earthquakes in The Netherlands Eng. Geol., 87, 105-121
- van Putten et al. (2014) van Putten, M.H.P.M., Guidorzi, C., & Frontera, P., (2014), Broad band turbulent spectra in gamma-ray burst light curves, ApJ, 786, 146-151, Fig. 3