Suzaku Monitoring of Hard X-ray Emission from Carinae over a Single Binary Orbital Cycle
Abstract
The Suzaku X-ray observatory monitored the supermassive binary system Carinae 10 times during the whole 5.5 year orbital cycle between 20052011. This series of observations presents the first long-term monitoring of this enigmatic system in the extremely hard X-ray band between 1540 keV. During most of the orbit, the 1525 keV emission varied similarly to the 210 keV emission, indicating an origin in the hard energy tail of the kT 4 keV wind-wind collision (WWC) plasma. However, the 1525 keV emission declined only by a factor of 3 around periastron when the 210 keV emission dropped by two orders of magnitude due probably to an eclipse of the WWC plasma. The observed minimum in the 1525 keV emission occurred after the 210 keV flux had already recovered by a factor of 3. This may mean that the WWC activity was strong, but hidden behind the thick primary stellar wind during the eclipse. The 2540 keV flux was rather constant through the orbital cycle, at the level measured with INTEGRAL in 2004. This result may suggest a connection of this flux component to the -ray source detected in this field. The Helium-like Fe line complex at 6.7 keV became strongly distorted toward periastron as seen in the previous cycle. The 59 keV spectra can be reproduced well with a two-component spectral model, which includes plasma in collision equilibrium (CE) and a plasma in non-equilibrium ionization (NEI) with 1011 cm-3 s-1. The NEI plasma increases in importance toward periastron.
1 Introduction
Most massive stars are found in binary systems (Chini et al., 2012; Sana et al., 2012). When the companion is an early type star, the collision of their stellar winds (wind-wind collision: WWC) produces strong shocks and thermalizes gas to tens of millions of degrees Kelvin. This hot gas emits X-rays, which are a good probe of the wind nature and interaction mechanism. The shocks can also accelerate electrons to GeV energies, which produce radio synchrotron emission (e.g., Pittard & Dougherty, 2006). These non-thermal electrons are also suspected to up-scatter UV emission from the stars through the inverse-Compton process to X-ray (and higher) energies.
Eta Carinae (2.3 kpc, Smith, 2006) is a nearby example of an extremely massive binary system with energetic WWC activity (Corcoran et al., 1997; Damineli et al., 1997; Ishibashi et al., 1999). The primary star is suspected to have had an initial mass of 100 M⊙ (see Davidson & Humphreys, 1997; Hillier et al., 2001) and is currently in the poorly understood Luminous Blue Variable (LBV) stage. Since a series of eruptions between 18381890, the two stars have been enshrouded by bipolar ejecta called the Homunculus Nebula (HN), but their highly eccentric orbit (0.9) with a period of 5.54 years can be measured from periodic variations at various wavelengths (Corcoran, 2005; Damineli et al., 2008). The companion star has not been detected directly, but it is believed to be an O supergiant or WN star (Verner et al., 2005). The primary star has a thick slow wind with 420 km s-1 and 8.510-4 M⊙ yr-1 (Groh et al., 2012), while the secondary star has a thin fast wind with 3000 km s-1 and 10-5 M⊙ yr-1 (Pittard & Corcoran, 2002).
The WWC of Car produces luminous X-ray emission from hot plasma up to kT 4 keV, which has been observed mostly in the 210 keV band. The emission increases inversely-proportional to the stellar separation, as suggested by WWC theory (Stevens et al., 1992). However, the X-ray flux suddenly drops to a minimum level (Corcoran et al., 2010) after reaching a maximum brightness. Detailed studies (Hamaguchi et al., 2007a, 2014) revealed two distinct phases during the X-ray minimum — the deep X-ray minimum, which has the lowest observed flux level and lasts approximately three weeks, and the shallow X-ray minimum, where the emission abruptly increases three-fold from the deep minimum level. The deep minimum is probably produced by an eclipse of the WWC apex by the primary stellar body or wind, while the shallow minimum probably indicates the intrinsic decline of the WWC activity (Hamaguchi et al., 2014).
| Abbr | Obs ID | Time | NP | XIS | HXD | ||||
|---|---|---|---|---|---|---|---|---|---|
| Date | Exp | Sensor | SCI | Exp | Epoch | ||||
| (ksec) | (ksec) | ||||||||
| SUZ050829 | 100012010 | 2005 08 29 | 1.389 | XIS | 49.8 | 0123 | off | 56.0 | 1 |
| SUZ060203 | 100045010 | 2006 02 03 | 1.468 | XIS | 21.4 | 0123 | off | 18.1 | 1 |
| SUZ070623 | 402039010 | 2007 06 23 | 1.717 | HXD | 54.7 | 013 | on | 51.6 | 3 |
| SUZ080610 | 403035010 | 2008 06 10 | 1.891 | HXD | 35.5 | 013 | on | 27.2 | 4 |
| SUZ081210 | 403036010 | 2008 12 10 | 1.982 | HXD | 48.5 | 013 | on | 42.4 | 5 |
| SUZ090125 | 403037010 | 2009 01 25 | 2.005 | HXD | 28.8 | 013 | on | 17.5 | 5 |
| SUZ090215 | 403038010 | 2009 02 15 | 2.015 | HXD | 35.6 | 013 | on | 31.1 | 5 |
| SUZ090610 | 404038010 | 2009 06 10 | 2.072 | HXD | 51.2 | 013 | on | 49.1 | 5 |
| SUZ091121 | 404039010 | 2009 11 21 | 2.153 | HXD | 49.4 | 0′13 | on | 34.3 | 6 |
| SUZ110724 | 406039010 | 2011 07 24 | 2.454 | XIS | 42.0 | 0′13 | on | 49.1 | 11 |
Note. — Abbr: Abbreviation adopted for each observation. Obs ID: Observation identification number of each observation. Time: Observation start date and orbital phase. = (observation start in Julian date 2450799.792)/2024 (Corcoran, 2005). NP: Nominal Pointing position. XIS/Exp: XIS exposure time. XIS/Sensor: XIS sensors in operation. 0′: One eighth of the XIS0 chip does not work. XIS/SCI: Spaced Charge Injection operation. HXD/Exp: HXD/PIN exposure time. HXD/Epoch: Epoch of the HXD/PIN response file.
There have been several observations of Car in the hard X-ray band above 10 keV, up to 100 keV. Viotti et al. (2002, 2004) claimed a detection of extremely hard X-ray emission from Car with the PDS instrument on BeppoSAX, but the measured flux was significantly higher than those of later measurements, so source confusion in the wide PDS field of view (1.3∘ FWHM) was suspected. Leyder et al. (2008, 2010) detected a flat power-law (12) source between 20100 keV with INTEGRAL/ISGRI. They constrained the source position to within 1.6′ of Car. Since they found no X-ray source in a Chandra image consistent with the observed spectrum above 20 keV, they identified the source as Car. Sekiguchi et al. (2009) analyzed the first two Suzaku (Mitsuda et al., 2007) observations of Car around apastron in 2005 and detected X-ray emission between 1540 keV with the HXD/PIN instrument. They showed that the spectrum below 20 keV can be reproduced by kT 4 keV plasma emission observed below 10 keV, while the spectrum above 10 keV requires a flat power-law of 1.4. These papers suggested that the power-law component may originate from the inverse-Compton up-scattering of stellar UV photons by non-thermal GeV electrons accelerated at the WWC region. On the other hand, the AGILE and Fermi -ray observatories discovered a relatively stable ray source between 0.1100 GeV (Tavani et al., 2009; Abdo et al., 2010), whose spectrum may be connected to this extremely hard X-ray source (Farnier et al., 2011; Reitberger et al., 2012).
The Suzaku observatory monitored Car 10 times between 20052011 and throughout one orbital cycle of Car. Suzaku has the lowest background in the 1540 keV band of any X-ray observatory launched before 2012, so that it gives the most reliable results on the orbital modulation of extremely hard X-ray emission from Car. It also has good sensitivity and spectral resolution between 59 keV, providing detailed profiles of the and line complexes of highly ionized Fe and Ni atoms. In this paper, we present the flux and spectral variation of Car between 540 keV with orbital phase, fit all the spectra with a consistent model, and discuss the nature of the observed emission components.
2 Observations and Analysis
2.1 Observations
Since its launch in 2005, Suzaku has observed Car fourteen times. Table 1 summarizes the former ten observations, which were performed before 2011. The first two observations were performed during the performance verification (PV) phase and their earlier result is summarized in Sekiguchi et al. (2009). The subsequent 8 observations were obtained through the guest observer program (AO-2, 3, 4, 6, PI: Kenji Hamaguchi). Individual Suzaku observations are designated SUZ, subscripted with the year, month and day of the observation.
During these observations, Suzaku ran two types of instruments: the X-ray Imaging Spectrometer (XIS, Koyama et al., 2006) in the focal plane of the thin-foil X-Ray Telescope (XRT, Serlemitsos et al., 2007) and the Hard X-ray Detector (HXD, Takahashi et al., 2007; Kokubun et al., 2007). The XIS consists of four X-ray CCD cameras, XIS03, three of which (XIS0, 2 and 3) use front-illuminated (FI) CCD chips, while one (XIS1) uses a back-illuminated (BI) chip. The FI chips have good hard X-ray sensitivity, covering 0.510 keV, while the BI chip has good soft X-ray sensitivity down to 0.3 keV. The XIS2 was fatally damaged on 2006 Nov 9 by a mirco-meteorite, so this camera was unavailable after the 3rd observation (SUZ070623). Another micro-meteorite damaged one eighth of the XIS0 imaging area in 2009, while multiple micro-meteorites probably produced small holes on optical blocking filters of all the XISs, but these did not significantly degrade the data quality. The XISs initially had good spectral resolution (FWHM 150 eV at 5.9 keV)111http://heasarc.gsfc.nasa.gov/docs/astroe/prop_tools/suzaku_td/node10.html, but the resolution has gradually degraded with age due to radiation damage, with a substantial recovery in 2006 October after initiating the Spaced Charge Injection (SCI) operation with a sacrifice of the effective imaging area. The XRT has a butterfly-shaped point spread function (PSF) with half power diameter (HPD) of 2′. The effective area decreases as the off-axis angle increases, due to mirror vignetting. The HXD consists of two types of detectors, the PIN with sensitivity between 1570 keV and the GSO between 40600 keV. The GSO did not detect any significant signal above the non-X-ray background (NXB) level, so we only used the PIN detector. The PIN detector has a collimator with a 34′34′ fov, on the bottom of which are PIN Si diodes. The depletion voltage to the diodes has been reduced gradually to mitigate the increase of detector noise, so that the detection efficiency has gradually decreased since launch.
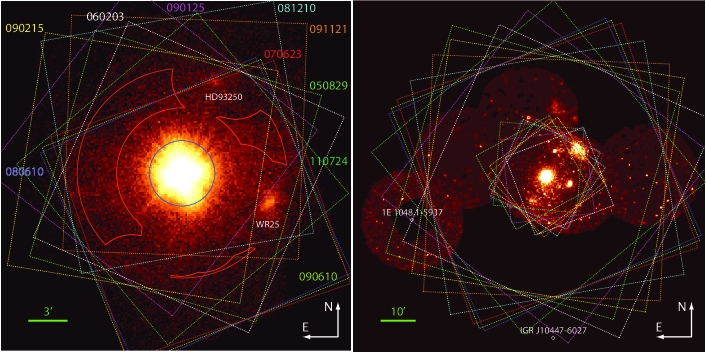
The Suzaku point source observations have two default pointing positions — the XIS nominal position, which puts the main target at the XRT+XIS focus, and the HXD nominal position, which maximizes the HXD collimator opening to the target. The HXD nominal position is at 3.5′ off-centered from the XIS nominal position. In the PV observations, Car was placed at the XIS nominal position partly for instrument calibration. In AO-2, 3 and 4, we placed Car at the HXD nominal position to maximize the HXD/PIN sensitivity to the star. In AO-6, we put again Car at the XIS nominal position because a failure of a spacecraft gyro began to affect the XIS flux measurement at the HXD nominal position. The satellite roll angles during the AO observations were optimized within the operational constraints such that contamination from the nearby high energy sources AXP 1E 1048.15937 and IGR J10447-6027 in the HXD/PIN fov are minimized (1 %, see the right panel of Figure 1). Only the HXD/PIN observation in SUZ050829 included 5% of the emission from 1E 1048.15937.
All the XIS observations were operated with the normal mode (no window option) because the count rates of Car for each XIS are 7 cnts s-1, a factor of 2 below the threshold of significant photon pile-up. However, the XIS pileup estimator (Yamada et al., 2012) derived small pile-up for relatively high count rate observations such as SUZ081210 (3% pileup at the PSF core). Because of this artificial effect, the XIS spectra in SUZ080610 and SUZ081210 significantly flatten above 9 keV. We therefore excluded XIS spectra of these observations above 9 keV. The XIS FI data had an anomaly at the first 9 ksec of SUZ070623, whose interval we did not analyze.
| Abbr | XIS0 | XIS3 | XIS | HXD | ||||||||
|---|---|---|---|---|---|---|---|---|---|---|---|---|
| 1525 keV | 2540 keV | |||||||||||
| CR | Nor | CR | Nor | CR | Error | CR | Error | Nor | CR | Error | Nor | |
| (cps) | (cps) | (cps) | (10-2 cps) | (10-2 cps) | ||||||||
| SUZ050829 | 0.56 | 1.00 | 0.56 | 1.00 | 0.558 | 0.002 | 2.70 | 0.36 | 1.00 | 0.60 | 0.21 | 1.00 |
| SUZ060203 | 0.45 | 0.99 | 0.44 | 1.00 | 0.446 | 0.003 | 2.32 | 0.49 | 1.00 | 0.10 | 0.28 | 1.00 |
| SUZ070623 | 0.63 | 0.72 | 0.57 | 0.86 | 0.601 | 0.003 | 2.20 | 0.35 | 1.05 | 0.14 | 0.17 | 1.04 |
| SUZ080610 | 1.07 | 0.72 | 1.01 | 0.89 | 1.039 | 0.004 | 4.55 | 0.41 | 1.03 | 0.24 | 0.21 | 1.04 |
| SUZ081210 | 2.73 | 0.74 | 2.62 | 0.90 | 2.674 | 0.006 | 7.28 | 0.37 | 1.02 | 0.43 | 0.18 | 1.04 |
| SUZ090125 | 0.05 | 0.72 | 0.04 | 0.89 | 0.047 | 0.001 | 2.39 | 0.44 | 1.02 | 0.24 | 0.24 | 1.04 |
| SUZ090215 | 0.18 | 0.73 | 0.18 | 0.89 | 0.180 | 0.002 | 0.70 | 0.37 | 1.02 | 0.22 | 0.19 | 1.04 |
| SUZ090610 | 0.81 | 0.72 | 0.78 | 0.89 | 0.792 | 0.003 | 2.62 | 0.34 | 1.02 | 0.20 | 0.17 | 1.04 |
| SUZ091121 | 0.52 | 0.75 | 0.50 | 0.90 | 0.514 | 0.003 | 2.35 | 0.37 | 1.00 | 0.28 | 0.19 | 1.04 |
| SUZ110724 | 0.39 | 0.92 | 0.39 | 0.95 | 0.392 | 0.002 | 1.47 | 0.40 | 0.88 | 0.16 | 0.18 | 0.95 |
Note. — Abbr: Abbreviation adopted for each observation. XIS0/XIS3: Net XIS0/XIS3 count rate (CR) between 59 keV, normalized with the effective area ratio to SUZ050829 in the “Nor” column. XIS: Average of the XIS0 and XIS3 count rates. HXD: Net HXD/PIN count rate between 1525/2540 keV, normalized with the effective area ratio to SUZ050829 in the “Nor” columns. The contribution of the CXB and GRXE is estimated and subtracted. The 1.3% systematic error of the PIN NXB model is considered. cps: cnts s-1.
2.2 Extraction of the WWC Emission Data
In this paper, we analyze hard X-ray data above 5 keV to study the highest energy phenomena of Car. For consistent analysis, we use data only from the XIS0 and XIS3 among the XISs, both of which are FI sensors running through the Car observations. We used the HEASoft version 6.14 and the CALDB version hxd20110913, xis20130724, and xrt20110630 for the data calibration. The left panel of Figure 1 displays a 510 keV image from all the XIS3 data. The brightest source at the center is Car, the second brightest source to the west of Car is the Wolf-Rayet (WR) binary system WR 25, and the third to the north is the O4 star HD 93250. The field includes more unresolved faint point sources, but no serendipitously bright X-ray source appeared during the observations in the XIS fov.
In the XIS analysis, we defined a source region with a 2.5′ radius circle centered at Car to minimize contamination from WR 25 and HD 93250. The source region includes 90% of X-ray photons from the star. We extracted the background from an annulus with a 5′ inner radius and a 8′ outer radius centered at Car, excluding areas within 3′ from WR 25, HD 93250 and the centers of the X-ray clusters in Feigelson et al. (2011). The source region includes hard X-ray sources other than the central point source, such as X-ray reflection at the HN (Corcoran et al., 2004) and multiple young stars (e.g., Wolk et al., 2011).
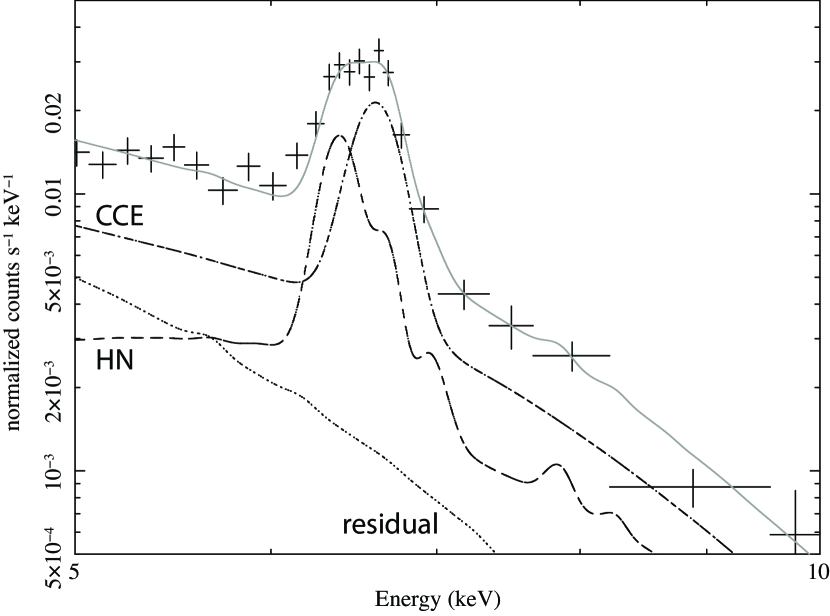
Hamaguchi et al. (2014) indicated that the WWC X-ray emission completely disappeared below 10 keV between 2009 Jan 12 and 28. The SUZ090125 observation was performed during this interval, so that the XIS spectrum should originate from the surrounding X-ray components. The known hard X-ray components other than the WWC are the stable hot X-ray plasma, possibly in the foreground wind cavity (the CCE component, Hamaguchi et al., 2007a, 2014), which accounts for 55% of the 510 keV emission, and X-ray reflection at the HN, which accounts for 33% of the 510 keV emission (Figure 2). The remaining 12% probably originates from hard X-ray point sources within the source region. The CCE component, which can be measured only during the X-ray minimum, did not vary more than 10% between 2003 and 2009 (Hamaguchi et al. in prep.), suggesting its stability over an orbital cycle. The HN reflection emission is expected to decline by a factor of 4 from periastron (around SUZ090125) to apastron (Hamaguchi et al. in prep.). In this paper, we assume that the XIS data at SUZ090125 represent the contaminating emission in all the XIS spectra. However, this assumption significantly overestimates contribution of the fluorescent iron line from the HN to the apastron spectra since the line flux around apastron is comparable to that at SUZ090125. We therefore defer the discussion of the fluorescent iron line emission to a later paper.
The HXD/PIN data include significant contamination from NXB, point sources, Galactic Ridge X-ray Emission (GRXE) and cosmic ray background (CXB). The NXB is estimated from the tuned background model with 1.3% systematic uncertainty (1) (JX-ISAS-SUZAKU-MEMO-2007-09222ftp://legacy.gsfc.nasa.gov/suzaku/data/background/pinnxb_ver2.0_tuned/). The only high-energy point source that could contaminate the HXD/PIN data is the AXP 1E 1048.15937. However, the HXD/PIN count rate of 1E 1048.15937 on 2008 Nov. 30 (Obs ID: 403005010) that excludes the NXB and the typical CXB spectrum was only 3.410-3 cnts s-1(1540 keV), which is 1/5 of the Car count rate. An extrapolation of the XIS spectrum to the HXD band accounts for only one-fifth of the detected HXD count rate: the rest probably originates from GRXE. In addition, the HXD band flux should not increase by more than a factor of two at any Suzaku observation of Car, considering a factor of 4 variation of this AXP in the soft band since 1996 (Dib & Kaspi, 2014) and no strong color variation observed from the AXPs (Enoto et al., 2010). Furthermore, 5% of this AXP emission contributes to the HXD/PIN spectra of Car. Considering all these results, contamination of this AXP, 1E 1048.15937, of the HXD spectra of Car should be negligible. The GRXE emission around Car is estimated at 1.410-11 ergs cm-2 s-1deg-2 between 320 keV (see section 5.2 in Hamaguchi et al., 2007b). This is consistent with the remaining HXD/PIN spectrum of 1E 1048.15937, assuming an absorbed thermal plasma model (apec TBabs) with kT= 10 keV and NH= 5.01022 cm-2. Since the GRXE emission is not expected to vary strongly in 30′, we use this spectrum as GRXE contamination in the HXD/PIN spectra of Car. The CXB is estimated from the typical CXB emission (Boldt, 1987), which may fluctuate by 30% from region to region (Miyaji et al., 1998). The CXB/GRXE contributions are estimated at 1.410-2/4.110-3 cnts s-1 [1525 keV] and 3.710-3/4.810-4 cnts s-1 [2540 keV], while the CCE and HN contribution should be negligible (10-3 cnts s-1 [1525 keV], 10-4 cnts s-1 [2540 keV]). The CXB and GRXE contribution is excluded from the PIN count rates and spectra as background. In the light curve analysis, we assume that the statistical noise errors are Gaussian and assume a systematic uncertainty of 1.3% in the HXD/PIN NXB model.
The detector effective areas to Car varied by up to 30% for the XIS and 12% for the HXD/PIN between the observations because of changes in observing conditions — the nominal pointing position, the XIS SCI operation and the sensitivity degradation of the PIN sensors. The efficiency variation in the spectral analysis is automatically considered with spectral responses generated with xisrmfgen and xisarfgen in the HEAsoft tools for the XIS and provided by the calibration team through the calibration database333http://heasarc.gsfc.nasa.gov/docs/heasarc/caldb/suzaku/ for the HXD. In the light curve analysis, the average efficiency in a given energy band is calculated from the generated spectral response, and the count rates of each observation are normalized at the detector efficiency at SUZ050829.
3 Result
3.1 Light curve
For each observation, we produced an XIS light curve between 59 keV and an HXD/PIN light curve between 1525 keV with 500 sec time bins. The XIS light curves at SUZ050829, SUZ081210, SUZ090610, SUZ091121, and SUZ110724 with good photon statistics reject a constant model at a confidence limit above 95%. These variations are apparently caused by small flux fluctuations on timescales of 2 ksec and not by a systematic variation on long timescales, as seen in the XMM-Newton observations in 2003 (Hamaguchi et al., 2007a). The HXD/PIN light curves at SUZ050829, SUZ060203, and SUZ070623 reject a constant model at above 95% confidence, but they did not show any apparent long-term variation, either.
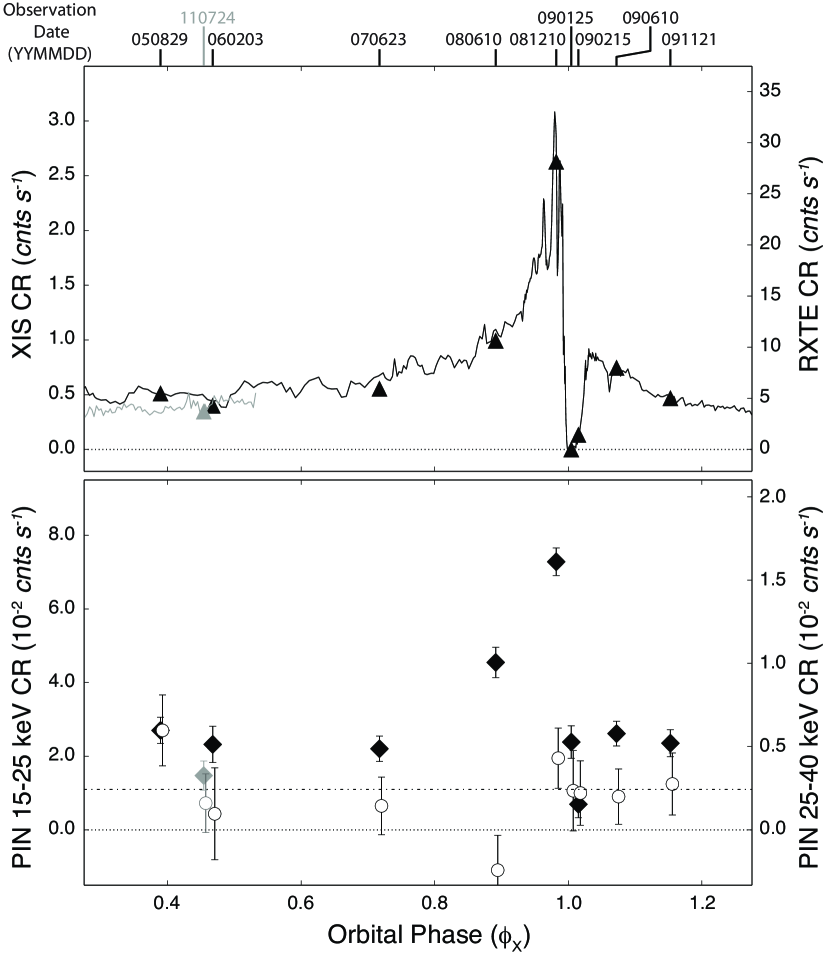
We measured from each observation the net XIS count rate between 59 keV and the net HXD/PIN count rates between 1525 keV and 2540 keV (Table 2). The top panel of Figure 3 shows the XIS light curve between 59 keV. In this plot, we subtracted the XIS count rate in SUZ090125 (0.05 cnts s-1) from XIS count rates of all the XIS observations as contamination from surrounding X-ray sources. We also compare this to the RXTE light curve after 2005 between 210 keV (Corcoran et al., 2010). The amount of contamination of X-ray sources in the RXTE fov is also estimated from the deep X-ray minimum observations (see details in Hamaguchi et al., 2014) and subtracted from the RXTE light curve. This means that both light curves should be of the WWC X-ray emission and directly comparable. Their vertical axes are scaled such that the same height gives the same energy flux in the typical Car spectrum (kT 4.5 keV, NH 51022 cm-2 and 0.8 solar). These two light curves match very well.
The bottom panel of Figure 3 shows the HXD/PIN light curves between 1525 keV and 2540 keV. Their vertical axes are scaled such that the data points at SUZ050829 overlap. The 1525 keV light curve varied similarly to the 59 keV light curve outside the minimum: it increased gradually toward periastron. This result indicates that the 1525 keV emission has the same origin as the 510 keV emission, i.e. the WWC X-rays. It, however, varied differently during the minimum. It declined only by a factor of 3 from SUZ081210 at SUZ090125 when the 59 keV flux dropped to zero. The minimum observed flux occurred during the next observation (SUZ090215) during the shallow minimum phase.
On the other hand, the 2540 keV light curve did not show any significant variation near the X-ray maximum, accepting a constant flux model (reduced 1.11 for d.o.f. = 9). We converted the 22100 keV flux of the INTEGRAL source (Leyder et al., 2008, 0.15 cnts s-1) to the HXD/PIN count rate between 2540 keV, assuming a power-law spectrum, and plotted it with a dotted line. This flux level matches quite well all the data points except SUZ050829 and SUZ080610. The result suggests that the 2540 keV emission does not originate from the WWC thermal plasma, but from the same component as the INTEGRAL source.
In summary, the light curve analysis suggests two major X-ray emission components between 540 keV: strongly variable emission below 25 keV and stable emission above 25 keV. The former component probably corresponds to the WWC thermal plasma emission and the latter to the power-law component (Leyder et al., 2008; Sekiguchi et al., 2009; Leyder et al., 2010).
3.2 Spectrum
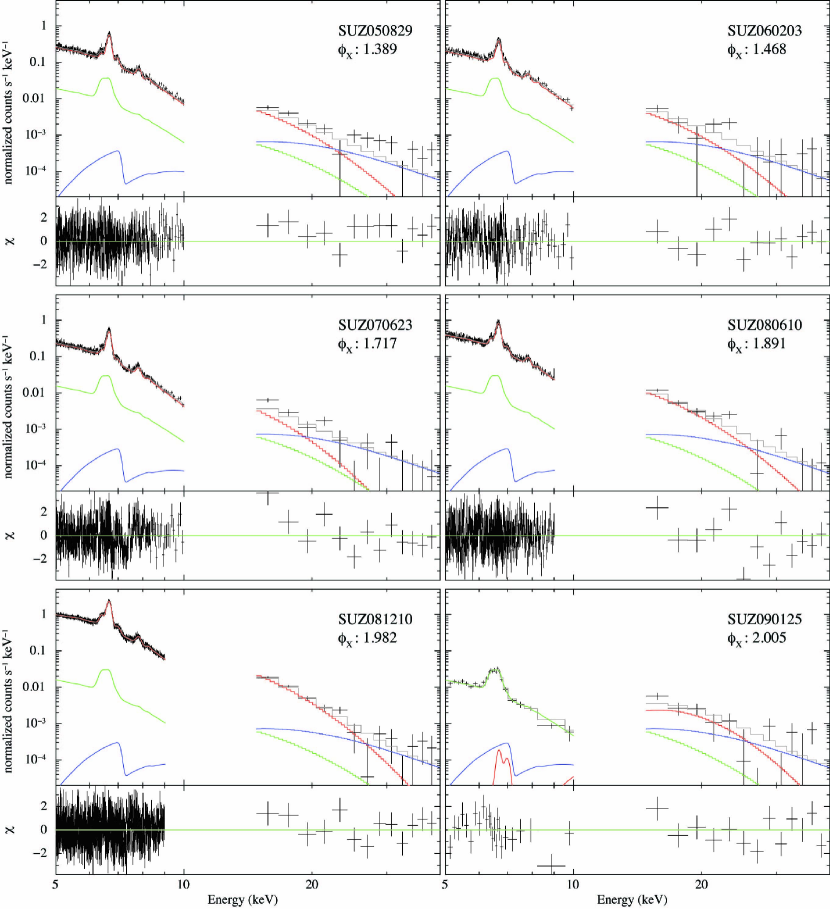
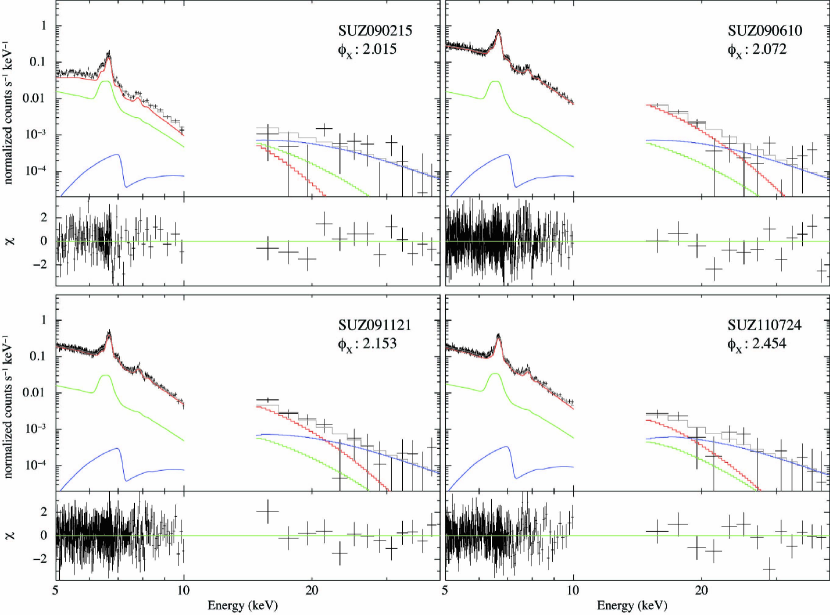
Figures 4 shows the XIS0+3 and HXD/PIN spectra of all observations. The XIS spectra varied as in the 2003 orbital cycle (Hamaguchi et al., 2007a); the hard band slope between 710 keV, which reflects the hottest temperature of the WWC plasma, did not vary significantly through the cycle. The HXD spectra below 25 keV seem to connect smoothly to the XIS hard band. The spectra above 25 keV do not show prominent features within the limited photon statistics.
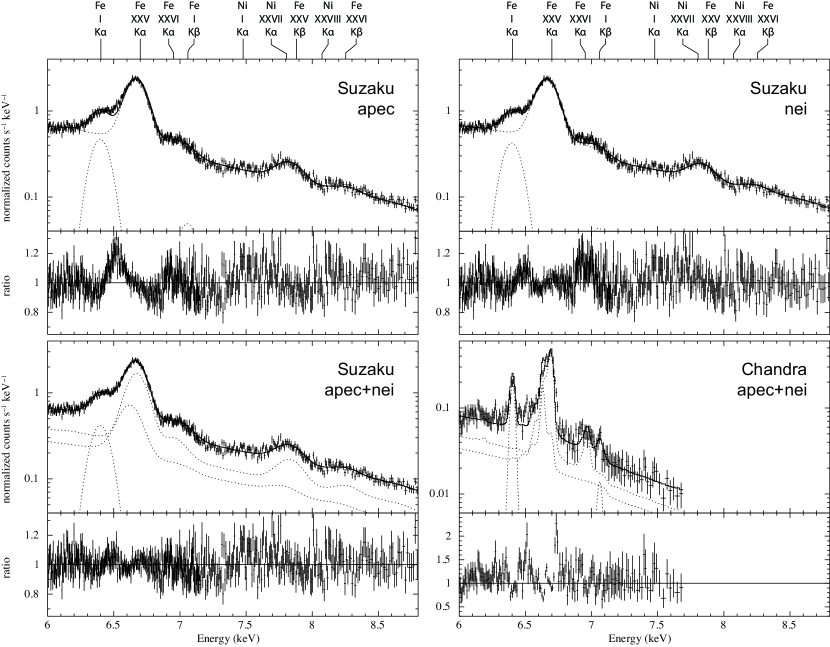
The Helium-like iron line complex at 6.7 keV distorted strongly toward the low energy side around periastron, as seen in the previous cycle (Hamaguchi et al., 2007a). To show this distortion clearly, we first fit the XIS spectrum in SUZ081210 above 5 keV by an absorbed 1 collision equilibrium (CE) plasma model (apec, top left panel of Figure 6). The spectrum also shows a fluorescent line from cold iron at 6.4 keV, for which we assume a narrow Gaussian line, based on a Chandra grating observation of Car around apastron in 2000 (Corcoran et al., 2001). We also add another narrow Gaussian line for Fe K fluorescence at 7.06 keV with the intensity tied to 12.2% of the Fe K line (Yamaguchi et al., 2014). The spectrum also shows an iron absorption edge at 7.1 keV, for which the column density of cold iron (NFe) is varied independently from the hydrogen column density (NH). The best-fit model has a strong excess at 6.5 keV, for which the 6.4 keV line is overestimated to compensate — this result suggests more emission from lowly ionized iron. A marginal enhancement between Ni I and Ni XXVII lines also support the presence of lowly ionized nickel.
However, the nei model, a non-equilibrium ionization (NEI) plasma model in xspec (NEIVERS version 3.0), does not reproduce the Hydrogen-like iron line at 6.9 keV in the spectrum (top right panel of Figure 6). This model still does not reproduce the excess at 6.5 keV. The pshock model, which considers plasma distribution in different ionization timescales in the plane parallel shock, gives a similar result. Thus, there has to be a significant amount of CE plasma emission to reproduce the Hydrogen-like lines.
We, therefore, fit this spectrum by an absorbed apec plus nei model as a testbed. The plasma temperatures of the apec and nei components cannot be independently determined and therefore are tied. Their elemental abundances are also tied together. The best-fit model reproduces the XIS spectrum well (bottom left panel of Figure 6). The excess at 6.5 keV totally disappears, while the Hydrogen-lines are reproduced well. This best-fit model also reproduces well the Chandra HETG grating spectrum obtained quasi simultaneously to SUZ081210 between 2009 Dec 813 (bottom right panel of Figure 6, Observation ID: 10831, 8930, 10827, Total exposure: 74.6 ksec, PI: Corcoran, M. F.). With a factor of 5 better spectral resolution than the XISs, the NEI component is clearly seen as a red wing of the Helium-like Fe line. The residual at the blue side of the Helium-like Fe line, which cannot be resolved with the CCD resolution, can be reproduced by a Doppler broadening of 800 km s-1.
We therefore use this model for all the spectra but SUZ090125, which does not show WWC emission below 10 keV. The spectra outside of the X-ray minimum and maximum (SUZ050829, SUZ060203, SUZ070623, SUZ091121 and SUZ110724) do not show clear distortions in the Fe line but small excesses at 6.5 keV, so that we tie their ionization parameters. The elemental abundances of all the emission components are tied together and the abundance ratios between elements above Helium are fixed at the values of the aspl solar abundance model (Asplund et al., 2009) in the XSPEC modeling. This is a reasonable approach because the hot plasma is heated by the secondary stellar winds and so is expected to reflect the elemental abundance of the secondary star, which has an unknown evolutionary status. We also assume the elemental abundance of the absorber to be solar except for iron. The absorbing material should originate from the primary star, which is depleted in hydrogen, carbon and oxygen but rich in nitrogen. However, these elements do not affect the spectral structure above 5 keV. The other high- elements are considered to be solar (Hillier et al., 2001). The absolute NH depends on the hydrogen abundance, but it can be easily adjusted for any abundance models later.
To this variable WWC model, we add an absorbed power-law model for the extremely hard X-ray component above 25 keV. The HXD/PIN spectra between 2540 keV do not have enough statistics to determine the power-law index and normalization, individually. We therefore fixed the power-law index at 1.4. The result does not change substantially for power law indices in the range 1.01.8. Since the 2540 keV light curve did not show significant flux variations, we tied the normalization of the power-law component between observations. Leyder et al. (2010) constrained the position of this power-law source to within 1.6′ from Car from the INTEGRAL observations. Since the XIS source region is within 2.5′ from Car, the XIS spectra should also include this power-law source. A simple extrapolation of this 1.01.8 power-law spectrum should show significant emission below 10 keV during the deep X-ray minimum, but neither the XIS spectrum at SUZ090125, nor any Chandra, nor XMM-Newton spectra during the minimum suggest the presence of this power-law source (Hamaguchi et al., 2014). Leyder et al. (2010) did not find any promising candidate of this counterpart other than Car in a Chandra image, either. This means that this power-law component is heavily absorbed, at least during the X-ray minimum, and cannot be seen below 10 keV. The absorption to this power-law component cannot be constrained outside the X-ray minimum. We, therefore, assume a constant absorption to this power-law component through the orbital cycle.
| Abbr | kT | E.M. [apec] | E.M. [nei] | [nei] | Flux (6.4 keV) | NH | |
|---|---|---|---|---|---|---|---|
| (keV) | (1057 cm-3) | (1057 cm-3) | (1010 cm-3 s-1) | (10-4 ph cm-2 s-1) | (1023 cm-2) | (1023 cm-2) | |
| SUZ050829 | 4.5 (4.4,4.7) | 3.9 (3.6,4.2) | 1.3 (1.0,1.4) | 6.2 (4.8,8.7) | 0.41 (0.35,0.47)† | 0.21 (0.44) | 1.2 (0.84,1.6) |
| SUZ060203 | 4.9 (4.6,5.2) | 2.6 (2.4,2.9) | 1.1 (0.8,1.4) | = | 0.20 (0.11,0.28)† | 0.0 (2.5) | 1.5 (0.89,2.2) |
| SUZ070623 | 3.3 (3.0,3.5) | 6.0 (5.0,7.2) | 3.6 (2.9,4.5) | = | 0.41 (0.34,0.48)† | 1.2 (0.79,1.6) | 1.6 (1.1,2.0) |
| SUZ080610 | 4.6 (4.3,5.0) | 6.0 (4.7,7.0) | 3.9 (3.4,4.5) | 8.2 (6.4,11.1) | 1.2 (1.1,1.3) | 0.43 (0.07,0.77) | 1.5 (1.1,1.9) |
| SUZ081210 | 3.7 (3.6,3.8) | 23.5 (22.5,25.4) | 16.5 (15.3,17.8) | 7.8 (6.6,9.6) | 5.1 (4.9,5.3) | 1.6 (1.4,1.8) | 2.2 (2.0,2.4) |
| SUZ090125 | 4.0 (fix) | 33.4 (16.7,61.9) | 82.5 (63.8,125.8) | =NH090125 | |||
| SUZ090215 | 2.3 (1.9,2.9) | 3.0 (8.3) | 6.0 (3.9,9.7) | 12.8 (9.2,17.3) | 0.54 (0.42,0.60) | 6.1 (4.6,6.8) | 4.7 (3.3,6.0) |
| SUZ090610 | 4.1 (3.8,4.4) | 2.6 (1.6,3.7) | 7.4 (6.2,8.7) | 10.5 (9.5,11.6) | 1.0 (0.90,1.1) | 1.2 (0.82,1.5) | 3.2 (2.8,3.6) |
| SUZ091121 | 4.3 (4.1,4.5) | 3.6 (3.4,4.0) | 1.7 (1.3,2.1) | = | 0.45 (0.37,0.52) | 0.67 (0.39,1.0) | 1.6 (1.1,2.1) |
| SUZ110724 | 3.8 (3.6,4.0) | 3.0 (2.8,3.3) | 1.1 (0.89,1.3) | = | 0.17 (0.10,0.23)† | 0.0 (3.1) | 0.87 (0.33,1.4) |
Note. — Spectral Model: WWC + power-law + (CCE + HN + surrounding point sources). The WWC component is a combination of the models (apec + nei + Gaussian[6.4 keV] + Gaussian[7.1 keV]) varabs, while the power-law component is powerlaw TBabs. The best-fit result of the common parameters — elemental abundance of the WWC component and normalization and absorption of the power-law component — is separately shown in Table 4. The parentheses show the 90% confidence ranges. If not specified, the model assumes the elemental abundance relative to hydrogen in the aspl solar abundance model. †These numbers should significantly underestimate the line fluxes from the WWC vicinity because this model does not consider variation of the HN reflection emission through the orbital cycle.
| Abundance | Power-Law | |
|---|---|---|
| Normalization | NH | |
| (solar) | (10-4) | (1024 cm-2) |
| 0.91 (0.85,0.98) | 3.5 (2.7,4.5) | 2.4 (1.5,3.9) |
Note. — See Table 3 for details.
The 1525 keV flux at SUZ090125 is too high for either the thermal component seen in the XIS band or the power-law component above 25 keV. We therefore assume the excess as the deeply embedded WWC emission and reproduce it with the model for the WWC thermal component. Since the statistics are limited, we fixed the plasma temperature at 4 keV, the typical temperature of the WWC plasma outside of the X-ray minima. We also tied NH and NFe of SUZ090125 because the Fe absorption edge cannot be measured. To all the spectral models, we add the best-fit model of the XIS spectrum in SUZ090125 to account for emission from the CCE, the HN and the surrounding point sources.
In this model fit, the model normalizations for the HXD/PIN spectra were multiplied by 1.15 for the XIS nominal pointing observations and 1.19 for the HXD nominal pointing observations, according to the Suzaku Data Reduction Guide444http://heasarc.gsfc.nasa.gov/docs/suzaku/analysis/abc/.
The best-fit model reproduced all the spectra very well (reduced =1.08, d.o.f =3437, Tables 3, 4 and Figure 4). The hottest plasma temperatures of the thermal WWC component are stable at kT 4 keV outside the minimum and the HXD/PIN spectra showed no signature of hotter plasma. The fit to the SUZ090215 spectrum resulted in a low plasma temperature of 2 keV, similarly to spectral fits to the shallow minimum spectra in 2003 (Hamaguchi et al., 2007a). However, kT is degenerate with NH in fits to strongly absorbed spectra, so that this variation may not suggest an actual decline in temperature of the hottest plasma. The elemental abundance of the plasma is close to solar. The NH goes down to zero for SUZ060203 and SUZ110724. However, the extrapolations of these models significantly overestimate the spectra below 5 keV; the soft band spectra suggest higher NH 351022 cm-2. The NH probably does not correctly represent the absorption column to the hot plasma because of lower temperature plasma emission important around 5 keV. On the other hand, NFe is determined from the iron edge feature and is therefore a more reliable estimator of the absorption to the hot plasma. The NFe increased toward the deep minimum and reached the maximum of 81024 cm-2 at SUZ090125. The power-law component also required a very high value of NH 21024 cm-2.
4 Discussion
4.1 Orbital Modulation of the Physical Parameters
Suzaku sampled a whole orbital cycle of Car between 2005 and 2011. Though the X-ray minimum in 2009 was significantly shorter than those in previous cycles (Corcoran et al., 2010), the latest Suzaku spectrum was very similar to that in the previous cycle, again suggesting a cyclic variation.
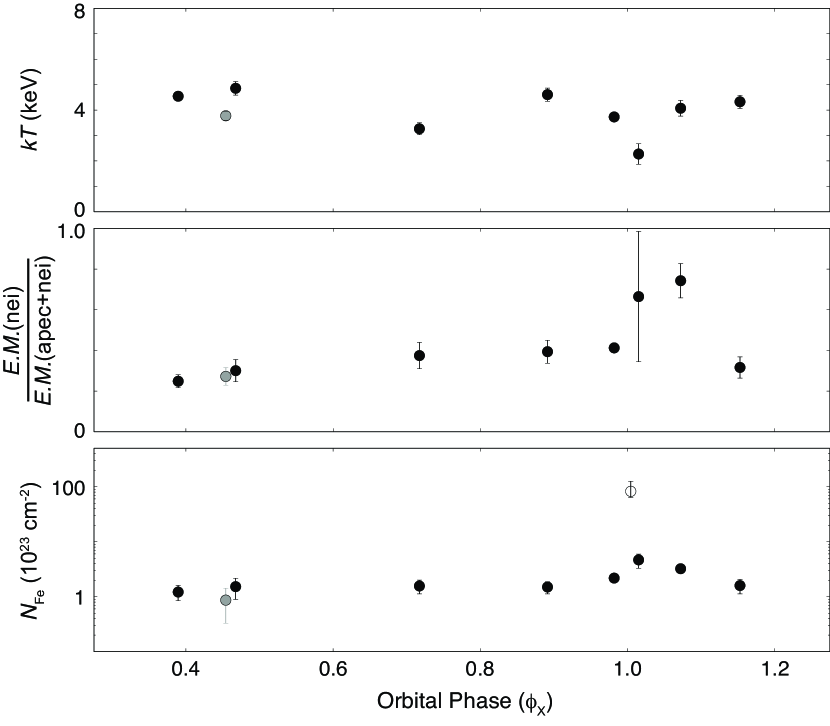
The combined fit to the XIS and HXD/PIN spectra confirmed that the hottest temperatures of the WWC plasma are stable at kT 45 keV through the orbit outside the X-ray minimum (Figure 7 top). The same conclusion was deduced by Ishibashi et al. (1999) using the RXTE data obtained between 1996 April and 1998 October and Hamaguchi et al. (2007a) using the XMM-Newton and Chandra data obtained between 2000 July and 2003 September. The new Suzaku result is important in two ways. The set of observations has a long baseline between 2005 August and 2011 July and samples the whole orbital cycle. The HXD/PIN provided the best quality measure of the extremely high energy spectra above 15 keV with a smaller fov and lower background than the RXTE Proportional Counter Array (PCA). The wide band coverage realized with the HXD provided a better measurement of the continuum slope in the very high energy range, and therefore increased the sensitivity to the hotter temperature plasma. The Suzaku results show that the plasma temperature does not change prominently outside the minimum, in line with predictions by WWC theories.
The distortion of the Helium-like Fe line was first recognized during the X-ray minimum in 2003 and discussed as caused by the NEI effect (Hamaguchi et al., 2007a). The new Suzaku result demonstrates that an NEI plasma with 0.61.31011 cm-3 s-1 can reproduce this distortion in spectral fits and this NEI plasma component can be present through the orbital cycle, with an increased ratio around periastron. The pshock model, which considers the ionization timescale distribution in a plane parallel shock, fails to reproduce the whole He-like Fe line profile. This result suggests that the plasma really has two peaks in the ionization timescale distribution at 1011 cm-3 s-1 (the NEI component) and above 1012 cm-3 s-1 (the CE component). This result probably means that the NEI plasma heats up in 1000 (108 cm-3) sec, where is the plasma density, and then quickly cools down without reaching the thermal equilibrium. The E.M. ratio of the NEI plasma increases from 25% around apastron to 75% around periastron (Figure 7 middle). The ratio is high with a large uncertainty during the shallow minimum (SUZ090215), but it is also high after the recovery (SUZ090610) as well. This result does not suggest that the ratio is correlated with the X-ray luminosity. The SUZ090610 observation is when the WWC apex is wrapped inside the primary wind, and therefore in a high density environment. The NEI plasma may quickly contact the thick cool primary wind and cool down, while the CE plasma may rapidly leave the system in the part of the shocked secondary wind which does not come into direct contact with the higher density primary wind.
The absorption column density of cold iron (NFe) increases by a factor of 24 toward periastron (Figure 7 bottom). This variation is very similar to the NH variation measured from hard band spectra above 5 keV in 2003 (Hamaguchi et al., 2007a); the absorption to the WWC apex varies periodically as well. Interestingly, the lowest NFe observed around apastron is still a factor of 23 higher than absorption to soft X-rays (451022 cm-2), though the WWC apex should be seen through the thin secondary wind. Since there is no evidence of iron overabundance in Car (e.g., Hamaguchi et al., 2007a; Hillier et al., 2001), this perhaps could be explained if the secondary wind piles up over the WWC contact surface.
4.2 High 1525 keV Flux during the Deep X-ray Minimum
The relatively strong 1525 keV emission at SUZ090125 can be reproduced by the WWC emission viewed through extremely high photoelectric absorption (NH 81024 cm-2). The Chandra spectrum obtained at the end of the X-ray eclipse on 2009 Feb 3 also suggested a very high NH of 1024 cm-2 (Hamaguchi et al., 2014), and the WWC apex should be more embedded at the middle of the X-ray eclipse. A peak NH of several1024 cm-2 during periastron is also suggested by simulations of WWC X-ray emission from Car (Parkin et al., 2011, Russell et al. in preparation). The large NH at SUZ090125 is consistent with the picture that the WWC X-ray emission peered through very thick intervening material that totally blocked X-ray emission below 10 keV. If this interpretation is correct, the intervening material would be the inner primary wind, and not the primary stellar body.
In this interpretation, the WWC activity during the deep X-ray minimum is still strong behind the absorber. The E.M. at SUZ090125 is as large as that at the maximum in SUZ081210. This is consistent with the WWC theory, in which the luminosity is inversely proportional to the distance between the two stars. However, the Compton scattering process becomes important at this absorption column. Since emission scattered off the line of sight may end up reaching us after another scattering, the amount of attenuation by the Compton scattering also depends on the shape of the surrounding intervening material. A broad-band spectrum above 10 keV at this phase with good photon statistics is required to correctly measure the amount of the Compton scattering and hence the intrinsic luminosity.
4.3 Origin of the Power-law Component
The PIN count rates between 2540 keV did not vary strongly. The -ray source, 1FGL J1045.2-5942, detected by the Fermi -ray observatory also only varied by a factor of 2 including the X-ray minimum, with a possible weak decline after the recovery (Abdo et al., 2010; Farnier et al., 2011; Reitberger et al., 2012). This result strengthens the hypothesis that the 2540 keV power-law source is connected to the Fermi -ray source (Leyder et al., 2008, 2010; Abdo et al., 2010).
In this interpretation, the power-law component originates from emission up-scattered by GeV particles accelerated at the WWC region. However, our results show that this power-law component does not change significantly around the maximum when the WWC head-on collision is the strongest and around shallow minimum when emission near the WWC apex apparently shuts off (Hamaguchi et al., 2014, and additional references therein). Our result does not suggest that the power-law component does not originate near the WWC stagnation point. It remains to be seen whether the power-law component can be reproduced by models of particle acceleration in the WWC.
To satisfy low X-ray flux below 10 keV of Car during the deep X-ray minimum, the power-law source should suffer extremely strong absorption of NH 21024 cm-2. This high NH does not favor the foreground shock region such as the CCE plasma cavity nor the HN lobe, whose extinctions are less than NH 51022 cm-2. One obvious but less interesting hypothesis is an unrelated neutron star or an active galactic nuclei behind Car, though the chance of this coincidence is not high. A provocative but more interesting hypothesis may be the presence of an active compact object associated with the binary system, which was once bound to the binary system but ejected by events such as the 1840 eruption. The flat power-law spectrum is similar to those of high-mass X-ray binaries, and the luminosity is within the range of systems with wind-fed accretion. The presence of a compact object in the system would require a progenitor with an initial mass greater than the initial mass of Car, i.e. 150 M⊙. The evolution of such a massive progenitor would probably result in the creation of a black hole.
5 Conclusion
We analyzed datasets of the 10 Suzaku observations of the super massive star Car and studied the variation of the extremely hard X-ray emission above 15 keV through the orbital cycle for the first time. Our study suggests that the 1525 keV emission originates in the tail of the thermal emission seen below 10 keV, while the emission above 25 keV is the power-law component observed with INTEGRAL. The origin of the power-law component is mysterious. The and lines of Fe and Ni ions need emission from both CE and NEI plasmas. The NEI plasma ratio increases toward periastron; this result may suggest an increase of gas density around the WWC apex around periastron. In the summer of 2014, another X-ray observing campaign for the latest periastron passage is being performed with multiple X-ray observatories including NuSTAR, which provides focussed imaging up to 80 keV. These observations should provide the best measure of the presence of the deeply embedded X-ray component and the power-law component and their spectral properties (e.g., NH, kT, ). They should help understand the nature of the WWC emission around periastron and the mysterious power-law source.
References
- Abdo et al. (2010) Abdo, A. A., Ackermann, M., Ajello, M., et al. 2010, ApJ, 723, 649
- Asplund et al. (2009) Asplund, M., Grevesse, N., Sauval, A. J., & Scott, P. 2009, ARA&A, 47, 481
- Boldt (1987) Boldt, E. 1987, in IAU Symposium, Vol. 124, Observational Cosmology, ed. A. Hewitt, G. Burbidge, & L. Z. Fang, 611–615
- Chini et al. (2012) Chini, R., Hoffmeister, V. H., Nasseri, A., Stahl, O., & Zinnecker, H. 2012, MNRAS, 424, 1925
- Corcoran (2005) Corcoran, M. F. 2005, AJ, 129, 2018
- Corcoran et al. (2004) Corcoran, M. F., Hamaguchi, K., Gull, T., et al., 2004, ApJ, 613, 381
- Corcoran et al. (2010) Corcoran, M. F., Hamaguchi, K., Pittard, J. M., et al., 2010, ApJ, 725, 1528
- Corcoran et al. (1997) Corcoran, M. F., Ishibashi, K., Davidson, K., et al., 1997, Nature, 390, 587
- Corcoran et al. (2001) Corcoran, M. F., Swank, J. H., Petre, R., et al., 2001, ApJ, 562, 1031
- Damineli et al. (1997) Damineli, A., Conti, P. S., & Lopes, D. F. 1997, New A, 2, 107
- Damineli et al. (2008) Damineli, A., Hillier, D. J., Corcoran, M. F., et al., 2008, MNRAS, 384, 1649
- Davidson & Humphreys (1997) Davidson, K., & Humphreys, R. M. 1997, ARA&A, 35, 1
- Dib & Kaspi (2014) Dib, R., & Kaspi, V. M. 2014, ApJ, 784, 37
- Enoto et al. (2010) Enoto, T., Nakazawa, K., Makishima, K., et al., 2010, ApJ, 722, L162
- Farnier et al. (2011) Farnier, C., Walter, R., & Leyder, J.-C. 2011, A&A, 526, A57
- Feigelson et al. (2011) Feigelson, E. D., Getman, K. V., Townsley, L. K., et al., 2011, ApJS, 194, 9
- Groh et al. (2012) Groh, J. H., Hillier, D. J., Madura, T. I., & Weigelt, G. 2012, MNRAS, 423, 1623
- Hamaguchi et al. (2007a) Hamaguchi, K., Corcoran, M. F., Gull, T., et al., 2007a, ApJ, 663, 522
- Hamaguchi et al. (2014) Hamaguchi, K., Corcoran, M. F., Russell, C. M. P., et al., 2014, ApJ, 784, 125
- Hamaguchi et al. (2007b) Hamaguchi, K., Petre, R., Matsumoto, H., et al., 2007b, PASJ, 59, 151
- Hillier et al. (2001) Hillier, D. J., Davidson, K., Ishibashi, K., & Gull, T. 2001, ApJ, 553, 837
- Ishibashi et al. (1999) Ishibashi, K., Corcoran, M. F., Davidson, K., et al., 1999, ApJ, 524, 983
- Kokubun et al. (2007) Kokubun, M., Makishima, K., Takahashi, T., et al., 2007, PASJ, 59, 53
- Koyama et al. (2006) Koyama, K., Tsunemi, H., Dotani, T., et al., 2006, PASJ, submitted
- Leyder et al. (2008) Leyder, J.-C., Walter, R., & Rauw, G. 2008, A&A, 477, L29
- Leyder et al. (2010) —. 2010, A&A, 524, A59
- Mitsuda et al. (2007) Mitsuda, K., Bautz, M., Inoue, H., et al., 2007, PASJ, 59, 1
- Miyaji et al. (1998) Miyaji, T., Ishisaki, Y., Ogasaka, Y., et al., 1998, A&A, 334, L13
- Parkin et al. (2011) Parkin, E. R., Pittard, J. M., Corcoran, M. F., & Hamaguchi, K. 2011, ApJ, 726, 105
- Pittard & Corcoran (2002) Pittard, J. M., & Corcoran, M. F. 2002, A&A, 383, 636
- Pittard & Dougherty (2006) Pittard, J. M., & Dougherty, S. M. 2006, MNRAS, 372, 801
- Reitberger et al. (2012) Reitberger, K., Reimer, O., Reimer, A., et al., 2012, A&A, 544, A98
- Sana et al. (2012) Sana, H., de Mink, S. E., de Koter, A., et al., 2012, Science, 337, 444
- Sekiguchi et al. (2009) Sekiguchi, A., Tsujimoto, M., Kitamoto, S., et al., 2009, PASJ, 61, 629
- Serlemitsos et al. (2007) Serlemitsos, P. J., Soong, Y., Chan, K.-W., et al. 2007, PASJ, 59, 9
- Smith (2006) Smith, N. 2006, ApJ, 644, 1151
- Stevens et al. (1992) Stevens, I. R., Blondin, J. M., & Pollock, A. M. T. 1992, ApJ, 386, 265
- Takahashi et al. (2007) Takahashi, T., Abe, K., Endo, M., et al., 2007, PASJ, 59, 35
- Tavani et al. (2009) Tavani, M., Sabatini, S., Pian, E., et al., 2009, ApJ, 698, L142
- Verner et al. (2005) Verner, E., Bruhweiler, F., & Gull, T. 2005, ApJ, 624, 973
- Viotti et al. (2002) Viotti, R. F., Antonelli, L. A., Corcoran, M. F., et al., 2002, A&A, 385, 874
- Viotti et al. (2004) Viotti, R. F., Antonelli, L. A., Rossi, C., & Rebecchi, S. 2004, A&A, 420, 527
- Wolk et al. (2011) Wolk, S. J., Broos, P. S., Getman, K. V., et al., 2011, ApJS, 194, 12
- Yamada et al. (2012) Yamada, S., Uchiyama, H., Dotani, T., et al., 2012, PASJ, 64, 53
- Yamaguchi et al. (2014) Yamaguchi, H., Badenes, C., Petre, R., et al., 2014, ApJ, 785, L27