HST Emission Line Galaxies at : The Mystery of Neon
Abstract
We use near-IR grism spectroscopy from the Hubble Space Telescope to examine the strength of [Ne III] relative to H, [O II] and [O III] in 236 low mass () star-forming galaxies in the redshift range . By stacking the data by stellar mass, we show that the [Ne III]/[O II] ratios of the universe are marginally higher than those seen in a comparable set of local SDSS galaxies, and that [Ne III]/[O III] is enhanced by dex. We consider the possible explanations for this result, including higher oxygen depletion out of the gas-phase, denser H II regions, higher production of 22Ne via Wolf-Rayet stars, and the existence of a larger population of X-ray obscured AGN at compared to . None of these simple scenarios, alone, are favored to explain the observed line ratios. We conclude by suggesting several avenues of future observations to further explore the mystery of enhanced [Ne III] emission.
1. Introduction
The coupling of multi-object, near-infrared spectrographs to ground-based 8-m class telescopes and the Hubble Space Telescope has revolutionized our ability to probe the conditions of star formation in the high-redshift universe. The reason for this is simple: at , all the key diagnostic emission lines for density, temperature, and ionization state are shifted into the near-IR, where atmospheric opacity and OH emission severely restrict our ability to measure faint lines. Consequently, virtually all the information we have about the physics of high- star formation is based upon measurements of the bright lines of hydrogen (H and H), oxygen ([O II] and [O III] ), nitrogen ([N II] ), and sulfur ([S II] ). Galaxies at have lower oxygen abundances (e.g., Erb et al., 2006), higher ionization parameters (e.g., Nakajima & Ouchi, 2014), and harder ionization fields (Steidel et al., 2014) than galaxies with similar stellar mass. Moreover, by using a sample of 14 star-forming galaxies, Shirazi et al. (2014) showed that, for a fixed stellar mass and specific star formation rate, the warm ionized gas in star-forming regions is denser than at by a full order of magnitude.
There is, however, one additional bright line that is rarely exploited. [Ne III] is the isoelectronic equivalent of [O III] , with a strength that is often comparable to H. As both neon and oxygen are -process elements that are produced together in the same regions of Type II supernovae, their abundance ratio should be fixed across population metallicity (Woosley & Weaver, 1995; Timmes et al., 1995), and indeed, that appears to be the case locally (Henry, 1989; Izotov et al., 2006, 2011). However, Ne++ has a slightly higher ionization potential than O++ (41.0 versus 35.1 eV), and its principal emission line at 3869 Å has a slightly higher excitation energy (3.2 versus 2.5 eV) and a much higher critical density for de-excitation ( versus cm-3) than its oxygen counterpart. The line therefore has significant diagnostic value, and can be used to constrain the conditions of high-redshift star formation (Levesque & Richardson, 2014).
There have been few measurements of [Ne III] in the high-redshift universe. Perhaps the most detailed is that by Masters et al. (2014), who used co-added spectra to show that for and galaxies, [Ne III] traces [O III] with a strength that is similar but perhaps elevated ( offset) over that seen in the local universe. The sample size of this program was small (23 galaxies), however, and the diagnostic value of neon was not investigated.
Here we use near-IR spectroscopy from the Hubble Space Telescope (HST) and a wealth of ancillary photometric data to examine the emission line ratios of [O III]/H, [Ne III]/[O II], and [Ne III]/[O III] in 236 star-forming galaxies in the redshift range . In §2, we discuss the data acquired over a arcmin2 region of the GOODS-N, GOODS-S, and COSMOS fields, and the processing techniques needed to measure individual emission line ratios. In §3, we describe the procedures used to identify a complete, [O III]-selected sample of galaxies, place our sample in the context of other surveys, and identify local systems with similar stellar masses and star formation rates. In §4, we present our measurements of [Ne III] with respect to [O II] , [O III] , and H. Since only of our sample have all four lines detected with a signal-to-noise ratio greater than one, we also present measurements of a set of stacked spectra. In this section, we compare our data to neon and oxygen measurements at , and demonstrate that the average [Ne III]/[O III] ratio measured at is significantly greater than that seen locally. In §5, we discuss the possible sources of the high [Ne III]/[O III] ratio, including clumpy HII regions, hotter exciting stars, oxygen depletion out of the gas-phase, higher neon to oxygen abundances, and the existence of Compton-thick active galactic nuclei. We conclude by considering observations which would test these hypotheses.
For this work we adopt a standard CDM cosmology, with , , and km s-1 Mpc-1, and a Kroupa (2001) initial mass function (IMF). Unless stated otherwise, the equivalent widths (EW) discussed in this paper are quoted in the rest-frame.
2. Data and Reductions
Our study of emission line ratios in the universe is focused on three arcmin2 patches of sky in the COSMOS (Scoville et al., 2007), GOODS-N, and GOODS-S (Giavalisco et al., 2004) fields. These regions have a wealth of photometric and spectroscopic data available for analysis, including broadband photometry from HST and Spitzer, broad- and intermediate-band photometry from the ground, and optical and near-IR slitless spectroscopy from HST.
2.1. HST Spectroscopy
Our rest-frame optical emission-line measurements come from the 3D-HST (GO-12177, 12328; P.I. P. van Dokkum) and AGHAST (GO-11600; P.I. B. Weiner) near-IR grism surveys with the WFC3 camera of the Hubble Space Telescope (Brammer et al., 2012; Weiner & AGHAST Team, 2014). The primary observations of these programs consisted of G141 slitless grism spectroscopy covering the wavelength range m at resolution with a spatial pixel scale. Approximately 625 arcmin2 was observed in the course of these surveys, including of the CANDELS footprint (Grogin et al., 2011); when combined with accompanying direct images through the F140W filter of WFC3, these data provide full coverage of the rest-frame wavelengths 3700-5020 Å for all galaxies with unobscured emission line fluxes brighter than ergs cm-2 s-1. This wavelength range includes the strong emission lines of [O II] , [O III] , [Ne III] , and hydrogen (H, H and H).
An in-depth discussion of the reduction of these data can be found in Zeimann et al. (2014), but in brief, each grism observation was accompanied by a shallow ( s) F140W exposure, which served to define the position of each object’s wavelength zeropoint and spectral trace. These images were combined using the standard procedures of MultiDrizzle (Fruchter et al., 2009), co-added with the deeper CANDELS F125W and F160W frames, and processed by SExtractor (Bertin & Arnouts, 1996) to produce a master catalog of all objects brighter than and having more than five pixels above a per pixel detection threshold. Each object’s corresponding grism spectrum was obtained using the optimal extraction setting of version 2.3 of aXe (Kümmel et al., 2009), as described in the WFC3 Grism Cookbook444http://www.stsci.edu/hst/wfc3/analysis/grism_obs/cookbook.html (see Zeimann et al., 2014). At the conclusion of this process, the program aXe2web555http://axe.stsci.edu/axe/axe2web.html was used to convert our final list of objects into a webpage containing each object’s 2-D and 1-D extracted spectra, its -band image, and a summary of its properties. This provided an easy and efficient way to maintain quality control and select subsamples of objects for science purposes.
2.2. Optical/Near-IR Imaging
To measure the stellar masses and reddenings of our galaxies, we began with the SExtractor-based photometric catalog of Skelton et al. (2014), which starts with deep, co-added F125W + F140W + F160W images from HST and then adds in the results of 30 distinct ground- and space-based imaging programs. The result is a homogenous, PSF-matched set of broad- and intermediate-band flux densities covering the wavelength range m to m over the entire region surveyed by the HST grism. In the COSMOS field, this dataset contains photometry in 44 separate bandpasses, with measurements from HST, Spitzer, Subaru, and a host of smaller ground-based telescopes. In GOODS-N, the data come from HST, Spitzer, Keck, Subaru, and the Mayall telescope, and include 22 different bandpasses, while in GOODS-S, six different telescopes provide flux densities in 40 bandpasses. For systems, these data cover the rest-frame UV through the rest-frame near-IR and allow excellent estimates of stellar mass, under the necessary assumptions about the underlying stellar population (i.e., stellar metallicity, star formation history, and attenuation law).
3. Sample Selection and Measurements
Our galaxy sample is nearly identical to that defined by Zeimann et al. (2014), who visually inspected over 50,000 spectra in their program to identify star forming galaxies. These galaxies satisfied three basic criteria:
A secure redshift between . In this redshift interval, the emission lines of [O II] , [Ne III] , H, H, and [O III] all fall into the range of the G141 grism. To be part of the sample, a galaxy had to have at least two of these lines reliably detected. At the resolution of the G141 grism, the [O III] doublet is blended, though with a distinctive, easily-identifiable shape (see Figure 1 of Zeimann et al., 2014). A total of 309 unique galaxies were identified through this condition.
Minimal contamination from field sources. Overlapping spectra are a significant issue in slitless spectroscopy, as the dispersed order of one source frequently overlaps the spectrum of another. To estimate the importance of this effect, Zeimann et al. (2014) used the sizes and magnitudes of every object in the HST grism SExtractor catalog to produce a 2-D Gaussian model of every expected spectrum (Kümmel et al., 2009). This procedure identified most of the spectral superpositions, but not all: in particular, the algorithm occasionally missed some regions where the systematics of contamination subtraction dominate the error in the continuum. Consequently, an additional visual inspection was needed to identify those objects where this systematic error was greater than the statistical error of the target spectrum. This criterion eliminated 57 objects from the sample.
A well-fit spectral energy distribution. As described in §3.1, we obtained masses for our galaxies by fitting their spectral energy distribution to population synthesis models via a Markov-Chain Monte Carlo code. For 16 objects, this procedure did not converge, due either to a misidentification of the asymmetric [O III] doublet, or poor broadband photometry. These objects were excluded from our analysis, leaving us with a final sample of 236 galaxies distributed over the GOODS-N, GOODS-S, and COSMOS fields.
To understand the systematics of this sample, Zeimann et al. (2014), simulated a set of model emission-line spectra in the exact same manner as our program data. These artificial sources were randomly drawn from uniform distributions in redshift (), log metallicity (), and log H flux ( ergs s-1 cm-2), placed on mock grism frames, and “observed” in the exact same manner as the original data. The results of this experiment can be found in Figure 2 of Zeimann et al. (2014). In brief, for the GOODS-N and GOODS-S fields, our 50% and 80% completeness limits for H flux measurements are ergs s-1 cm-2 and ergs s-1 cm-2, respectively, with little variation with redshift or metallicity. Due to its higher background, the COSMOS limits are shallower by a factor of (Brammer et al., 2012).
Emission line fluxes were determined by fitting the continuum of each spectrum with a fourth-order polynomial, while simultaneously fitting Gaussians of a common width to the emission lines of [O II] , [Ne III] , H, H, and [O III] . Our choice of polynomial was driven by the possible presence of a 4000 Å break in the stellar continuum, though fits using a series of first-order polynomials around each emission line yielded similar results. Also, we did not correct any of our fits for underlying Balmer absorption (Moustakas et al., 2006). In the local universe, typical corrections for H are of the order of Å equivalent width (EW), but this number is a function of both population age and IMF (Groves et al., 2012). As can be seen in Figure 3 of Zeimann et al. (2014), this factor is relatively small compared to the equivalent widths considered here. Indeed, to verify that the effect is minor, we repeated all our analyses while adding 4 Å EW to each of our H measurements. This action has the effect of increasing all our H fluxes by an average of , hence lowering our [O III]/H ratios by the same amount.
3.1. Global Properties of the Sample
To place our neon measurements in context, we must first define the global properties of our galaxy sample, particularly their star formation rates (SFRs) and stellar masses. The former parameter can be computed in two ways: through the H line luminosity, which measures the ionizing flux from stars born in the past yr, and the rest-frame UV continuum, which records stellar emission from stars younger than yr (Kennicutt & Evans, 2012). Zeimann et al. (2014) investigated the behavior of these two indicators in the same sample of galaxies considered here, and found that UV-based SFRs are less sensitive to shifts in galactic metallicity than Balmer emission. We therefore adopted the Zeimann et al. (2014) UV-based SFRs for our analysis. These values are derived from the photometry of Skelton et al. (2014), and are based on the fits to the 1600 Å flux density, assuming a power-law slope to the UV continuum, the Calzetti (2001) obscuration law, and the local SFR calibration (Hao et al., 2011; Murphy et al., 2011; Kennicutt & Evans, 2012).
Our stellar masses are based upon the analysis of Gebhardt et al. (2014), who used the Markov Chain Monte Carlo code GalMC (Acquaviva et al., 2011) to model the spectral energy distribution (SED) of every galaxy in our sample. In brief, the Skelton et al. (2014) photometric measurements were fit to the 2007 version of population synthesis models of Bruzual & Charlot (2003), using a Kroupa (2001) IMF over the range , a Calzetti (2001) obscuration law, and the prescription for emission lines given by Acquaviva et al. (2011), as updated by Acquaviva et al. (2012). Since stellar abundances are poorly constrained by broadband SED measurements, the metallicity of these models was fixed at , which is close to the median gas-phase metallicity of our sample (Gebhardt et al., 2014). To avoid the emission from polycyclic aromatic hydrocarbons, all data points redward of rest-frame m were excluded from the fits (Tielens, 2008), as were measurements blueward of 1216 Å, where the statistical correction for intervening Ly absorption (Madau, 1995) may not always be appropriate. Finally, for simplicity, the SFR of each galaxy was assumed to be constant with time. Although almost certainly not the case, this constraint does not strongly affect our estimates for the stellar mass.
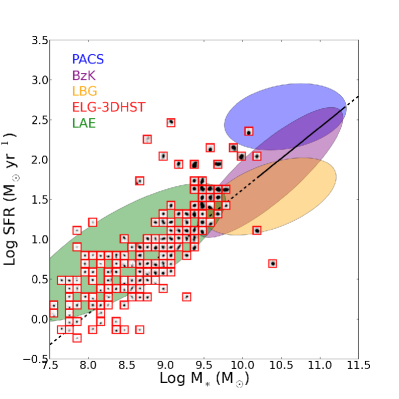
Figure 1 compares the masses and SFRs of our galaxies to other members of the “galaxy zoo”. For the figure, literature SFRs and stellar masses were converted from a Salpeter (1955) IMF to a Kroupa (2001) IMF by subtracting 0.16 and 0.25 dex, respectively. No correction was made from a Chabrier (2003) IMF to a Kroupa (2001) IMF as this correction is small (6%). We highlight other galaxy samples using ellipses defined to include % of their galaxies. In general, the galaxies selected by the HST grism are less massive and have lower star formation rates than systems selected via their broadband continuum measurements. In this respect, our emission-line galaxies are similar to Ly emitting systems (LAEs, Vargas et al., 2014; Hagen et al., 2014), and, like LAEs, the HST emission-line sources tend to fall above the extrapolated SFR-stellar mass “main sequence” defined by Rodighiero et al. (2011).
Another way to view the global properties of our sample of grism galaxies is through a comparison with local star-forming systems. Such an analysis is not straightforward since, on average, systems form stars ten times more rapidly than do local objects (e.g., Whitaker et al., 2014). Nevertheless, we can create an analogous sample by applying luminosity, equivalent width, and stellar mass cuts to the Sloan Digital Sky Survey (SDSS; York et al., 2000) Data Release 7 (Abazajian et al., 2009) MPA-JHU galaxy catalog666www.mpa-garching.mpg.de/SDSS/DR7. Specifically, we selected objects with extinction-corrected H luminosities ergs s-1, stellar masses between , and H equivalent widths greater than 5 Å (so that the measurement of flux is not dominated by the correction for stellar absorption). For inclusion in our comparison sample, we also required that the galaxies’ emission line fluxes at [O II] , [Ne III] , H, [O III] , and [O III] all be at least twice as large as their flux error. This latter criterion facilitated direct measurements of the systems’ electron temperatures, enabling a better understanding of their physical conditions (Osterbrock & Ferland, 2006), while only reducing the sample by %.
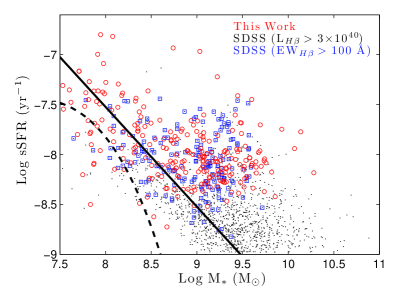
Our selection criteria resulted in the identification 2890 galaxies between with a median redshift of . As illustrated in Figure 2, our grism galaxies have mass-specific star formation rates that are much higher than most of the comparison objects. Consequently, to obtain an even better set of analogs, we further restricted the local sample to “young” galaxies, i.e., systems with high H equivalent widths (EW Å). As Figure 2 demonstrates, this additional criterion creates a local sample that is quite similar to our dataset, i.e., the distant star-forming galaxies identified by the HST grism are comparable in both mass and specific star formation rate to the “green pea” galaxies (Cardamone et al., 2009) and the luminous blue compact galaxies identified by Izotov et al. (2011) in their analysis of the SDSS spectral catalog. By including lower equivalent width objects in our initial sample, however, we did diversify the population: as the commonly used Baldwin et al. (1981) diagnostic indicates, the larger comparison set contains both star forming regions and AGN, with some objects being composites of the two populations. This information will be useful for our subsequent analysis.
4. The Neon-Oxygen Line Ratios
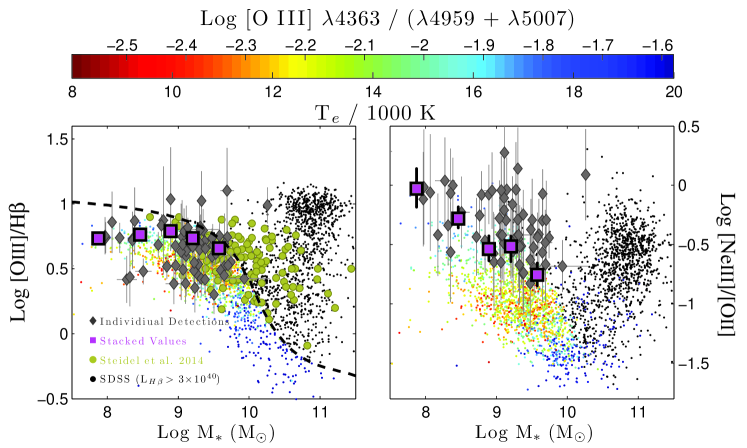
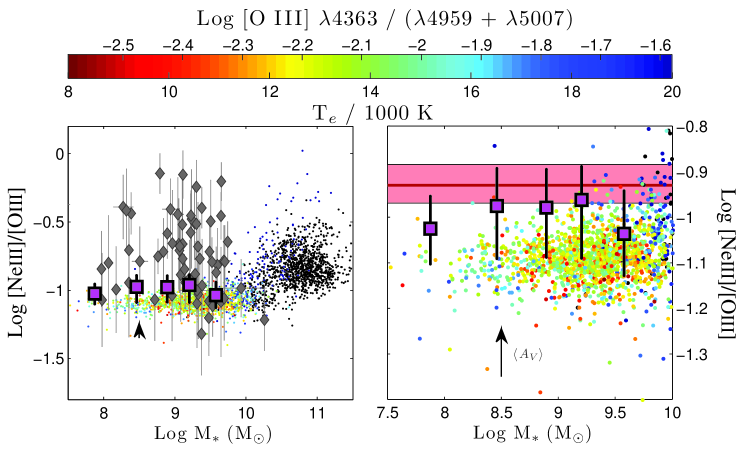
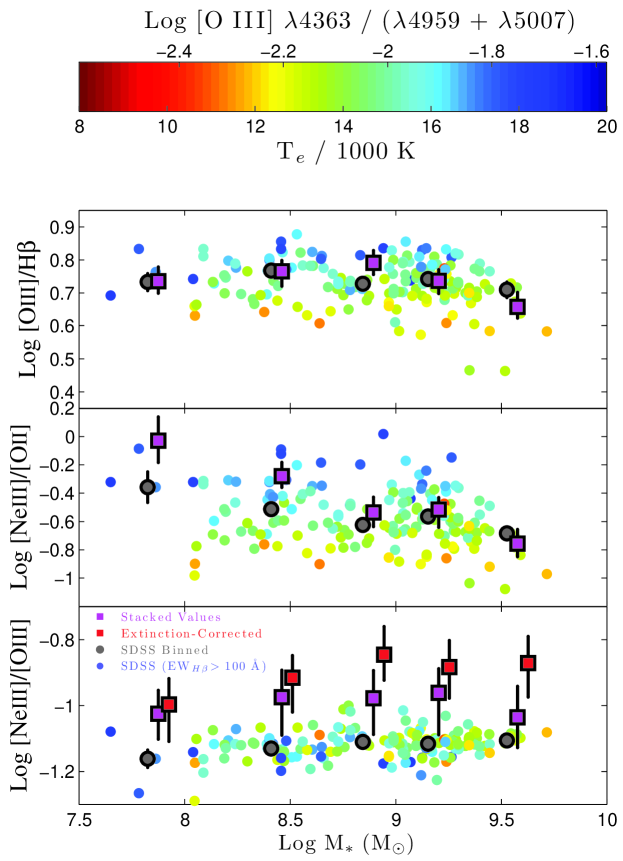
Figure 3 plots the [O III]/H, [Ne III]/[O II], and [Ne III]/[O III] line ratios against stellar mass for our sample of star-forming galaxies, the Steidel et al. (2014) sample of massive (9 M∗/M⊙ 11.5) star-forming (0.5 log SFR (M⊙ yr-1) 2) galaxies, and our more inclusive local comparison sample. To illustrate the sequences, the local systems have been color-coded by their [O III] / [O III] electron temperature (Osterbrock & Ferland, 2006), and AGN-dominated systems, as determined by the mass-excitation diagnostic (Juneau et al., 2011, 2014), have been plotted in black. From the figure, it is clear that, although the measurement uncertainties are large, our star-forming galaxies have neon/oxygen line ratios that are significantly higher than that seen in the local universe. In the [Ne III]/[O II] diagram, the HST grism galaxies typically lie dex above the sequence defined by local starbursting galaxies, while for [Ne III]/[O III], the median offset is dex. We note that, unlike the [O III]/H and [Ne III]/[O II] line ratios, the [Ne III]/[O III] diagnostic is sensitive to reddening. However, extinction corrections will only make the discrepancy worse by boosting [Ne III] relative to [O III]; if we convert the UV-based stellar reddenings into nebular extinctions via the obscuration law of Calzetti (2001), the median offset increases to dex. These high neon/oxygen ratios stand in striking contrast to the results from [O III]/H, where the values for this index are well-matched for metal-poor analogs with high electron temperatures. Whatever is causing neon to appear enhanced is not changing the expected strength of [O III] .
4.1. Stacked Measurements
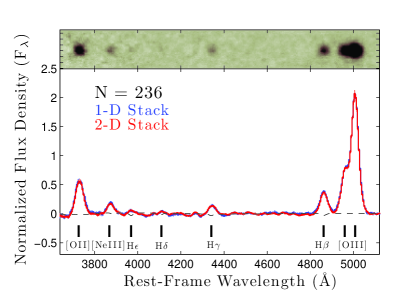
In many of our star forming galaxies, [Ne III] is too faint to detect, and by omitting these galaxies from our analysis, we are biasing our sample. In fact, only of our galaxies have [O II], [Ne III], H, and [O III] all measured with a signal-to-noise ratio greater than one. Consequently, to understand the rest of the star-forming population, we must rely on spectral stacks of various galaxy subsets, obtained from both the 1-D extracted spectra and from the original 2-D data.
To perform these stacks, we followed the procedures discussed in Francis et al. (1991). We began by subtracting the continuum from each spectrum using a single fourth-order polynomial in the 1-D case and multiple fourth-order polynomials covering the spatial direction for the 2-D data. We then shifted each spectrum into the rest frame via linear interpolation with 1/3 pixel (5 Å sampling) in the wavelength direction, and 1/3 pixel () sampling in the spatial direction. Slightly different sampling sizes (i.e., 1/2 or 3/4 of a pixel) did not substantially effect the result. Next, we scaled each spectrum to its flux in the [O III] 5007 line, and computed the median value for each wavelength, and (for the 2-D spectral extractions) for each spatial position. By median stacking, we preserved the relative strengths of the emission lines, enabling us to measure line ratios. We then computed errors for the median stack using the 16th and 84th percentiles of 500 bootstrap with replacement iterations of this process. Finally, to check for consistency, we summed the central ( re-sampled pixels, or kpc) of the 2-D median spectrum and compared it to the corresponding median produced from the 1-D analysis. As Figure 4 illustrates, there is excellent agreement between the two results. The collapsed 2-D median spectrum does have a slightly higher signal-to-noise ratio than the 1-D median, and we use that in the analysis below. However, the results do not change if we use the 1-D median stacks.
To investigate the behavior of [Ne III] with galaxy type, we divided our sample of galaxies into subgroups and stacked their spectra by stellar mass, SFR, and mass-specific star formation rate (sSFR) . As expected, the results of these analyses are correlated, since, as can be seen in Figure 1, star formation rate and stellar mass are related. Moreover, as Figure 2 illustrates, our selection criteria produce an artificial correlation between sSFR and stellar mass at the low mass end of our distribution. In what follows, we choose mass as the independent parameter, understanding that for our sample, lower mass galaxies will have, on average, lower SFRs but higher sSFRs.
Table 1 presents the median line ratios for the stacked spectra of five mass bins. These values are displayed via the purple squares in Figures 3, and Figure 5 compares the ratios to measurements of [O III]/H, [Ne III]/[O II], and [Ne III]/[O III] for the well-matched local sample of high H equivalent width objects. From the figures, it is clear that the forbidden neon-to-oxygen line ratios of the universe are offset from those observed in nearby galaxies, even when comparing to systems with identical stellar masses and specific star-formation rates. In the [Ne III]/[O II] diagram, the trend with stellar mass follows that defined by local low-mass starburst galaxies, but with a mean offset of dex, which is still marginally consistent with the high-EWHβ local sample. The offset in the [Ne III]/[O III] diagram is more dramatic: even if one assumes no extinction, there is still a dex offset between the and local sample for each mass bin. If a Calzetti (2001) obscuration law and the UV slope is used to correct each grism spectrum prior to stacking, this offset balloons to dex across all masses (7.5 log(M∗/M⊙) 10.5). In contrast, there is no difference between the [O III]/H ratios derived from our median stacks and the local galaxies. Table 2 describes these offsets.
5. Interpreting the Line Ratios
Although they are likely oversimplified, photo-ionization models have both qualitatively and quantitatively reproduced the emission line ratios in the local universe (Kewley & Dopita, 2002; Dopita et al., 2006). We can therefore use such models (e.g., CLOUDY Version 13.03; Ferland et al., 1998, 2013) to gain insight into the dominant physical parameters which govern emission lines at .
To do this, we ran a grid of uniform-density plane-parallel CLOUDY models, fixing the relative elemental abundances at solar values (in particular, ), while varying the nebula’s oxygen abundance (), electron density ( cm-3), ionization parameter (, where is the ratio of ionizing photons to the number density of atoms), and hardness of the ionizing spectrum (). We then examined the strengths of the [Ne III] , [O II] , [O III] , and H lines as a function of these parameters, in order to explore the possible origins of enhanced neon-to-oxygen ratios. The local analog sample line ratios are best reproduced by CLOUDY models with densities between 102-103 cm-3, effective black body temperatures of , ionization parameters in the range of , and oxygen abundances between 8.1 8.6. These values are slightly higher but still consistent with the metallicity range measured via [O III]4363 and agree with the best-fit values of the CLOUDY models used by Steidel et al. (2014) for their sample.
Our analysis is similar to that performed by Levesque & Richardson (2014), who mated the MAPPINGS III photo-ionization code (Binette et al., 1985; Sutherland & Dopita, 1993; Groves et al., 2004) to STARBURST99 (Leitherer et al., 1999; Vázquez & Leitherer, 2005) instantaneous burst stellar populations, using the assumption of a plane-parallel isobaric geometry and cm-3. Their results (as seen in their Figure 2), overestimate the local relationship between [Ne III]/[O III] by dex, and predict line strengths that are even greater than that seen in the universe. The source of the discrepancy is unknown.
5.1. Interpretation
To understand the line ratios displayed in Figures 3 and 5, we begin by considering the local sample of galaxies. In the diagrams, we plot two sets of objects: those whose line ratios suggest the presence of an AGN, and those which appear to be normal star-forming galaxies. The former systems are generally identified by comparing [O III]/H to [N II]/H (i.e., via the BPT diagram; Baldwin et al., 1981), although in the absence of [N II]/H, stellar mass can be used as a proxy (Juneau et al., 2011, 2014). Few of our objects fall on this AGN sequence; in general, the galaxies detected by the HST grism are lower-mass objects with [O III]/H ratios that place them securely in the star-formation region of the diagram. The star-forming galaxies themselves lie on a sequence traced by both the nebular electron temperature and excitation: as the mass of a system decreases, the auroral [O III] line becomes more prominent, and the dominant state of oxygen shifts from O+ to O++. Both of these trends are generally interpreted as being due to metallicity, as fewer metals mean hotter stars and larger ionization parameters (e.g., Massey et al., 2005), while fewer coolants translate into higher electron temperatures (e.g., Evans & Dopita, 1985; Dopita et al., 2006).
The [Ne III] line ratios derived from the stacked spectra follow these trends. As the stellar mass and metallicity increase, there is a decline in the (reddening independent) ratio of [Ne III]/[O II] which exactly follows that seen in the local universe. Meanwhile, the (reddening-corrected) [Ne III]/[O III] ratio marginally increases by dex per dex in stellar mass, again, consistent with local observations ( dex per dex in stellar mass).
The difficulty arises when considering the absolute strength of [Ne III] . Neon and oxygen are formed together in Type II supernovae (Woosley & Weaver, 1995; Timmes et al., 1995), and their doubly-ionized states have similar ionization potentials. Consequently, in the local universe, [Ne III] and [O III] are tightly correlated across all star-forming galaxies (e.g., Izotov et al., 2006, 2011). The 178 high-equivalent width (EW 100 Å) starburst galaxies which most closely match our systems in both stellar mass and specific star formation rate are plotted in Figure 2. The median de-reddened value of [Ne III]/[O III] for these objects is . In contrast, the value for our total median stacked spectrum is without any correction for reddening. If we then de-redden each spectrum using the slope of the stellar UV continuum and a Calzetti (2001) obscuration law, the ratio of the re-stacked data becomes , i.e., nearly greater than the local measurement. This offset is higher than that found by Masters et al. (2014), who obtained a offset of using the extinction-corrected composite spectrum of 23 galaxies with and . Masters et al. (2014) did note, however, that their data have a rather large () uncertainty in the relative calibration of [O III] to H. Their measurements are therefore consistent with ours when taking the relative calibration uncertainties into account.
The 1.5 enhancement in the [Ne III] emission of star-forming galaxies over that seen in local galaxies with similar global properties, has several possible explanations:
5.1.1 Potential Systematics
The high [Ne III]/[O III] ratio found for our galaxies relies on our stacking analysis, so an error in our methodology or extinction correction could result in an elevated ratio. To investigate the former, we scrutinized the flux calibration, continuum subtraction, and biases related to our stacking methodology. For flux calibration, we relied only on the G141 grism calibration777www.stsci.edu/hst/wfc3/documents/ISRs/WFC3-2011-05.pdf and www.stsci.edu/hst/wfc3/documents/ISRs/WFC3-2014-01.pdf, which has been documented to be accurate to . Nevertheless, to test the relative flux calibration over scales of 2000 Å, we binned our data by redshift (or, equivalently, by observed wavelength) and found no significant variations in the ratios of emission line strengths, suggesting that the flux calibration is indeed stable. Similarly, to test for errors in our continuum subtraction, we binned our data by estimated levels of spectral contamination. In our 1-D and 2-D grism spectra, the underlying continuum is a combination of stellar emission from the galaxy and residual contamination from overlapping spectra (see Section 3.1). To capture the trends in both, we fit the continuum with a fourth order polynomial, and this could, in theory, introduce a systematic bias. However, an analysis of our spectra shows no significant relation between line strength and contamination. Moreover, when we repeated our stacking procedure using the best-fit SEDs from our stellar mass estimations, the simplified polynomial approximation enhanced [Ne III] (by 5%), leaving [O II] and [O III] relatively unaffected.
To verify the robustness of our stacking procedure, we compared the line ratios found from the median stacks of all the objects with individual line detections with the median of the individual line ratios measured from these same data. The results were consistent. Also, to examine whether our extinction corrections were affecting the stacking process, we compared the results of stacks where reddening corrections were applied prior to stacking with similar stacks where de-reddening occurred only after the fact. Again, there was no difference in the results. Finally, one complication related to WFC3 IR grism extractions is that the point spread function (PSF) becomes slightly larger with wavelength. For point sources this must be taken into account, but if the galaxies are substantially larger than the PSF, the issue is mitigated. As seen in the cutouts of Figure 1, most of our galaxies are indeed resolved. An examination of the spatial dependence of our 2-D stacked spectra confirms that the extraction algorithm is not introducing a significant systematic error into our line measurements: the spatial extent of [O II] and [O III], the two emission lines with the largest wavelength separation, are consistent ( full-width half maximum for the total stack).
The significance of our [Ne III]/[O III] result also depends on how we correct our spectra for the effects of dust. Due to the excellent photometric coverage in the rest-frame UV, the uncertainties associated with our stellar reddenings are relatively small, and this term contributes only of the total [Ne III]/[O III] error budget. However, the possible systematic uncertainty associated with our nebular extinctions could be larger. To translate our stellar reddenings into nebular extinctions, we used the Calzetti (2001) obscuration law, which states that the applicable extinction for nebular lines is greater than that for starlight by . This result is supported by numerous comparisons of UV- and Balmer line-based SFR measurements in the universe (Förster Schreiber et al., 2009; Mannucci et al., 2009; Wuyts et al., 2013; Price et al., 2014; Holden et al., 2014; Zeimann et al., 2014), but counter-examples exist as well (Erb et al., 2006). Thus, we can take the very conservative approach and assume that the stars and gas are equally extinguished. Under this prescription, the ratio of [Ne III]/[O III], , is still discrepant with the local value at the level. It is therefore exceedingly unlikely that the high neon ratios seen at are due to our assumptions about reddening.
5.1.2 Collisional De-Excitation
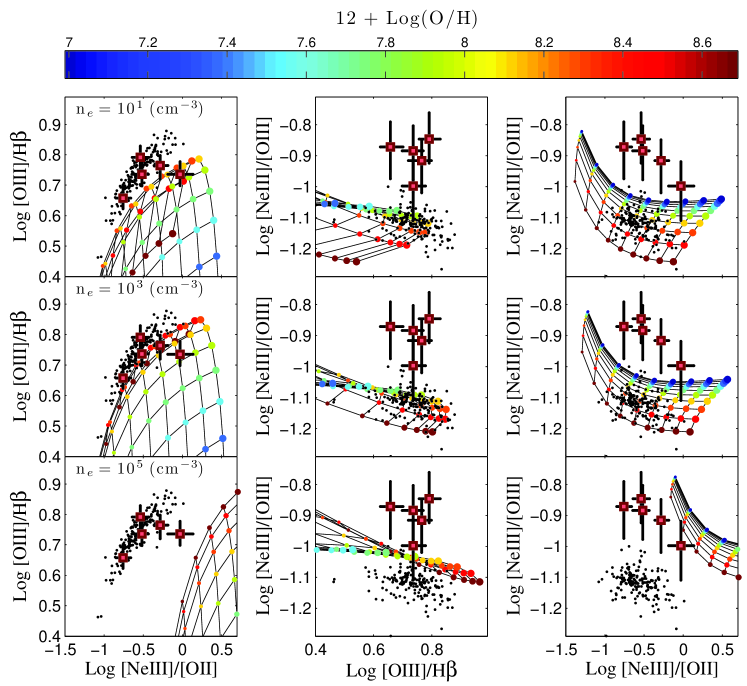
The critical density of the 2 state of O++ that produces [O III] is cm-3; for the equivalent state of Ne++, this density is cm-3. Hence if the density of a typical H II region is significantly greater than that observed for H II regions in the local universe (i.e., cm-3), collisional de-excitation of oxygen will cause [Ne III] to appear enhanced. Such densities are more extreme than what is usually seen in massive galaxies (Shirazi et al., 2014), but are still plausible, especially if the star-forming regions follow a size-density relation (e.g., Kennicutt, 1984; Hunt & Hirashita, 2009). Moreover, high densities have been invoked to explain the strengths of mid-infrared emisson lines in the Antennae galaxies (Snijders et al., 2007), as well as the emission from the molecular gas of ultra-luminous infrared galaxies (Solomon et al., 1992). The effect of electron density on our line ratios can be seen in Figure 6. We display, from left to right, the three projections of our three dimensional emission-line space and overlay our CLOUDY models for three different densities: 10, 103, 105 cm-3. For this analysis, the ionizing spectrum has been fixed to a 55,000 K blackbody spectrum as suggested in Steidel et al. (2014). The figure demonstrates that densities of cm-3 can successfully explain the line ratios of local galaxies, with perhaps a small deficit of [O III]. However, no value of abundance, ionization parameter, or density can simultaneously explain all three line ratios for the systems.
The difficulty with invoking high densities is that the collisional de-excitation of oxygen should affect other lines as well. For example, if [O III] emission were decreased by the requisite , the [O III]/H ratio would be lowered by that same factor. This decrease is not evident in the top left panel of Figure 3. Similarly, because the critical density for the nebular lines of [O II] is cm-3, the [Ne III]/[O II] ratio would be greatly enhanced in a high-density environment (by at least a factor of ; see Figure 6). While it may be possible to design a multi-zone model wherein [O II] and [O III] are produced in different regions of a galaxy, substantial tuning would be needed, and the [O III]/H discrepancy would remain.
5.1.3 Hotter Exciting Stars
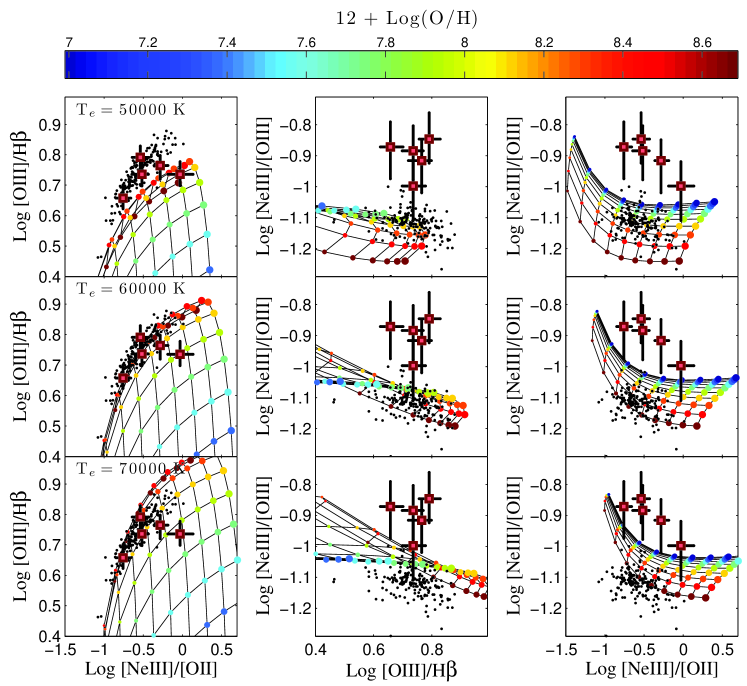
For more than a decade, it has been clear that high-redshift galaxies have, on average, higher [O III]/H ratios than similar galaxies in the local universe (e.g., Teplitz et al., 2000). With the largest sample of galaxies observed to date, Steidel et al. (2014) showed that, at any given [N II]/H, higher than normal [O III]/H ratios could be obtained by increasing the temperature of the ionizing source from the assumed value of K for the local SDSS galaxies, to K. Since Ne++ has a higher ionization potential than O++, this change could, in theory, increase the fraction of doubly-ionized neon relative to oxygen. However, the difference in the ionization potentials of the two species is only 5.9 eV (41.0 eV versus 35.1 eV), so once beyond 45,000 K, increasing the temperature of a blackbody source has little effect on the ratio of the ionization states. This result is illustrated in Figure 7.
Galaxies, of course, are not a single blackbody sources, but a composite of many different stars with different effective temperatures. To examine this effect, we used the STARBURST99 (SB99, version 6.0.4) population synthesis code (Leitherer et al., 1999; Vázquez & Leitherer, 2005) to create a more realistic ionizing spectrum for CLOUDY input. For a constant star formation history, the ionizing spectrum of a SB99 galaxy is insensitive to age, once the system is older than yr. Indeed, if all the other parameters are fixed, the ionizing spectrum is well-fit by a blackbody with an effective temperature primarily determined by the stellar metallicity. For a system, this temperature is roughly 65,000 K; for , it is 55,000 K, and varying the high-mass slope of the IMF has little effect on this result. We did not explore binary population synthesis or the effects of stellar rotation, but it is clear that standard SB99 models cannot produce a spectrum that is hard enough to match the observed line ratios.
5.1.4 Oxygen Depletion Onto Dust Grains
While neon is an inert gas, oxygen is reactive, and can be depleted out of the gas phase onto dust grains or molecules. In the local universe, of oxygen is thought to be locked up in grains and molecules such as water and O2 (Jenkins, 2009); if this ratio is higher in the universe, then our [Ne III] 3869 observations can be explained. However, one expects fewer opportunities for dust depletion at , not more. Conventionally, oxygen is bound up by refractory compounds such as metallic oxides and amorphous silicates, which require the prior existence of -process and iron-peak elements. In the metal-poor environment of our systems, this process must be inhibited. On the other hand, when oxygen consumption is measured against the abundance of metals such as Mg, Si, and Fe, its depletion from the gas phase is six times higher than expected (Jenkins 2009). This suggests the existence of an additional avenue for the removal of oxygen from the gas phase. However, since this second avenue probably involves the creation of ices on the surfaces of dust grains (Ioppolo et al., 2008), it is still likely to depend on metallicity. Still, the possibility of dust depletion cannot be ruled out.
5.1.5 Enhanced Neon to Oxygen Abundance
The most straightforward interpretation is that the neon to oxygen abundance ratio in the universe is enhanced by dex over that of the local universe. At face value, this scenario seems unlikely. In the Sun, the dominant isotope of neon is that of 20Ne, which contributes 92.9% of all neon atoms, with 22Ne being the next most abundant species (6.8%; Asplund et al., 2009). Since 20Ne is formed directly from 16O via -capture, the formation regions of the two species must be highly correlated. Indeed, abundance measurements in Milky Way and Magellanic Cloud planetary nebulae (Henry, 1989), H II regions (Garnett, 2002), and other galaxies (Izotov et al., 2006, 2011) yield the same cosmic Ne/O abundance over a wide range of metallicity ().
On the other hand, 22Ne has a different formation site: the hydrogen and helium burning shells of massive stars in their late stages of evolution. During a thermal pulse, some of the 12C and 16O produced by the fusion of helium can be convected outward to the site of the temporarily dormant hydrogen burning shell. When the hydrogen re-ignites, this material will be converted to 14N via CNO burning, and, upon the next thermal pulse, some of this nitrogen will be transported back to into the helium burning shell, where it will undergo captures. The result is the creation of , 22Ne, 25Mg, and s-process elements. Dredge-up can then bring this material to the stellar surface, where it can be lost to the interstellar medium via stellar winds. If the importance of this process is greater in the universe, the result can be an enhancement in the total neon to oxygen ratio.
Interestingly, the analysis of Galactic cosmic rays suggests a 22Ne/20Ne ratio of , i.e., a value that is times higher than what is found in the solar wind (e.g., Binns et al., 2005). Although the cause of this offset is still debated, the most widely accepted explanation for the excess 22Ne ions lies in the physics of carbon-rich Wolf-Rayet stars (Casse & Paul, 1982; Prantzos et al., 1987). The high-velocity winds of these systems cannot only deposit the 22Ne from shell mixing into the local ISM, but the wind interactions with standing shocks from nearby Wolf-Rayet and precursor OB stars can accelerate material to the high speeds associated with cosmic rays. Wolf-Rayet star winds have also been invoked to explain the high nitrogen to oxygen ratios observed at (e.g., Masters et al., 2014; Shapley et al., 2014), though in this case, it is the nitrogen-rich WN stars which are the source of the enhancement.
If, indeed, 22Ne is solely responsible for the elevated [Ne III]/[O III] line ratios observed in our HST grism galaxies, then the 22Ne/20Ne isotopic ratio at must . This is roughly ten times larger than that ratio seen in the Solar wind, and times larger than that measured for cosmic rays. At face value, such an enhancement does not seem plausible. However, many aspects of massive star stellar evolution, such as the evolution of the IMF with redshift, the effects of stellar rotation, and the importance of binary stars at high-, are not well known. Moreover, it is not clear whether the solar ratio of 22Ne/20Ne is representative of the universe as a whole: it is quite possible that the isotopic ratio in spiral arms is larger than that observed in the solar system. Thus, this possibility cannot be ruled out.
5.1.6 Compton-Thick AGN
Non-thermal radiation can enhance [Ne III] relative to [O III] and reproduce the line ratios seen at . As the bottom left panel of Figure 3 demonstrates, the local sample of galaxies classified as AGN by the MEx diagnostic (Juneau et al., 2011, 2014) clearly have enhanced values of [Ne III] relative to the locus of star-forming galaxies.
All three of our program fields — GOODS-N, GOODS-S, and COSMOS – have medium deep and deep X-ray data (Elvis et al., 2009; Alexander et al., 2003; Xue et al., 2011), and, at the redshifts considered here (), X-rays associated with normal star formation will be well below the limits of detection (Lehmer et al., 2010). Consequently, any emission-line galaxy whose position is co-incident with an X-ray source is likely powered by an AGN.
To search for these AGN, we cross-correlated our object catalog with the list of X-ray sources found in the COSMOS, GOODS-N, and GOODS-S regions. Only four of our emission-line galaxies lie within of an X-ray source, and, in all four, the signal-to-noise ratio is too low to place a significant limit on [Ne III]/[O III]. We then stacked the remaining 63 galaxies in the Chandra Deep Field South 4Ms field (Xue et al., 2011) following the procedure described by Luo et al. (2011), and examined the resulting image for evidence of X-ray emission. No X-rays were found down to 90% upper limits of , , and ergs s-1 cm-2 for the 0.5-2.0 keV, 2.0-8.0 keV, and 0.5-8.0 keV bandpasses, respectively. These limits correspond to a maximum absorbed X-ray luminosity of ergs s-1 at the average redshift of the stacked sample () and constrain the maximal fractional contribution of AGN to the observed [O III] and [Ne III] luminosities.
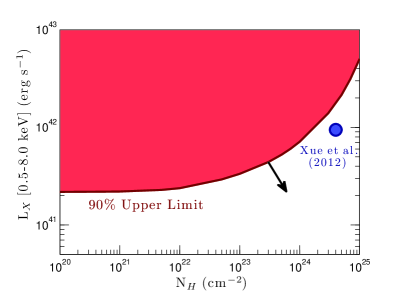
Xue et al. (2012) has argued that 20-25% of the cosmic hard X-ray background (6-8 keV) emanates from heavily obscured AGN residing in low mass ( to ), high redshift () galaxies, with an average 0.5-2 keV flux of erg cm-2 s-1. This is below the 90% upper limit found in our stacking analysis, so it remains possible that the high [Ne III]/[O III] ratios are being caused by obscured AGN. This is illustrated in Figure 8, which uses the Chandra Proposal Planning Toolkit888http://cxc.harvard.edu/toolkit/pimms.jsp to show our intrinsic X-ray luminosity limit as a function of absorbing column density, , for an AGN with photon power law index of .
To better quantify the effect of AGN on the observed [Ne III]/[O III] ratio, we can begin by considering our median galaxy, which has an extinction-corrected [O III] luminosity of ergs s-1. Compton-thin AGN with 2-8 keV luminosities near the limit of our stacking analysis ( ergs s-1) typically have [O III] to X-ray luminosity ratios of between and 0.1 (Lamastra et al., 2009; Wilkes et al., 2013). This means that these objects can contribute no more to the total [O III] luminosity of our stacked galaxy. In contrast, Compton-thick AGN can have [O III] to X-ray luminosity ratios that are times larger (Wilkes et al., 2013), hence their contribution could conceivably be as large as . If we let be the mean [Ne III]/[O III] ratio for our local sample of high-equivalent width star forming galaxies, and be the same quantity for local Seyfert 1 AGN (Nagao et al., 2001), then the measured [Ne III]/[O III] ratio in our stacked galaxy should be
| (1) |
where is the median fractional contribution of AGN to the luminosity of [O III]. For , , so this is still consistent with the measured values of our stacks. This argument holds for any distribution of the fractional contribution of AGN to the luminosity of [O III] as long as the median of that distribution is a few tens of percent. We therefore cannot rule out the hypothesis that an unseen population of Compton-thick AGN is causing the [Ne III]/[O III] line ratios to appear enhanced.
6. Future Avenues
When comparing the median stacked values for our 236 galaxies to a local comparison sample from SDSS (well-matched in stellar mass and sSFR), we find consistent [O III]/H ratios across all stellar masses. However, [Ne III]/[O II] is elevated by dex for and [Ne III]/[O III] is persistently high by more than (0.16 to 0.25 dex) for each mass bin and all reasonable extinction laws with a total significance of . There are several possible mechanisms that can explain the high ratios, including oxygen depletion, extreme densities, and the existence of a large population of X-ray obscured AGN. Further observations with current ground-based 8-m class telescopes as well as upcoming space-based missions like the James Webb Space Telescope are required to assess whether the elevation is truly compelling and to identify the physical reasons for it.
The ratio of [Ne III]/[O III] is sensitive to dust, and although we were able to estimate the attenuation through the indirect method of stellar reddening, measurements of the Balmer decrement would allow an accurate correction. H, H, and H are all observable in our stacked spectra, but due to their low signal-to-noise ratio, short lever arm, and the effects of stellar absorption, these ratios yield highly uncertain extinction estimates. A measurement of H placed on the same relative flux scale as H can be obtained from the ground via the MOSFIRE instrument on Keck (McLean et al., 2012) and the FLAMINGOS-2 spectrograph on Gemini (Eikenberry et al., 2012). This would remove the uncertainty associated with extinction.
We explored the possibility that the ratio of [Ne III]/[O III] could be caused by collisional de-excitation of [O III] at high electron densities ( cm-3). This would only be possible in a multi-zonal model as a single zone ionized region cannot explain all three observed line ratios. If indeed H II regions in the universe are clumpier than their local counterparts, high critical density UV emission lines such as CIII]1909 may show strong emission. A CIII] equivalent width of 10Å (Stark et al., 2014) would translate into a median expected flux of 3 ergs s-1 cm-2.
Further investigations of the [Ne III]/[O III] ratio are also possible for using GOODS-N archival data from the WFC3 G102 (PI Barro: GO-13420) and G141 grisms. The G102 grism also provides a measurement of the higher ionization line [Ne V] for nearly 100 of the galaxies in our sample. Since AGN exhibit [Ne V]/[Ne III] ratios that are an order of magnitude greater than that of normal star-forming systems, these data could be used to test whether obscured AGN are responsible for enhanced [Ne III] emission in the universe.
References
- Abazajian et al. (2009) Abazajian, K.N., Adelman-McCarthy, J.K., Agüeros, M.A., et al. 2009, ApJS, 182, 543
- Acquaviva et al. (2011) Acquaviva, V., Gawiser, E., & Guaita, L. 2011, ApJ, 737, 47
- Acquaviva et al. (2012) Acquaviva, V., 2012, private communication
- Alexander et al. (2003) Alexander, D.M., Bauer, F.E., Brandt, W.N., et al. 2003, AJ, 126, 539
- Asplund et al. (2009) Asplund, M., Grevesse, N., Sauval, A.J., & Scott, P. 2009, ARA&A, 47, 481
- Baldwin et al. (1981) Baldwin, J.A., Phillips, M.M., & Terlevich, R. 1981, PASP, 93, 5
- Bertin & Arnouts (1996) Bertin, E., & Arnouts, S. 1996, A&AS, 117, 393
- Binette et al. (1985) Binette, L., Dopita, M. A., & Tuohy, I. R. 1985, ApJ, 297, 476
- Binns et al. (2005) Binns, W. R., Wiedenbeck, M. E., Arnould, M., et al. 2005, ApJ, 634, 351
- Brammer et al. (2012) Brammer, G.B., van Dokkum, P.G., Franx, M., et al. 2012, ApJS, 200, 13
- Bruzual & Charlot (2003) Bruzual, G., & Charlot, S. 2003, MNRAS, 344, 1000
- Calzetti (2001) Calzetti, D. 2001, PASP, 113, 1449
- Cardamone et al. (2009) Cardamone, C., Schawinski, K., Sarzi, M., et al. 2009, MNRAS, 399, 1191
- Casse & Paul (1982) Casse, M., & Paul, J. A. 1982, ApJ, 258, 860
- Chabrier (2003) Chabrier, G. 2003, PASP, 115, 763
- Dessart et al. (2000) Dessart, L., Crowther, P. A., Hillier, D. J., et al. 2000, MNRAS, 315, 407
- Dopita et al. (2006) Dopita, M.A., Fischera, J., Sutherland, R.S., et al. 2006, ApJ, 647, 244
- Eikenberry et al. (2012) Eikenberry, S., Bandyopadhyay, R., Bennett, J.G., et al. 2012, Proc. SPIE, 8446, 8446OI
- Elvis et al. (2009) Elvis, M., Civano, F., Vignali, C., et al. 2009, ApJS, 184, 158
- Eracleous et al. (2012) Eracleous, M., Boroson, T. A., Halpern, J. P., & Liu, J. 2012, ApJS, 201, 23
- Erb et al. (2006) Erb, D.K., Steidel, C.C., Shapley, A.E., et al. 2006, ApJ, 647, 128
- Evans & Dopita (1985) Evans, I.N., & Dopita, M.A. 1985, ApJS, 58, 125
- Ferland et al. (1998) Ferland, G.J., Korista, K.T., Verner, D.A., et al. 1998, PASP, 110, 761
- Ferland et al. (2013) Ferland, G.J., Porter, R.L., van Hoof, P.A.M., et al. 2013, å, 49, 137
- Förster Schreiber et al. (2009) Förster Schreiber, N.M., Genzel, R., Bouché, N., et al. 2009, ApJ, 706, 1364
- Francis et al. (1991) Francis, P.J., Hewett, P.C., Foltz, C.B., et al. 1991, ApJ, 373, 465
- Fruchter et al. (2009) Fruchter, A., Sosey, M., Hack, W., et al. 2009, The MultiDrizzle Handbook Version 3.0 (Baltimore, STScI)
- Garnett (2002) Garnett, D.R. 2002, arXiv:astro-ph/0211148
- Gebhardt et al. (2014) Gebhardt, H., Zeimann, G.R., Ciardullo, R., et al. 2014, in preparation
- Giavalisco et al. (2004) Giavalisco, M., Ferguson, H.C., Koekemoer, A.M., et al. 2004, ApJ, 600, L93
- Grogin et al. (2011) Grogin, N.A., Kocevski, D.D., Faber, S.M., et al. 2011, ApJS, 197, 35
- Groves et al. (2004) Groves, B. A., Dopita, M. A., & Sutherland, R. S. 2004, ApJS, 153, 9
- Groves et al. (2012) Groves, B., Brinchmann, J., & Walcher, C.J. 2012, MNRAS, 419, 1402
- Hagen et al. (2014) Hagen, A., Ciardullo, R., Gronwall, C., et al. 2014, ApJ, 786, 59
- Hao et al. (2011) Hao, C.N., Kennicutt, R.C., Johnson, B.D., et al. 2011, ApJ, 741, 124
- Henry (1989) Henry, R.B.C. 1989, MNRAS, 241, 453
- Holden et al. (2014) Holden, B.P., Oesch, P.A., Gonzalez, V.G., et al. 2014, submitted to ApJ (arXiv:1401.5490)
- Hunt & Hirashita (2009) Hunt, L.K., & Hirashita, H. 2009, A&A, 507, 1327
- Ioppolo et al. (2008) Ioppolo, S., Cuppen, H. M., Romanzin, C., van Dishoeck, E. F., & Linnartz, H. 2008, ApJ, 686, 1474
- Izotov et al. (2006) Izotov, Y.I., Stasińska, G., Meynet, G., Guseva, N.G., & Thuan, T.X. 2006, A&A, 448, 955
- Izotov et al. (2011) Izotov, Y.I., Guseva, N.G., & Thuan, T.X. 2011, ApJ, 728, 161
- Jenkins (2009) Jenkins, E.B. 2009, ApJ, 700, 1299
- Juneau et al. (2011) Juneau, S., Dickinson, M., Alexander, D.M., & Salim, S. 2011, ApJ, 736, 104
- Juneau et al. (2014) Juneau, S., Bournaud, F., Charlot, S., et al. 2014, ApJ, 788, 88
- Kennicutt (1984) Kennicutt, R.C., Jr. 1984, ApJ, 287, 116
- Kennicutt & Evans (2012) Kennicutt, R.C., & Evans, N.J. 2012, ARA&A, 50, 531
- Kewley & Dopita (2002) Kewley, L.J., & Dopita, M.A. 2002, ApJS, 142, 35
- Kroupa (2001) Kroupa, P. 2001, MNRAS, 322, 231
- Kümmel et al. (2009) Kümmel, M., Walsh, J.R., Pirzkal, N., Kuntschner, H., & Pasquali, A. 2009, PASP, 121, 59
- Lamastra et al. (2009) Lamastra, A., Bianchi, S., Matt, G., et al. 2009, A&A, 504, 73
- Lehmer et al. (2010) Lehmer, B.D., Alexander, D.M., Bauer, F.E., et al. 2010, ApJ, 724, 559
- Leitherer et al. (1999) Leitherer, C., Schaerer, D., Goldader, J.D., et al. 1999, ApJS, 123, 3
- Levesque & Richardson (2014) Levesque, E.M., & Richardson, M.L.A. 2014, ApJ, 780, 100
- Luo et al. (2011) Luo, B., Brandt, W.N., Xue, Y.Q., et al. 2011, ApJ, 740, 37
- Madau (1995) Madau, P. 1995, ApJ, 441, 18
- Mannucci et al. (2009) Mannucci, F., Cresci, G., Maiolino, R., et al. 2009, MNRAS, 398, 1915
- Massey et al. (2005) Massey, P., Puls, J., Pauldrach, A.W.A., et al. 2005, ApJ, 627, 477
- Masters et al. (2014) Masters, D., McCarthy, P., Siana, B., et al. 2014, ApJ, 785, 153
- McLean et al. (2012) McLean, I.S., Steidel, C.C., Epps, H.W., et al. 2012, Proc. SPIE, 8446
- Mendez et al. (2013) Mendez, A.J., Coil, A.L., Aird, J., et al. 2013, ApJ, 770, 40
- Moustakas et al. (2006) Moustakas, J., Kennicutt, R.C., Jr., & Tremonti, C.A. 2006, ApJ, 642, 775
- Murphy et al. (2011) Murphy, E.J., Condon, J.J., Schinnerer, E., et al. 2011, ApJ, 737, 67
- Nagao et al. (2001) Nagao, T., Murayama, T., & Taniguchi, Y. 2001, PASJ, 53, 629
- Nakajima & Ouchi (2014) Nakajima, K., & Ouchi, M. 2014, MNRAS, 442, 900
- Netzer et al. (2006) Netzer, H., Mainieri, V., Rosati, P., & Trakhtenbrot, B. 2006, A&A, 453, 525
- Nonino et al. (2009) Nonino, M., Dickinson, M., Rosati, P., et al. 2009, ApJS, 183, 244
- Osterbrock & Ferland (2006) Osterbrock, D.E., & Ferland, G.J. 2006, Astrophysics of Gaseous Nebulae and Active Galactic Nuclei, 2nd. ed. by D.E. Osterbrock & G.J. Ferland (Sausalito, CA: University Science Books)
- Prantzos et al. (1987) Prantzos, N., Arnould, M., & Arcoragi, J.-P. 1987, ApJ, 315, 209
- Price et al. (2014) Price, S. H., Kriek, M., Brammer, G. B., et al. 2014, ApJ, 788, 86
- Rodighiero et al. (2011) Rodighiero, G., Daddi, E., Baronchelli, I., et al. 2011, ApJ, 739, L40
- Salpeter (1955) Salpeter, E.E. 1955, ApJ, 121, 161
- Scoville et al. (2007) Scoville, N., Aussel, H., Brusa, M., et al. 2007, ApJS, 172, 1
- Shapley et al. (2014) Shapley, A. E., Reddy, N. A., Kriek, M., et al. 2014, submitted to ApJ (arXiv:1409.7071)
- Shirazi et al. (2014) Shirazi, M., Brinchmann, J., & Rahmati, A. 2014, ApJ, 787, 120
- Skelton et al. (2014) Skelton, R. E., Whitaker, K. E., Momcheva, I. G., et al. 2014, ApJS, 214, 24
- Smith & Houck (2005) Smith, J.-D. T., & Houck, J. R. 2005, ApJ, 622, 1044
- Snijders et al. (2007) Snijders, L., Kewley, L.J., & van der Werf, P.P. 2007, ApJ, 669, 269
- Solomon et al. (1992) Solomon, P.M., Downes, D., & Radford, S.J.E. 1992, ApJ, 387, L55
- Stark et al. (2014) Stark, D. P., Richard, J., Siana, B., et al. 2014, arXiv:1408.1420
- Steidel et al. (2014) Steidel, C.C., Rudie, G.C., Strom, A.L., et al. 2014, ApJ in press (arXiv:1405.5473)
- Sutherland & Dopita (1993) Sutherland, R. S., & Dopita, M. A. 1993, ApJS, 88, 253
- Taniguchi et al. (2007) Taniguchi, Y., Scoville, N., Murayama, T., et al. 2007, ApJS, 172, 9
- Teplitz et al. (2000) Teplitz, H.I., Malkan, M.A., Steidel, C.C., et al. 2000, ApJ, 542, 18
- Tielens (2008) Tielens, A.G.G.M. 2008, ARA&A, 46, 289
- Timmes et al. (1995) Timmes, F.X., Woosley, S.E., & Weaver, T.A. 1995, ApJS, 98, 617
- Vargas et al. (2014) Vargas, C.J., Bish, H., Acquaviva, V., et al. 2014, ApJ, 783, 26
- Vázquez & Leitherer (2005) Vázquez, G.A., & Leitherer, C. 2005, ApJ, 621, 695
- Weiner & AGHAST Team (2014) Weiner, B. J., & AGHAST Team 2014, American Astronomical Society Meeting Abstracts #223, 223, #227.07
- Whitaker et al. (2014) Whitaker, K.E., Franx, M., Leja, J., et al. 2014, submitted to ApJ (arXiv:1407.1843)
- Wilkes et al. (2013) Wilkes, B. J., Kuraszkiewicz, J., Haas, M., et al. 2013, ApJ, 773, 15
- Willis et al. (1997) Willis, A. J., Dessart, L., Crowther, P. A., et al. 1997, MNRAS, 290, 371
- Willis (1999) Willis, A. J. 1999, Wolf-Rayet Phenomena in Massive Stars and Starburst Galaxies, 193, 1
- Woosley & Weaver (1995) Woosley, S.E., & Weaver, T.A. 1995, ApJS, 101, 181
- Wuyts et al. (2013) Wuyts, S., Förster Schreiber, N.M., Nelson, E.J., et al. 2013, ApJ, 779, 135
- Xue et al. (2011) Xue, Y.Q., Luo, B., Brandt, W.N., et al. 2011, ApJS, 195, 10
- Xue et al. (2012) Xue, Y. Q., Wang, S.X., Brandt, W.N., et al. 2012, ApJ, 758, 129
- York et al. (2000) York, D. G., Adelman, J., Anderson, J. E., Jr., et al. 2000, AJ, 120, 1579
- Zeimann et al. (2014) Zeimann, G.R., Ciardullo, R., Gebhardt, H., et al. 2014, ApJ, 790, 113
| Log M∗ | Num. | SFR | Log sSFR | Log [O III]/H | Log [Ne III]/[O II] | Log [Ne III]/[O III] | Log [Ne III]/[O III] | |
|---|---|---|---|---|---|---|---|---|
| M⊙ | — | M⊙ yr-1 | yr-1 | — | — | — | Obs. | Cor.111 [Ne III]/[O III] corrected for extinction via a Calzetti (2001) obscuration law using the UV slope. |
| 7.87 | 47 | 2.0 | 7.47 | 2.04 | 0.740.05 | 0.030.16 | 1.020.09 | 1.000.10 |
| 8.45 | 47 | 3.7 | 7.93 | 1.98 | 0.760.04 | 0.280.09 | 0.970.10 | 0.920.09 |
| 8.89 | 48 | 8.2 | 8.01 | 1.74 | 0.790.04 | 0.540.11 | 0.980.10 | 0.850.08 |
| 9.20 | 47 | 11.8 | 8.08 | 1.80 | 0.740.04 | 0.520.11 | 0.960.10 | 0.890.09 |
| 9.58 | 48 | 32.6 | 8.07 | 1.53 | 0.660.05 | 0.760.10 | 1.040.09 | 0.870.09 |
| Mass Bin | Num. | Num. | Log [O III]/H | Log [Ne III]/[O II] | Log [Ne III]/[O III]222 [Ne III]/[O III] corrected for extinction via a Calzetti (2001) obscuration law. |
|---|---|---|---|---|---|
| Log (M∗/M⊙) | Offset111The difference between the logarithm of the median line ratios for the sample and the local comparison sample with high equivalent widths. | Offset111The difference between the logarithm of the median line ratios for the sample and the local comparison sample with high equivalent widths. | Offset111The difference between the logarithm of the median line ratios for the sample and the local comparison sample with high equivalent widths. | ||
| 7.50 - 8.18 | 47 | 11 | 0.000.05 | 0.330.20 | 0.160.10 |
| 8.18 - 8.72 | 47 | 43 | 0.000.04 | 0.230.10 | 0.220.09 |
| 8.72 - 9.07 | 48 | 40 | 0.060.04 | 0.090.11 | 0.260.08 |
| 9.07 - 9.35 | 47 | 59 | 0.010.04 | 0.050.11 | 0.230.09 |
| 9.35 - 10.50 | 48 | 25 | 0.050.05 | 0.070.11 | 0.230.09 |