Drastic electronic structure reconstruction of Ca1-xPrxFe2As2 in the collapsed tetragonal phase
Abstract
We report the electronic structure reconstruction of Ca1-xPrxFe2As2 ( = 0.1 and 0.15) in the low temperature collapsed tetragonal (CT) phase observed by angle-resolved photoemission spectroscopy. Different from Ca(Fe1-xRhx)2As2 and the annealed CaFe2As2 where all hole Fermi surfaces are absent in their CT phases, the cylindrical hole Fermi surface can still be observed in the CT phase of Ca1-xPrxFe2As2. Furthermore, we found at least three well separated electron-like bands around the zone corner in the CT phase of Ca1-xPrxFe2As2, which are more dispersive than the electron-like bands in the high temperature tetragonal phase. Based on these observations, we propose that the weakening of correlations (as indicated by the reduced effective mass), rather than the lack of Fermi surface nesting, might be responsible for the absence of magnetic ordering and superconductivity in the CT phase.
pacs:
74.25.Jb, 74.70.-b, 79.60.-i, 71.20.-bI INTRODUCTION
The interplay of magnetism, lattice and superconductivity is an important issue in iron-based superconductors. Typically, the ground state of iron pnictides is a magnetically ordered collinear-antiferromagnetic (CAF) state pnictide_SDW1 ; pnictide_SDW2 . Carrier doping or the application of hydrostatic pressure can gradually suppress the CAF order and then lead to the emergence of a superconducting dome in the phase diagram induce_SC1 ; induce_SC2 ; induce_SC3 . On the other hand, under 0.35 GPa hydrostatic pressure, CaFe2As2 was found to undergo a remarkable structural transition to a collapsed tetragonal (CT) phase at low temperatures CaFe2As2_hydro1 ; CaFe2As2_hydro2 ; CaFe2As2_hydro3 . Intriguingly, this CT phase, characterized by the shrinkage in the -direction by approximately 10% without breaking the symmetry, is non-magnetic and non-superconducting. As shown by calculations, neutron scattering, and x-ray emission spectroscopy, Fe local moments are absent in the CT phase non-magnetic_theory1 ; non-magnetic_theory2 ; non-magnetic_experiment1 ; non-magnetic_experiment2 ; CaFe2As2_hydro3 . Therefore, it provides a unique platform for studying a non-superconducting iron-pnictide system without Fe local moments. From a different angle of view, this would facilitate the understanding of the electronic structure which is relevant to superconductivity and local moments in the superconducting iron pnictides.
Angle-resolved photoemission spectroscopy (ARPES) is one of the most direct methods of studying the electronic structure of solids. However, reports on the CT phase had been limited by the necessity of external pressure. Early on, since the non-magnetic phosphide CaFe2P2 is a close structural analog of CaFe2As2 in the CT phase, its electronic structure is considered to somewhat reflect the electronic behavior of the CT phase CaFe2P2_QO . The de Haas-van Alphen study showed that the Fermi surface of CaFe2P2 is highly three-dimensional and the hole pocket only exists around the point of the Brillouin zone, which are very different from the electronic strucure of an iron pnictide superconductor. Recently, the CT phase was found to be stabilized under ambient pressure through introducing chemical pressure by specific dopants or thermal treatment CaFe2As2_doping ; CaFe2As2_thermal_treatment . Subsequent ARPES experiments on Ca(Fe1-xRhx)2As2 Ca(FeRh)2As2_CT_ARPES and the annealed CaFe2As2 CaFe2As2_CT_ARPES_1 ; CaFe2As2_CT_ARPES_2 have revealed significant differences in the electronic structure between the high temperature tetragonal (HT) phase and the CT phase. The predicted vanishment of the hole pocket at the zone center non-magnetic_theory1 ; CaFe2As2_no_hole_1 ; CaFe2As2_no_hole_2 has been confirmed in both cases. The Fermi surface nesting between electron and hole Fermi surfaces thus does not exist anymore, which was argued to be responsible for the absence of magnetic fluctuation and superconductivity in the CT phase Ca(FeRh)2As2_CT_ARPES ; CaFe2As2_CT_ARPES_1 .
Ca1-xPrxFe2As2 is one of the several iron pnictides that undergo the collapsed tetragonal transition under ambient pressure upon cooling CaFe2As2_hydro3 ; CaFe2As2_doping ; CaPr_2SC_phase ; CaPr_anisotropy ; CaPr_NMR ; CaPr_Hoffman ; CaPr_local_inhomogeneity . However, little is known about its electronic structure to date. To examine the common properties of the band reconstruction across the CT transition, it is worthwhile to study the low-lying electronic structure of Ca1-xPrxFe2As2, which might provide clues to understand the interplay of magnetism, lattice and superconductivity in iron-based superconductors.
In this article, we report a detailed ARPES study on Ca1-xPrxFe2As2 single crystals ( = 0.1 and 0.15). The electronic structure in the high temperature tetragonal (HT) phase resembles that of the parent compound CaFe2As2 in its paramagnetic state. Across the CT transition, bands around the zone center shift towards different directions. However, the cylindrical hole Fermi surface can still be observed in its CT phase. This is different from the CT phases of Ca(Fe1-xRhx)2As2 and the annealed CaFe2As2, in which all hole Fermi surfaces are absent. At least three well separated electron-like bands can be resolved around the zone corner in the CT phase. This contradiction indicates that the absence of magnetic ordering and superconductivity in the CT phase is not correlated with the presence or absence of hole pocket. Our polarization dependence data show strong orbital mixing for the bands in the CT phase. Illustrated by the detailed temperature dependence data, band reconstruction occurs abruptly across the transition, and the hysteresis of reconstruction in the temperature cycle further confirms its first order nature. By comparing the effective masses of the bands in these two phases, we propose that the suppression of electronic correlation, rather than the lack of Fermi surface nesting, might be responsible for the absence of magnetic fluctuation and superconductivity in the CT phase ZRY . Our results indicate that the electronic structure of the CT phase of Ca1-xPrxFe2As2 are rather different from those of other known CT compounds, and thus might help facilitate a more comprehensive understanding of the CT phase.
II SAMPLE PROPERTIES AND EXPERIMENTAL SETUP
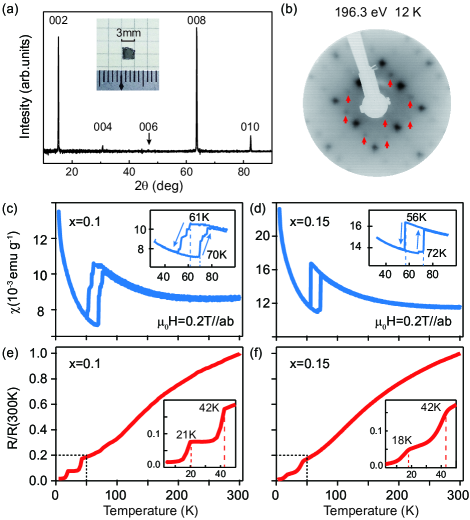
High quality Ca1-xPrxFe2As2 single crystals were synthesized by the FeAs self-flux method as described elsewhere CaFe2As2_growth . The typical dimension of our samples is 32.50.1 mm3 as shown by the inset of Fig. 1(a). The typical X-ray diffraction (XRD) pattern of our sample [Fig. 1(a)] agrees well with the previous report CaPr_2SC_phase . We have studied samples with two compositions ( = 0.1 and 0.15), and the electron probe micro-analysis (EPMA) gives actual chemical compositions of Ca:Pr:Fe:As = 0.967:0.152:2.000:2.010 for = 0.1, and 0.931:0.231:2.000:2.024 for = 0.15 samples (normalized to the stoichiometric value of Fe), respectively. These samples show slight differences in the onset CT transition temperatures, as illustrated by the hysteretic drops in magnetic susceptibility [Figs. 1(c) and (d)]. Moreover, there are two drops [Figs. 1(e) and (f)] in resistivity near 20 K and 40 K for both samples, indicating the possible existence of two superconducting phases CaPr_2SC_phase ; CaPr_local_inhomogeneity . However, no evident diamagnetic behavior could be identified in the magnetic susceptibility in the zero-field cool mode, which suggests the filamentary nature of the superconductivity in this material CaPr_local_inhomogeneity . These properties are qualitatively consistent with previous reports on Ca1-xPrxFe2As2 CaFe2As2_doping ; CaPr_local_inhomogeneity ; CaPr_NMR . There is no evident difference in electronic structure between = 0.1 and = 0.15 samples except for slight changes in the chemical potential (< 10 meV), thus only representative data will be shown for them.
ARPES measurements were performed at (i) Beamline 5-4 of Stanford Synchrotron Radiation Lightsource (SSRL), (ii) the SIS beamline of the Swiss Light Source (SLS) and (iii) an in-house system equipped with a SPECS UVLS helium discharge lamp. VG-Scienta R4000 electron analyzers are equipped in all setups. The angular resolution was 0.3∘ and the overall energy resolution was better than 15 meV. Samples were cleaved - and measured under ultra-high vacuum better than 510-11 torr. The cleaved sample surface exhibits 12 and 21 reconstructions [Fig. 1(b)], which were frequently observed in cleaved Fe2As2 compounds 122_surface1 ; 122_surface2 ; CaPr_Hoffman . Recent scanning tunneling microscopy study on Ca1-xPrxFe2As2 identify the 12 and 21 surface as a half-Ca termination CaPr_Hoffman , which preserves the charge neutrality. This is a must for the surface to be representative of the bulk.
III EXPERIMENTAL RESULTS
III.1 Band structures in the HT phase and the CT phase
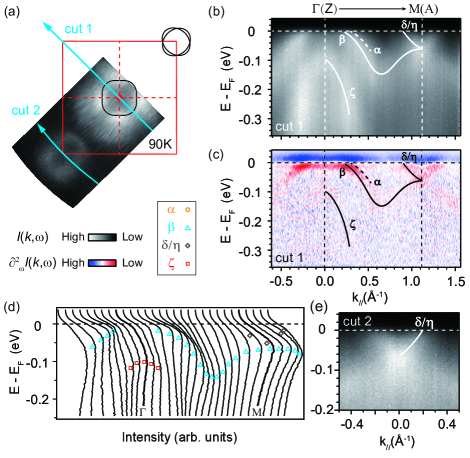
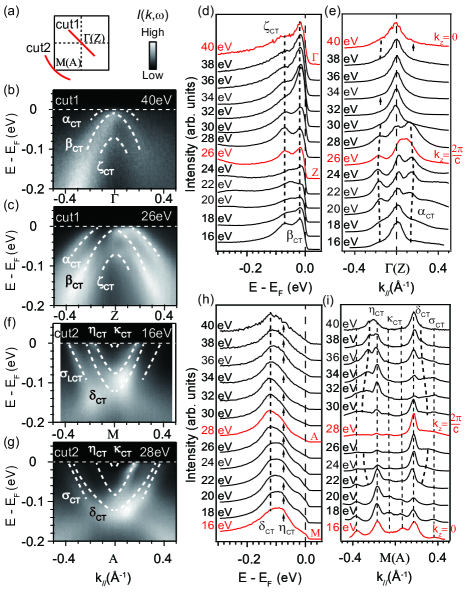
The electronic structure of Ca1-xPrxFe2As2 ( = 0.1) in the HT phase is presented in Fig. 2. The Fermi surface consists of a large square hole pocket around the zone center and two concentric elliptical electron pockets at the zone corner as illustrated in Fig. 2(a). The photoemission intensity plot and its second derivative with respect to energy along cut 1 [indicated in Fig. 2(a)] are shown in Figs. 2(b) and (c), respectively. At the zone center, two bands (assigned as and ) can be identified by tracking the peaks in the corresponding energy distribution curves (EDCs) in Fig. 2(d). The band crosses the Fermi level () while the band top of is located at about -100 meV. In this photon energy, the hole-like band is hard to resolve directly due to the overwhelming intensity of the broad band. At the zone corner along cut 2 [Fig. 2(e)], one broad electron-like feature can be resolved. This feature should be contributed by two electron-like bands (assigned as and ), which could be better distinguished in other planes and would be shown later. Overall, the band structure of Ca1-xPrxFe2As2 ( = 0.1) in the HT phase resembles that of Ca2Fe2As2 in the paramagnetic state reported by previous ARPES experiments Chenfei_ARPES ; CaFe2As2_ARPES .
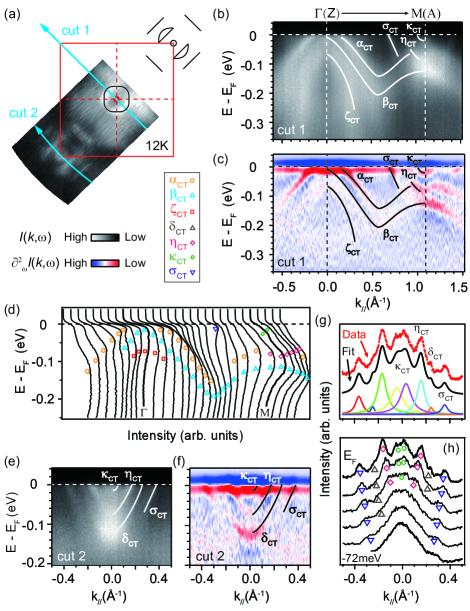
The Fermi surface topology and band structure of Ca1-xPrxFe2As2 ( = 0.1) change dramatically in the CT phase as shown in Fig. 3. The reconstructed Fermi surface consists of a smaller square hole pocket around the zone center and several rather complicated electron pockets at the zone corner [Fig. 3(a)]. The disconnection of the Fermi surface contours might be due to the matrix element effects. The photoemission intensity plot and its second derivative with respect to energy along cut 1 are shown in Figs. 3(b) and (c), respectively. Three bands around the zone center (assigned as , and ) could be resolved. From the EDCs shown in Fig. 3(d), crosses Fermi level while the band top of is located at -10 meV. The fast dispersing may originate from , and its band top moves from -100 meV to about -70 meV.
Around the zone corner, the photoemission intensity plot and its second derivative with respect to energy along cut 2 are plotted in Figs. 3(e) and (f), respectively. Eight Fermi crossings can be clearly distinguished by the fitting of the momentum distribution curves (MDCs) near as indicated in Fig. 3(g), six of which belong to three electron-like bands (assigned as , and ), which can be further confirmed by tracking the peaks in MDCs below in Fig. 3(h). However, it is hard to determine whether the band with the largest crossings (assigned as ) is a hole-like band around the zone center or an electron-like band around the zone corner. Moreover, faint intensity is detected around the point (not shown here). This additional intensity is consistent with the folding of bands which would be induced from the 12 and 21 reconstructions at the surface 122_surface2 . The main feature of the electronic structure of the CT phase of Ca1-xPrxFe2As2 is that bands tend to be more dispersive in general. For example, around the zone corner, the Fermi velocity of , and is larger than those of () in the HT phase, indicating that the electronic correlations are suppressed in the CT phase.
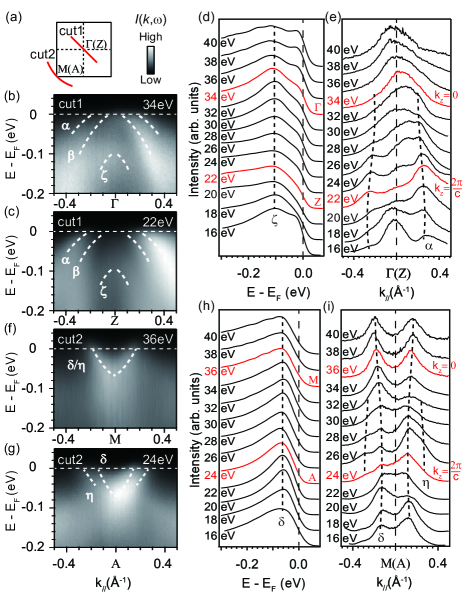
All the above data were taken with 21.2 eV photons. However, the sizable contraction of lattice parameter across the transition can result in the expansion of the reciprocal lattice along direction, which means that the data taken in the HT and CT phase lie in different planes. If the electronic structure of Ca1-xPrxFe2As2 is highly three-dimensional, it is probable that the differences observed above are merely related to dispersions. To rule out this possibility, photon energy dependent ARPES experiments were performed. Our data cover more than half of the Brillouin zone along direction. Considering the periodicity of the band dispersions along direction, we use an inner potential of 16 eV to determine the corresponding high symmetry points.
Photon energy dependence of the bands in the HT phase are presented in Fig. 4. At the zone center, two representative photoemission intensity plots taken with different photon energies are compared in Figs. 4(b) and (c). The intensities of and show anticorrelation with each other. While is at its strongest around point [Fig. 4(b)], is mostly enhanced around point [Fig. 4(c)]. However, there is rather little variation in the band dispersions. For instance, the band tops of show negligible dependence as illustrated in Fig. 4(d). As for , the MDCs at in Fig. 4(e) show the slight changes in the Fermi crossings upon variation in photon energy, indicative of its moderate dependence. The intensity of become faint around the point, which is probably due to the differences in photoemission matrix element. Around the zone corner [Figs. 4(f)-(i)], the broad electron-like band splits into two bands at specific photon energies as illustrated in Figs. 4(g) and (i). The broad peaks in EDCs around -70 meV correspond to the band bottom of , and their positions do not change with photon energies.
In the CT phase (Fig. 5), the representative photoemission intensity plots taken with different photon energies are shown in Figs. 5(b), (c), (f) and (g). As illustrated in Figs. 5(b)-(e), the intensities of , and behave almost the same as those of , and in the HT phase, except their band tops are located at different binding energies, as mentioned above. At the zone corner [Figs. 5(f)-(i)], the band bottoms of and do not vary with photon energies [Fig. 5(h)]. In Fig. 5(i), the peak positions of , and in MDCs at show negligible dependence. While the Fermi crossing of varies slightly, indicating its moderate dispersion.
The observed photon energy dependency indicates that the electronic structure of Ca1-xPrxFe2As2 is quite two-dimensional in general. As a result, it rules out the possibility that the differences between the electronic structures of the HT and CT phase are caused by the complication related to dispersions. Moreover, the band tops of , and the band bottoms of , show negligible dependence. These may be exploited to study the temperature dependence of the reconstruction in data taken with the same photon energy.
III.2 Polarization dependence
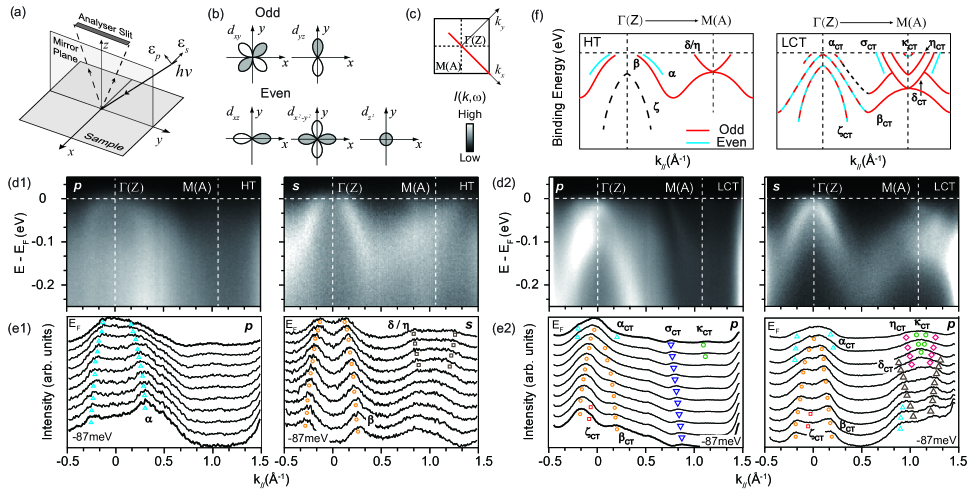
To further understand the electronic structure of Ca1-xPrxFe2As2, polarization dependent measurements were conducted at SLS to identify the orbital characters of band structure. Fig. 6(a) illustrates two types of experimental setup with linearly-polarized photons. The incident beam and the sample surface normal define a mirror plane. For the (or ) experimental geometry, the electric field direction () of the incident photons is parallel (or perpendicular) to the mirror plane. The matrix element of the photoemission process can be described by
where and are the initial- and final-state wave functions. In our experimental setup, the momentum of the final-state photoelectron is in the mirror plane and can be approximated by a plane wave. Therefore, is always even with respect to the mirror plane. Thus considering the spacial symmetry of the Fe 3 orbitals [Fig. 6(b)], when the analyzer slit is along the high-symmetry directions, the photoemission intensity of specific even (or odd) component of a band is only detectable with the (or ) polarized photons Polar1 ; Polar2 . For example, with respect to the mirror plane, the even orbitals (, , and ) and the odd orbitals ( and ) could be only observed in the and geometries respectively.
In the HT phase [Figs. 6(d1) and (e1)], ( and /) can be distinguished in the () geometry, indicating that their orbital characters should be even (odd). According to previous knowledge on iron pnictides Polar1 ; Polar2 , we can ascribe to the orbital, to the orbital, while / to the orbital along these momentum cuts. The intensity of band is weak in both and geometry, and thus it is hard to determine its orbital character. In the CT phase [Figs. 6(d2) and (e2)], , , and show up in both geometries, suggesting that they are mixtures of both odd and even orbitals. The band can be resolved in the geometry, so they should be made of even orbitals. While and are present in the geometry, indicating that their orbital characters should be odd.
The orbital characters of the band structure is summarized in Fig. 6(f). It is reasonable to deduce that and / may have the same origin for their similar polarization and dependencies [see Fig. 4 and Fig. 5]. On the other hand, and probably originate from a strong mixing of and during the remarkable electronic structure reconstruction, so that they appear in both and geometries.
III.3 Temperature dependence
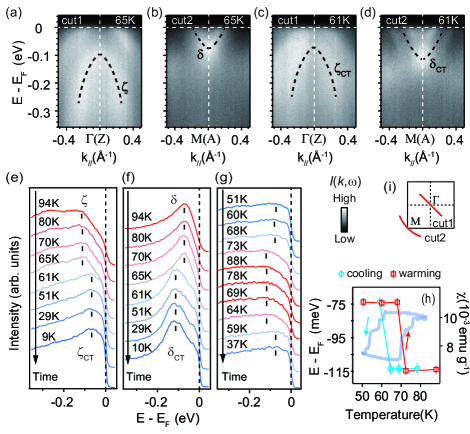
The detailed temperature dependence of photoemission data are shown in Fig. 7. The data collected on Ca1-xPrxFe2As2 ( = 0.15) in a sample cooling procedure are presented in Figs. 7(a)-(f). The representative photoemission intensity plots along cut 1 and 2 [illustrated in Fig. 7(i)] are shown in Figs. 7(a) and (b) for the HT phase, while those for the CT phase are presented in Figs. 7(c) and (d). The corresponding EDCs at () and () points are stacked in Figs. 7(e) and 7(f) respectively. The peak positions of () and () change discontinuously across the CT transition, indicating that the reconstruction occurs abruptly.
Since the magnetic susceptibility shows a hysteresis loop, it is intriguing to investigate whether a similar hysteresis could be observed for the electronic structure. The EDCs at the zone center taken in a warming-cooling cycle of a Ca1-xPrxFe2As2 ( = 0.1) sample are stacked in Fig. 7(g). The temperature dependence of band top of () band is summarized in Fig. 7(h). The clear hysteresis in the electronic structure reconstruction is qualitatively consistent with the bulk transport properties, which suggests the measured electronic structure somewhat reflects the bulk properties and the reconstruction is directly linked with the CT transition. Little deviation in the transition temperature is likely due to some sample variations.
IV DISCUSSION AND CONCLUSION
Previous theoretical works suggest that the remarkable change in the crystal structure across the CT transition, associated with the formation of As-As bonding non-magnetic_theory1 ; non-magnetic_theory2 ; As-As_bonding_1 , quenches the magnetic moments of Fe and leads to the electronic structure reconstruction in the CT phase of Ca1-xPrxFe2As2. However, compared with those of Ca(Fe1-xRhx)2As2 and the annealed CaFe2As2, the reconstruction across CT transition in Ca1-xPrxFe2As2 is rather different. In Ca(Fe1-xRhx)2As2 and the annealed CaFe2As2, the vanishment of hole cylindrical Fermi surface was argued to be intimately linked with the absence of superconductivity in the CT phase. However, the hole pocket still exists in the CT phase of Ca1-xPrxFe2As2, and the nesting condition still holds. This finding indicates that the absence of magnetic ordering and superconductivity in the CT phase is not necessarily correlated with the presence or absence of hole pocket.
Around the zone corner, four bands (, , and ) are found in the CT phase of Ca1-xPrxFe2As2, while only one electron-like band is found in the CT phase of Ca(Fe1-xRhx)2As2 and the annealed CaFe2As2. One possibility is that some of these bands might have a surface origin. However, the observed 12 and 21 surface reconstructions should contribute to the band folding at point rather than point 122_surface1 ; 122_surface2 , thus they are unlikely due to surface states. They are also unlikely caused by the weak magnetic ordering of praseodymium dopants at low temperatures CaPr_NMR , since it was shown before that the ordering of Eu moment in EuFe2As2 does not cause noticeable change to its low energy electronic structure 122_ARPES2 . Therefore, the unique band structure of Ca1-xPrxFe2As2 is likely intrinsic, but further band structure calculations are needed to investigate how these additional bands are caused by the CT structural transition.
Our data show that almost all the bands tend to be more dispersive in the CT phase than in the HT phase of Ca1-xPrxFe2As2. We applied parabolic-curve fittings to evaluate the effective mass of each band in these two phases in approximately the same plane. The effective mass of in the HT phase slightly reduces from 1.73 0.02 to 1.6 0.1 () in the CT phase. More evidently, the absolute values of the effective mass of and are 10.0 0.4 and 4.1 0.5 respectively. While in the CT phase, those values of and are 5.7 0.1 and 2.0 0.1 respectively. The reduction of effective mass indicates the suppression of electronic correlations in the CT phase, which is also the case in CaFe2As2 CaFe2As2_CT_ARPES_1 ; suppression_correlation_1 ; suppression_correlation_2 ; suppression_correlation_3 . For iron-based superconductors, it was proposed in the strong-coupling pairing scenario that the superconducting pairing is mediated by the local antiferromagnetic exchange interaction Strong-coupled , which is linked to the reasonably strong electronic correlations or narrow bandwidth ZRY . Since the Fermi surface topology might be less relevant, it is most likely that the weakened correlations in the CT phase suppress the magnetic fluctuation, and subsequently push the system into the non-superconducting regime ZRY .
In summary, we report detailed ARPES results on Ca1-xPrxFe2As2 ( = 0.1 and 0.15) single crystals. Across the CT transition, the sizable change in the crystal structure leads to the drastic electronic structure reconstruction. Our results show discrepancies with the band calculations of CaFe2As2 and significant mixing of different orbitals in the CT phase, which still call for further theoretical investigations. Instead of the lack of Fermi surface nesting between electron and hole Fermi surfaces, we propose that the weakening of electronic correlations might be responsible for the absence of magnetic ordering and superconductivity in the CT phase.
ACKNOWLEDGMENTS
Some of the preliminary data (not shown here) were taken at APE beamline of ELETTRA synchrotron light source. We gratefully thank Ivana Vobornik at ELETTRA, D. H. Lu and Y. Zhang at SSRL and Ming Shi at SLS for technical support. This work is supported in part by the National Science Foundation of China and National Basic Research Program of China (973 Program) under the grant Nos. 2012CB921402, 2012CB927401, 2011CB921802, 2011CBA00112, 2011CBA00106. D. W. Shen are also supported by the “Strategic Priority Research Program (B)” of the Chinese Academy of Sciences (Grant No. XDB04040300). SSRL is operated by the U. S. DOE Office of Basic Energy Science.
References
- (1) C. de la Cruz, Q. Huang, J. W. Lynn, J. Li, W. Ratcliff II, J. L. Zarestky, H. A. Mook, G. F. Chen, J. L. Luo, N. L. Wang, and P. Dai, Nature (London) 453, 899 (2008)
- (2) M. Rotter, M. Tegel, D. Johrendt, I. Schellenberg, W. Hermes, and R. Pöttgen, Phys. Rev. B 78, 020503(R) (2008)
- (3) X. H. Chen, T. Wu, G. Wu, R. H. Liu, H. Chen, and D. F. Fang, Nature (London) 453, 761 (2008)
- (4) M. Rotter, M. Tegel, and D. Johrendt, Phys. Rev. Lett. 101, 107006 (2008)
- (5) K. Sasmal, B. Lv, B. Lorenz, A. M. Guloy, F. Chen, Y.-Y. Xue, and C.-W. Chu, Phys. Rev. Lett. 101, 107007 (2008)
- (6) A. Kreyssig, M. A. Green, Y. Lee, G. D. Samolyuk, P. Zajdel, J. W. Lynn, S. L. Bud’ko, M. S. Torikachvili, N. Ni, S. Nandi, J. B. Leão, S. J. Poulton, D. N. Argyriou, B. N. Harmon, R. J. McQueeney, P. C. Canfield, and A. I. Goldman, Phys. Rev. B 78, 184517 (2008).
- (7) M. S. Torikachvili, S. L. Bud’ko, N. Ni, and P. C. Canfield, Phys. Rev. Lett. 101, 057006 (2008).
- (8) D. K. Pratt, Y. Zhao, S. A. J. Kimber, A. Hiess, D. N. Argyriou, C. Broholm, A. Kreyssig, S. Nandi, S. L. Bud’ko, N. Ni, P. C. Canfield, R. J. McQueeney, and A. I. Goldman, Phys. Rev. B 79, 060510 (2009).
- (9) T. Yildirim, Phys. Rev. Lett. 102, 037003 (2009)
- (10) W. Ji, X.-W. Yan, and Z.-Y. Lu, Phys. Rev. B 83, 132504 (2011)
- (11) J. H. Soh, G. S. Tucker, D. K. Pratt, D. L. Abernathy, M. B. Stone, S. Ran, S. L. Bud’ko, P. C. Canfield, A. Kreyssig, R. J. McQueeney, and A. I. Goldman, Phys. Rev. Lett. 111, 227002 (2013)
- (12) H. Gretarsson, S. R. Saha, T. Drye, J. Paglione, J. Kim, D. Casa, T. Gog, W. Wu, S. R. Julian and Y.-J. Kim, Phys. Rev. Lett. 110, 047003 (2013)
- (13) A. I. Coldea, C. M. J. Andrew, J. G. Analytis, R. D. McDonald, A. F. Bangura, J.-H. Chu, I. R. Fisher, and A. Carrington, Phys. Rev. Lett. 103, 026404 (2009)
- (14) S. Ran, S. L. Bud’ko, D. K. Pratt, A. Kreyssig, M. G. Kim, M. J. Kramer, D. H. Ryan, W. N. Rowan-Weetaluktuk, Y. Furukawa, B. Roy, A. I. Goldman, and P. C. Canfield, Phys. Rev. B 83, 144517 (2011).
- (15) S. R. Saha, N. P. Butch, T. Drye, J. Magill, S. Ziemak, K. Kirshenbaum, P. Y. Zavalij, J. W. Lynn, and J. Paglione, Phys. Rev. B 85, 024525 (2012).
- (16) K. Tsubota, T. Wakita, H. Nagao, C. Hiramatsu, T. Ishiga, M. Sunagawa, K. Ono, H. Kumigashira, M. Danura, K. Kudo, M. Nohara, Y. Muraoka, and T. Yokoya, J. Phys. Soc. Jpn. 82, 073705 (2013).
- (17) R. S. Dhaka, R. Jiang, S. Ran, S. L. Bud’ko, P. C. Canfield, B. N. Harmon, A. Kaminski, M. Tomić, R. Valentí, and Y. Lee, Phys. Rev. B 89, 020511(R) (2014).
- (18) K. Gofryk, B. Saparov, T. Durakiewicz, A. Chikina, S. Danzenbächer, D. V. Vyalikh, M. J. Graf, and A. S. Sefat, Phys. Rev. Lett 112, 186401 (2014)
- (19) Y.-Z. Zhang, H. C. Kandpal, I. Opahle, H. O. Jeschke, and Roser Valentí, Phys. Rev. B 80, 094530 (2009)
- (20) M. Tomić, R. Valentí, and H. O. Jeschke, Phys. Rev. B 85, 094105 (2012)
- (21) B. Lv, L. Deng, M. Gooch, F. Wei, Y. Sun, J. K. Meen, Y.-Y. Xue, B. Lorentz, and C.-W. Chu, Proc. Natl. Acad. Sci. U.S.A. 108, 15705 (2011)
- (22) Y. Qi, Z. Gao, L. Wang, D. Wang, X. Zhang, C. Yao, C. L. Wang, C. D. Wang, and Y. Ma, Supercond. Sci. Technol. 25, 045007 (2012)
- (23) L. Ma, G.-F. Gi, J. Dai, S. R. Saha, T. Drye, J. Paglione, and W.-Q. Yu, Chin. Phys. B 22, 057401 (2013)
- (24) I. Zeljkovic, D. Huang, C.-L. Song, B. Lv, C.-W. Chu, and J. E. Hoffman, Phys. Rev. B 87, 201108(R) (2013)
- (25) K. Gofryk, M. Pan, C. Cantoni, B. Saparov, J. E. Mitchell, and A. S. Sefat, Phys. Rev. Lett. 112, 047005 (2014)
- (26) S. R. Saha, N. P. Butch, K. Kirshenbaum, J. Paglione, and P. Y. Zavalij, Phys. Rev. Lett. 103, 037005 (2009)
- (27) Z. R. Ye, Y. Zhang, F. Chen, M. Xu, J. Jiang, X. H. Niu, C. H. P. Wen, L. Y. Xing, X. C. Wang, C. Q. Jin, B. P. Xie, and D. L. Feng, Phys. Rev. X 4, 031041 (2014)
- (28) E. van Heumen, J. Vuorinen, K. Koepernik, F. Massee, Y. Huang, M. Shi, J. Klei, J. Goedkoop, M. Lindroos, J. Van den Brink, and M. S. Golden, Phys. Rev. Lett. 106, 027002 (2011)
- (29) Y.-B. Huang, R. Pierre, J.-H. Wang, X.-P. Wang, X. Shi, N. Xu, Z. Wu, A. Li, J.-X. Yin, T. Qian, B. Lv, C.-W. Chu, S.-H. Pan, M. Shi, and H. Ding, Chin. Phys. Lett. 30, 017402 (2013)
- (30) C. Liu, T. Kondo, N. Ni, A. D. Palczewski, A. Bostwick, G. D. Samolyuk, R. Khasanov, M. Shi, E. Rotenberg, S. L. Bud’ko, P. C. Canfield, and A. Kaminski, Phys. Rev. Lett. 102, 167004 (2009)
- (31) F. Chen, Y. Zhang, J. Wei, B. Zhou, L. X. Yang, F. Wu, G. Wu, X. H. Chen, and D. L. Feng, J. Phys. Chem. Sol. 72, 469-473 (2011).
- (32) Y. Zhang, F. Chen, C. He, B. Zhou, B. P. Xie, C. Fang, W. F. Tsai, X. H. Chen, H. Hayashi, J. Jiang, H. Iwasawa, K. Shimada, H. Namatame, M. Taniguchi, J. P. Hu, and D. L. Feng, Phys. Rev. B 83, 054510 (2011)
- (33) Y. Zhang, C. He, Z. R. Ye, J. Jiang, F. Chen, M. Xu, Q. Q. Ge, B. P. Xie, J. Wei, M. Aeschlimann, X. Y. Cui, M. Shi, J. P. Hu, and D. L. Feng, Phys. Rev. B 85, 085121 (2012)
- (34) N. Colonna, G. Profeta, A. Continenza, and S. Massidda, Phys. Rev. B 83, 094529 (2011)
- (35) B. Zhou, Y. Zhang, L. X. Yang, M. Xu, C. He, F. Chen, J. F. Zhao, H. W. Ou, J. Wei, B. P. Xie, T. Wu, G. Wu, M. Arita, K. Shimada, H. Namatame, M. Taniguchi, X. H. Chen, and D. L. Feng, Phys. Rev. B 81, 155124 (2010).
- (36) Y. Furukawa, B. Roy, S. Ran, S. L. Bud’ko, and P. C. Canfield, Phys. Rev. B 89, 121109(R) (2014)
- (37) J. Diehl, S. Backes, D. Guterding, H. O. Jeschke, and Roser Valentí, Phys. Rev. B 90, 085110 (2014)
- (38) S. Mandal, R. E. Cohen, and K. Haule, Phys. Rev. B, 90, 060501(R) (2014)
- (39) J. Hu and H. Ding, Sci. Rep. 2, 381 (2012).